HAL Id: halshs-00716859
https://halshs.archives-ouvertes.fr/halshs-00716859
Submitted on 11 Jul 2012
HAL is a multi-disciplinary open access archive for the deposit and dissemination of sci-entific research documents, whether they are pub-lished or not. The documents may come from teaching and research institutions in France or abroad, or from public or private research centers.
L’archive ouverte pluridisciplinaire HAL, est destinée au dépôt et à la diffusion de documents scientifiques de niveau recherche, publiés ou non, émanant des établissements d’enseignement et de recherche français ou étrangers, des laboratoires publics ou privés.
The Role of Complementarity and the Financial
Liberalization in the Financial Crisis
Adeline Saillard
To cite this version:
Adeline Saillard. The Role of Complementarity and the Financial Liberalization in the Financial Crisis. 2012. �halshs-00716859�
Documents de Travail du
Centre d’Economie de la Sorbonne
The Role of Complementarity and the Financial
Liberalization in the Financial Crisis
Adeline S
AILLARDThe Role of Complementarity and the Financial
Liberalization in the Financial Crisis
Adeline Saillard∗
June 4, 2012
Abstract
This study provides evidence of the role played by the financial structure and the lib-eralization in the crisis for low, middle and high income countries classified by geographic region. The traditional view of the financial structure-bank vs market based economies- is challenged by using a the concept of complementarity. We find, as measured by the index proposed in Saillard and Url (2011) the complementary systems to be less vulnerable to financial crises and countries with a low level of liberalization in the financial markets and the banking sectors.
Resum´e
Ce papier ´etudie le rˆole jou´e par la structure financi`ere et la lib´eralisation pour expliquer la crise ´economique. L’´echantillon de pays est class´e selon son niveau de d´eveloppement ´economique et g´eographiquement. La structure financi`ere est repr´esent´ee par un nouveau concept : la compl´ementarit´e entre les banques et le march´e financier au sein d’un pays. Ce concept est repr´esent´e par un index d´etaill´e dans Saillard et Url (2011). Les syst`emes compl´ementaires et les moins lib´eralis´es sont moins vuln´erable face `a une crise ´economique.
Key Words: Bank-based, Market-based, Complementarity, Crisis, Financial structure Mots Clefs: Compl´ementarit´e, Crises, Structure financi`ere
JEL-Codes: G10, G18, E44
∗University of Paris I Panth´eon-Sorbonne (CES) - Paris School of Economics, 106-112 Boulevard de l´ Hopital
75013 Paris, France
Email: Adeline.Saillard@univ-paris1.fr
The author would like to thank Bruno Amable, Karim Azizi, Jean-Charles Bricongne and Serguei Kaniovski, and the participants of the Economic of Institutions Seminar for helpful comments and suggestions on a preliminary version of this paper.
1
Introduction
The financial crisis of 2008 caused protracted episodes of falling stock prices and mounting credit losses. The ensuing economy-wide deleveraging made channeling savings to investment difficult for both banks and stock markets, a credit crunch loomed. The European sovereign debt crisis of 2011 put a further strain on the European banking system, producing a protracted bear market characterized by declining values and falling prices. The crisis of 2008 originated in the USA, a traditionally market-based economy, and spilled to the bank-based economies of continental Europe. Policy makers now face the challenge of restoring financial and economic stability, and preventing similar crises in the future.
In this paper we assess how the degree of interconnectedness between banks and stock mar-kets affects the frequency and the severity of economic crises. The apparent high degree of interconnectedness between the fates of banks and stock markets in most countries blurs the distinction between bank and market based economies that has a long tradition in comparative financial systems and applied macroeconomics. The global financial and economic crisis of 2008 originated in the USA, a traditionally market-based economy, and spilled to the bank-based economies of continental Europe. The two types of financial systems differ with respect to the share of financial activity channeled through either the stock market or private banks. Bank-based financial systems are prevalent in continental Europe with Germany being a prime example and Switzerland a notable exception, while financial systems in the Anglo-Saxon countries are heavily market-based.
Existing research on the role of financial architecture has focused on the role of financial architecture in fostering economic growth. Demirguc-Kunt and Levine (2001), Back and Levine (2002) have shown the positive effect of financial development of economic growth is only weakly
effected by the disparities in the relative development of stock markets and banking sectors. Levine (2002) showed that differences in the overall level of financial development are more important for growth than financial structure. Existing empirical evidence on the neutrality of the financial structure for economic growth is not entirely conclusive. For example, Tadesse (2002) finds that the performance of market based systems are better than that of bank based systems if the level of development of the financial sector is high, yet bank systems are more efficient for countries with underdeveloped financial sectors. Deidda and Fattouh (2008) show that a bank-based system to a mixed system in which there is a high degree of complementarity between banks and markets can be detrimental to economic growth.
The main hallmarks of financial development are the efficiency and the efficacy of assessing creditworthiness of prospect borrowers and the stock market capitalization as an indicator of costs of obtaining external finance. By the virtue of a close bilateral relationship between the borrower and the lender, banks are considered better in assessing credit risks, while well-developed stock markets help reduce the cost of equity capital. The bank based versus market based view underscores the competition between these two alternative sources of external finance, suggesting that technological development in one sector leads to a shift of demand for external finance to that sector, at the expense of the other sector.
This competition view hides an important feedback loop between cheap equity and credit. Lower costs of equity capital helps banks to raise capital needed to meet the higher capital requirements associated with riskier loans. This allows providing capital to borrowers that would otherwise not have been funded. The prevailing view that banks and stock markets compete for funds has been replaced by the idea of co-evolution of both sources of external finance (Song and Thakor 2010), and the idea of complementarity between banks and stock markets (Sylla 1998, Song and Thakor 2010). Sylla is among the first to describe a potential
complementarity that may exist between stock markets and banks. For him, this interaction emerged due to what he called himself the ‘Federalist financial revolution’ in the US. It was a ‘jump starter’ of US economic changes such as the industrial revolution and the transportation revolution. Song and Thakor (2010) propose a theoretical model showing that systems with a high degree of complementary are more efficient, stressing the importance of this classification over the traditional market-bank based view. In an empirical investigation, Saillard and Url (2011) find that the degree of complementary is positively and significantly correlated with efficiency in the financial markets.
The recent financial and economic crisis has spurred a debate on the stability of global financial architecture, and the appropriate economic policies to improve stability in the future. In this paper we take the complementarity view as a point of departure, and test whether the degree of complementarity has a discernible statistical relationship on the frequency and the severity of economic crises. To this end, we developed a newly complementarity metric (index), suggested in Saillard and Url (2011), and employ this measure together with a number of explanatory variables reflecting some characteristics the institutional and legal realities in 72 countries of the world.
These characteristics are important for several reasons. First, as have been mentioned above, the two systems differ not only in the relative importance of bank based finance but also in their institutional frameworks. The existing literature stresses political determinants such as the degree of liberalization as important determinant of economic growth in general, and the performance of an economy in times of crises in particular. Second, recipes for counteracting crises are likely to be different for developing countries than for developed countries. A survey of the finance growth nexus by Andersen and Tarp (2003) suggests that policymakers in the developing countries should not necessarily aim for the traditional financial liberalization policies.
Misati and Nyamongo (2010) argue that financial liberalization in Sub-Saharan Africa has had a negative impact in the growth of this area. Third, and related, different countries resort to different counteracting measures and these have to be taken into account, or at least controlled for, when discussing the effect of financial system on the occurrence of crises ex post.
The paper is structured in the following way. In the next section, we provide details on the theoretical background and the computation of the complementary index. Section 3 discusses the data and defines the variables used in the subsequent econometric analysis in Section 4. A list of variables is provided in an appendix at the end of the paper. The last section discusses the results and offers concluding remarks. Briefly anticipating our results, we find that, all other things being equal, the lower the complementarity and the more liberal the financial system, the more susceptible it is to financial distress measured by a significant loss in an economy’s real GDP. The conclusions is that while compelementarity between the development of banks and the stock market plays an important role in fostering economic growth, it also contributes to economic instability as measured by the variance of growth rates.
2
Computation Method of the Financial Indeces
Currently in the literature, two indices represents two interactions between banks and markets: one represents the competition whereas the other represents the complementarity. The section is divided into two parts, we start with the computation of the index representing competition suggested by Demirguc-Kunt and Levine (1999) and the computation of the complementarity index proposed in Saillard and Url (2011).
The measure for financial market structure suggested by Demirguc-Kunt and Levine (1999) is a continuous number increasing in the extent of market-based finance of domestic firms.
The index compares the level of financial activity channeled through the stock market to that facilitated by private banks. The index combines deposits at banks, DB, private credit by banks, PCB, overhead costs of banks, OCB, the stock market capitalization, SMC, and the stock market total traded value, SMT. The first two components of the index are the ratio of the stock market capitalization to deposits at banks, Ait, and the ratio of the stock market total traded value to
private credit by banks, Bit:
Ait= SM Cit DBit Bit= SM Tit P CBit (1)
Both components are computed for each country i and year t. Furthermore, Demirguc-Kunt and Levine (1999) use the ratio of bank overhead costs to total assets of banks and multiply it by the stock market total traded value to GDP ratio to compute the third component, Cit:
Cit = OCBit T ABit SM Tit GDPit (2)
Then all three components, Ait, Bit, and Cit are mean corrected by subtracting the mean
over all countries and years, cf. in the case of the stock market capitalization to deposit at banks ratio we obtain:
ait= (Ait− A..)
where A.. represent the mean of Ait across countries and years. Finally, the index of financial
market structure, IFMSit, is computed as the average of the three components:
IF M Sit=
ait+ bit+ cit
A higher value of this index clearly indicates a higher degree of market-based finance for country i. In order to obtain a measure of complementary financial markets we rearrange the first two components of the index by Demirgurc-Kunt and Levine so that they increase if marked and bank-based characteristics within a country are balanced. Specifically, we compute products rather than ratios between marked- and bank-based variables and normalize all variables with respect to GDP to make numbers comparable across countries:
A∗ it= DBit GDPit SM Cit GDPit B∗ it= P CBit GDPit SM Tit GDPit (3)
The modified ratios achieve a maximum value if market- and bank based finance are of equal size, reflecting the idea of complementary rather than competitive financial markets. This hump−shape pattern is illustrated in Figure ICindex for stylized economies with either loan or equity finance. If the country is fully market-based, firms will be completely financed by equity and the country will show up on the origin of the horizontal axis. Fully bank-based economies, on the other hand, will show up at the right hand corner. The index of complementarity will consequently have low values at both extrema points and will have its maximum if market- and bank-based features are balanced. The third indicator, Cit, does not have a similar reinterpre-tation; we therefore take Cit as in Demirguc-Kunt and Levine. Again we subtract means across
countries and years from the modified components, making the index of complementary finance, ICit, increasing in the size of financial markets within country i relative to the sample average:
ICit= a∗ it+ b ∗ it+ cit 3
The index of complementarity is computed in Saillard and Url (2011a) and tested in Saillard and Url (2011b) considering a panel of 19 OECD countries. In this last paper, authors validates
the Song and Thakor complementarity theory by finding that complementarity represented by the index can explain the degree of the efficiency in the financial systems.
The preceding framework is provided as a starting point to represent the complementarity in an empirical study. The next section is devoted to describe the data and empirical models.
3
Data
Computation of the financial crisis As emphasized by Pitlik (2011), the definition concerning the measure of what constitute a crisis is not uniform in the literature. Specially, this paper studies two potential determinants of a financial crisis: the financial structure and the financial liberalization. In line with Pitlik (2011) and Duval and Elmesov (2006), I use the output gap crisis definition. Specifically, if a negative output gap of at least 4% can be observed for at least two consecutive years over a five year period, we call this an output gap crisis. The output gap is computed from the trend and cycle extracted using the Hodrick-Prescott filter.
The method of the HP filter is illustrated by Ravn and Uhlig (2002). The program of minimization can be written as follow:
min τt τ X τ=1 ((yit− τt)2+ λ((τt+1− τt) − (τt− τt−1))2)
By using this program, the filter removes a smooth trend τtfrom yit, the GDP for the panel
considered. The cycle component or residual or deviation from the trend is identified by yit− τt.
As underlined, by Ravn and Uhlig λ, the smoothing parameter penalizes the acceleration of the trend relative to the cycle component. Both authors demonstrated that λ=6.25 is adequate for yearly data. I follow it to obtain the output gap crisis dependent variable definition defined earlier.
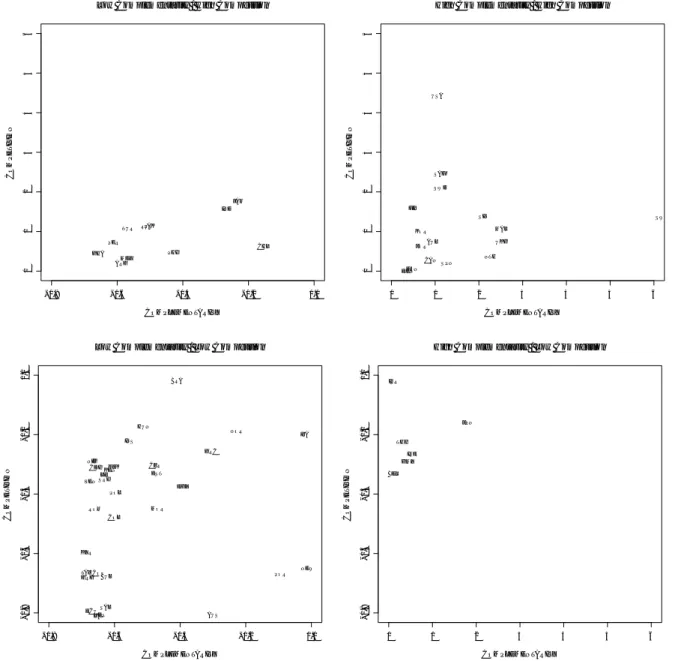
Complementarity Index. To represent the financial structure, I will use the index computed in Saillard-Url (2011). This index follows the recent theory of Song and Thakor (Song and Thakor 2010). Both authors stress that it would be more relevant to use the complementarity-complementer vs non complementarity-complementer systems- to study the concept of finance structure. In the Figure 1, a classification of the countries, by groups following the level of competition (bank vs market based) and complementarity is proposed. As indicated in this figure, the most advanced countries are those with a high value of the complementarity and competition index with South Africa as notable exception.
Figure 1: The Complementarity and the Competition (Levine) indexes −0.8 −0.6 −0.4 −0.2 0.0 0 1 2 3 4 5 6
Low Complementarity / High Competition
COMPLEMENTARITY COMPETITION ARG CHL GHA IND JAM MEX PAK PER PHI RUS TUR 0 1 2 3 4 5 6 0 1 2 3 4 5 6
High Complementarity / High Competition
COMPLEMENTARITY COMPETITION AUL CAN DEN FIN FRN JOR KOR MAL NTH SIN SAF SPN SWD SWZ UKG USA −0.6 −0.4 −0.2 0.0
Low Complementarity / Low Competition
COMPETITION AUS BRA BUL COL COS CDI CZR ECU EGY SAL EST GRG GRC HUN INS ITA KZK KEN KYR LAT LIT MOR NEP NEW NIG NOR POL POR ROM SRI TAZ VEN −0.6 −0.4 −0.2 0.0
High Complementarity / Low Competition
COMPETITION BEL GMY IRE ISR JPN THI 10
Financial Reform Index. The database (Abiad, Detragiache, Tressel 2008)) considers seven dimensions of financial reform: credit controls reserve requirements, interest rate controls, entry barriers, state ownership, policies on securities markets, banking regulation and restrictions on the financial account. For each of this seven variables, the authors compute a score representing liberalization. The main advantage of this database is that it allows to study the broad concept of liberalization without restricting into a binary score. Moreover, considering the period 1973-2005 allows to study crises in 1990s. Another advantage of this database is that it allows to consider reforms decided for the financial markets and banks. It is useful for testing the Song and Thakor proposal on regulation, i.e take in consideration , politically, both market and banks in the decisions.
I choose the variable openness of the economy as crisis determinants, this choice being guided by the literature. The literature is divided concerning the impact of this variable. Chang et all (2005) describe the debate existing about the importance of international trade openness on economic growth. Specifically, Rodriguez and Rodrik (2000) address the principal question why openness can be detrimental.
The variable used in this currently paper is the degree of openness in an economy. (see Appendix for further details).
Table 1: Summary Statistics
Variable Mean Std. Dev. Min. Max. N
Crisis 0.391 0.488 0 1 335 Complementarity 0.063 1.385 -0.690 14.870 1109 Competition 0.052 1.227 -1.084 13.548 1109 Reform 10.888 6.389 0 21 1769 Government Consumption 8.922 3.979 0.288 38.365 3560 Inflation 27.496 266.0 -21.675 11749 3905 Openness -0.001 1.522 -1.844 2.478 5885
4
Estimation results
The following regression analysis proceeds in two steps. We first test whether the scale and scope of financial liberalization reflected in the financial reform index has an impact on the degree of complementarity and competition between the banking sector and the stock market. The main objective of this preliminary analysis is to uncover the interplay between financial structure and financial liberalization that has been suggested in the literature (Andersen 2003 and Ling Sun Jiang 2009). The degrees of complementarity and competition are given by the complementarity index detailed above and the Levine index (Levine 2004), respectively. As we noted above, the complementarity index summarizes the degree of interconnectedness of the banking sector and the stock market. Higher values of the complementarity index correspond to higher degrees of complementarity. The IMF financial reform index summarizes institutions, policy measures and regulations, such that the higher the index value the more liberal the financial system of a country is. The estimates are obtained using the panel OLS, as the dependent variables can
assume a continuum of values. These estimates are summarized in Table 3. Table 2: Correlation Matrix
Complementarity 1 Competition 0.466*** 1 Reform 0.377*** 0.273*** 1 Inflation -0.0492 -0.0381 -0.0808*** 1 Government Consumption 0.0557* -0.0454 0.0193 -0.000997 1 Openness 0.334*** 0.143*** 0.697*** -0.0922*** 0.0959*** 1 *** p<0.01, ** p<0.05, * p<0.1
The degree of financial liberalization has a positive and statistically significant effect on both the degree of complementarity and the degree of competition. Both effects have roughly similar magnitudes but are, quantitatively small. The estimates convey that one point increase on the Financial Reform scale would increase the complementarity index by 0.06, or roughly 4 percent of a standard deviation of the complementarity index (see summary statistics in Table 1). Such an increase in the reform indicator would correspond, for example, to the difference between Switzerland (index value of 20) and Germany (index value of 19) in 2005. The coefficient of determination, R2, attests modest explanatory power in these very parsimonious specifications.
The Hausman specification test rejects fixed effects in favor of random effects.
Preliminary results collected in Table 3 together with significantly positive correlation coeffi-cients between the measures of complementarity and financial liberalization reported in Table 2 indicate the need to model the interaction between complementarity and financial liberalization in a regression1. We do so with (linear) interaction terms in the second step of our estimation procedure.
1The Breusch-Pagan test indicates a large chi-square for both models which indicate that heteroscedasticity
Table 3: Panel OLS Random Effects
(1) (2)
Dep. Variable Complementarity Competition
Reform 0.0590*** 0.0849*** (0) (0) Constant -0.957*** -1.344*** (3.76e-07) (0) Observations 936 936 Number of countries 74 74
R-squared overall model 0.142 0.0745
pval in parentheses *** p<0.01, ** p<0.05, * p<0.1
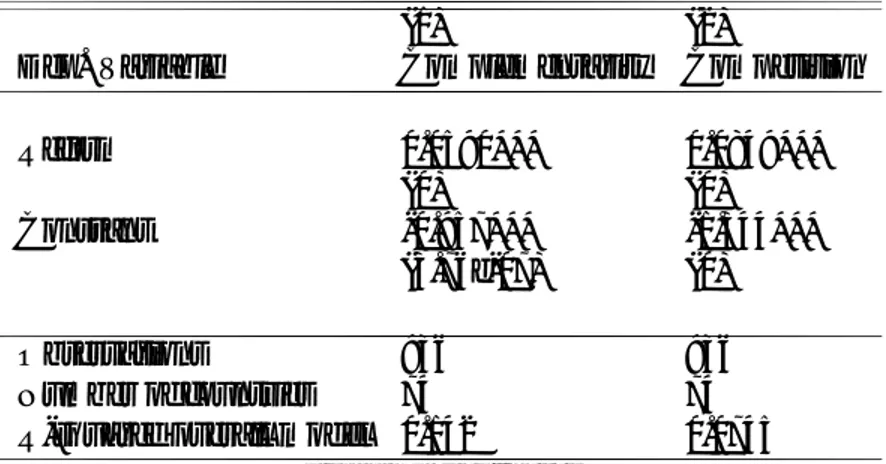
In a second step we model the incidence of a major economic crisis, defined as a 4 percent decline in the real per capita GDP sustained over five years, using the degree of complementarity, competition and liberalization. The annual binary variables are coded such that it takes the value of one if an economic crisis according to the above definition occurs in that year. To control for long term macroeconomic factors that may influence the likelihood of a major economic crisis, we include several additional explanatory variables such as the size of the country, relative size of the public sector, the degree of economic openness and broad regional indicator variables.
The binary nature of the dependent variable largely determines the choice of suitable regres-sion techniques. We opt for a panel logit regresregres-sion with random effects, and reestimating the regression in the few cases in which the presence of fixed effects cannot be ruled out on the basis of a Hausman specification test. The maximum likelihood estimates of panel logit regressions are presented in Table 4. The reported (slope) coefficients give the rate of change in the ‘log odds’ of the crisis variable as a result of a change in the explanatory variable.
A negative coefficient in a logit regression indicates that an increase in the explanatory variable decreases the likelihood of a major economic crisis, and we observe negative coefficients
on both complementarity and competition measures in all six specifications. Their effects remain negative even after factoring in the coefficients on the interaction terms. Indeed, evaluated at mean of Reform (see, Table 1), the coefficient on Complementarity in the first specifications equals -1.498.
The main effect of liberalization is positive, meaning that, all other things being equal, more liberal economies are more susceptible to severe economic to downturns. Again, the positive sign remains after accounting for the interaction term. In all specifications featuring the com-plementarity index this effect is highly statistically significant, whereas Levine’s competition measure fairs slightly worse in terms of statistical significance. The χ2 test supports random effects hypothesis, while McFadden’s R2 indicates a satisfactory fit.2
Turning to the other explanatory variables, we find that, all other things being equal, large and open economies are more susceptible to financial and economic crises on average. This result is not surprising given that demand slackening during an economic downturn typically propagates via foreign trade, dragging open economies in its wake. The size effect is attributed to the fact that economic crisis in large countries tend to be global crises rather than idiosyncratic developments in the particular country in question. Put differently, ones large countries are affected, one can be sure to have a severe and largely international crisis developing.
The level of government consumption, as an indicator of the size of the public sector relative to the rest of an economy does not have any explanatory power for the likelihood of a major crisis. This is surprising, given that the size of automatic stabilizers and the scope of anticrisis (especially fiscal) measures that are aimed at mitigating the adverse effects of the crisis tend to increase the size of the public sector relative to the rest of the economy. This effect, however, is
2The interpretation on McFadden’s pseudo coefficient of determination, as well as many other such measure
must taken with care in the context of generalized linear models (McCullagh and Nelder, 1989) and their panel derivatives. In particular, the measure is not bounded to the unit interval.
not statistically significant.
In sum, the estimates in Table 4 that financial systems with a highly liberalized financial system with a low degree of complementarity between bank and stock market are more vulnerable to a crisis occurrence. This statement is true on average for all countries in the sample. Countries in some regions are, however, more vulnerable to economic crises, the Sub Saharan Africa and Transition countries being the most susceptible, while advanced and emerging Asian economies being least prone to financial and economic crises. The comparison group is that of Middle East and North African countries.
5
Conclusions
This paper shows that financial structure and financial liberalization, all other thing being equal, increase the likelihood of a major economic crisis. The key characteristic of the financial structure is the degree of complementarity between banking and stock-market finance. The degree of complementarity generalizes the notion of bank-based and market-based economies prevalent in earlier literature on finance-growth nexus, and on the macroeconomic effect of financial architecture in general. Regression estimates on the likelihood odds of a major economic crisis shows that, on average, the higher the complementarity, the lower is the probability of a crisis. Further, it is shown that the degree of financial liberalization also increases the likelihood of a crisis.
A number of conclusions can be drawn from the results presented in the foregoing sections. We have indicated that liberalization may increase the likelihood of economic crises. The open question is whether curtailing liberalization is an option that could make the financial system more stable. Ling Sun Jiang (2009) have argued that measures to promote liberalization have
to be tailored to the economic realities, the degree of financial development and the financial structure of an economy.
This focus on the role of financial structure, and the interplay between regulation and the financial structure has been stressed by Song and Thakor (2010), who warn about the simplistic competition view of the financial structure. Their theoretical findings call for an alternative regulation at the policy level and a different definition of the financial structure. Specifically, Song and Thakor suggest considering simultaneously regulation in financial markets and the banking industry. The financial reform index used in this paper allows pursuing this suggestion because it offers a multi-faceted and an inclusive measure of the state the financial markets and the banking sectors, and the reforms in them. Thus in this paper we challenge the traditional definition of bank versus market based economies by using modeling 1) complementarity and 2) the interaction between the financial structure and the level of financial liberalization as the main institutional determinant.
Table 4: Panel logit on Crisis (1) (2) (3) (4) (5) (6) Complementarity -3.632*** -4.087*** -3.767*** (0.985) (1.110) (1.008) Complementarity×Reform 0.196*** 0.216*** 0.199*** (0.0502) (0.0565) (0.0512) Competition -0.516 -0.269 -0.130 (0.477) (0.476) (0.438) Competition×Reform 0.0519* 0.0350 0.0233 (0.0290) (0.0285) (0.0259) Reform 0.251*** 0.361*** 0.315*** 0.155*** 0.250*** 0.204*** (0.0489) (0.0574) (0.0575) (0.0409) (0.0484) (0.0489) Government Consumption -0.0664 -0.0662 -0.0238 -0.0337 (0.0575) (0.0486) (0.0561) (0.0470) Openness -0.442*** -0.248** -0.480*** -0.274** (0.118) (0.114) (0.118) (0.114) Inflation 0.00132** 0.00135** 0.00142** 0.00142** (0.000585) (0.000583) (0.000600) (0.000593) Advanced -1.514** -1.458** (0.635) (0.647) Emerging Asia 0.324 -0.0192 (0.652) (0.638) Latin America -0.776 -0.639 (0.616) (0.620) Sub-Saharan Africa 0.797 0.761 (0.727) (0.728) Transition 1.912*** 1.953*** (0.737) (0.737) Constant -4.156*** -4.991*** -4.139*** -2.326*** -3.192*** -2.276** (0.857) (1.022) (1.054) (0.684) (0.887) (0.909) Observations 934 886 886 934 886 886 Number of countries 73 70 70 73 70 70 χ2 Statistic 30.56 46.14 64.84 26.27 40.98 58.03 Panel-level Std. Dev. 1.666 1.546 1.045 1.764 1.573 1.050 Standard errors in parentheses
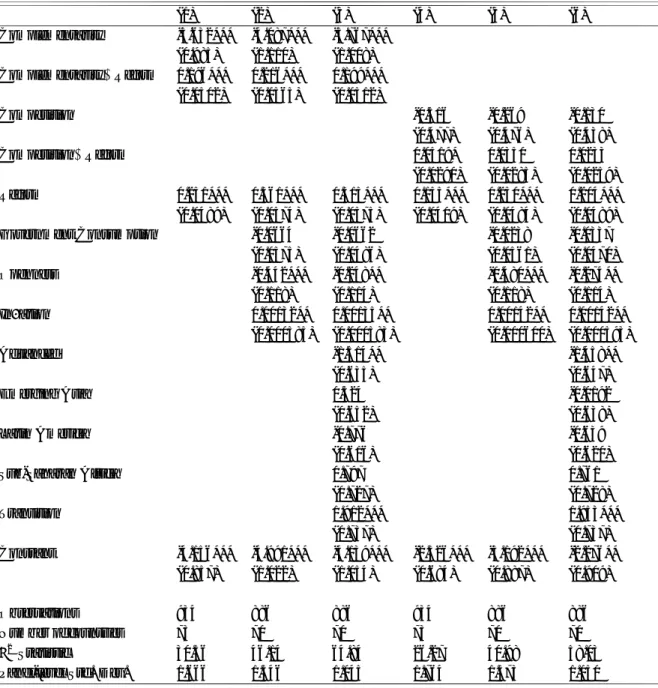
Table 5: Panel logit on Crisis with index components (1) (2) (3) (4) (5) (6) A(comp) -11.73*** -7.333*** -6.111** (2.747) (2.769) (2.526) B(comp) 4.308 -1.593 -2.406 (4.066) (4.884) (4.640) C(comp) 130.8 89.50 100.7 (84.64) (91.56) (85.08) A(comp)×Reform 0.618*** 0.401*** 0.326** (0.142) (0.143) (0.130) B(comp)×Reform -0.236 0.0565 0.114 (0.210) (0.249) (0.237) C(comp)×Reform -5.990 -4.087 -4.814 (4.301) (4.636) (4.315) A -1.140* -0.534 -0.328 (0.692) (0.694) (0.640) B 2.531* 3.477** 3.563*** (1.409) (1.454) (1.378) C -172.3* -342.8*** -320.5*** (96.68) (111.5) (103.0) A×Reform 0.0759 0.0522 0.0252 (0.0471) (0.0477) (0.0437) B×Reform -0.105 -0.161** -0.163** (0.0791) (0.0810) (0.0758) C×Reform 8.842* 17.11*** 16.11*** (4.831) (5.541) (5.143) Reform 0.107*** 0.197*** 0.167*** 0.0862** 0.201*** 0.171*** (0.0370) (0.0456) (0.0456) (0.0406) (0.0491) (0.0490) Government Consumption -0.0837 -0.0799 -0.0269 -0.0375 (0.0605) (0.0508) (0.0552) (0.0457) Inflation 0.00119** 0.00120** 0.00193*** 0.00193*** (0.000596) (0.000590) (0.000696) (0.000713) Openness -0.406*** -0.218* -0.472*** -0.258** (0.122) (0.117) (0.118) (0.114) Advanced -1.387** -1.223* (0.653) (0.626) Emerging Asia 0.385 0.252 (0.672) (0.619) Latin America -0.719 -0.346 (0.630) (0.600) Sub-Saharan Africa 0.926 1.141 (0.746) (0.724) Transition 2.078*** 2.140*** (0.764) (0.714) Constant -1.495** -1.873** -1.398 -1.467** -2.655*** -2.134** (0.621) (0.294) (0.887) (0.318) (0.361) (0.885) Observations 934 886 886 934 886 886 Number of countries 73 70 70 73 70 70 χ2 Statistic 39.68 46.85 64.17 32.33 48.42 68.50 Panel-level Std. Dev. 1.765 1.625 1.071 1.717 1.523 0.985
6
References
Abiad A,Tressel T and Detragiache E, 2008. A New Database of Financial Reforms, IMF Working Papers 08/266, International Monetary Fund.
Allegret J.-P. , Courbis B. and Dulbecco Ph. , 2003. Liberalization and Stability of the Financial System in Emerging Markets: The Institutional Dimension of Financial Crises Review of International Political Economy , Vol. 10, No. 1 (Feb.,2003 ), pp. 73-92
Tadesse, Solomon, 2002. Financial Architecture and Economic Performance: International Evidence, Journal of Financial Intermediation, Elsevier, vol. 11(4), pages 429-454, October.
Misati R N, Nyamongo EM, 2010. Financial Liberalization, Financial Fragility And Eco-nomic Growth In Sub-Saharan Africa. Journal of Financial Intermediation.
Andersen and Tarp . 2003, Financial Liberalization, Financial Development and Economic Growth in LDCs Journal of Financial Development,
Demirguc-Kunt, A. and Levine, R. , 1999. Bank-based and market-based financial systems: cross-country comparisons, Policy Research Working Paper Series 2143, The World Bank.
Sylla, R. (1998). US securities markets and the banking system, 1790-1840, Federal Reserve Bank of St. Louis Review, vol. 80(3), pp. 83104.
Song, F. and Thakor, A. V., 2010 Financial System Architecture and the Co-evolution of Banks and Capital Markets, Economic Journal, 120, 1021-1055.
Chang R., Kaltani L.and Loayza, N. V., 2009. Openness can be good for growth: The role of policy complementarities. Journal of Development Economics
Saillard, A. and Url, T., 2011. Venture capital in bank - and market - based economies, Documents de travail du Centre d’Economie de la Sorbonne, Universit´e Panth´eon-Sorbonne (Paris 1), Centre d’Economie de la Sorbonne.
Saillard, A. and Url, T., 2011. Measuring complementarity in financial systems, forthcoming Liang KY and Zeger S. 1986. Longitudinal Data Analysis Using Generalized Linear Models, 1986. Biometrika, Vol. 73, No. 1 (Apr., 1986), pp. 13-22
Wooldridge, JM. Econometric Analysis of Cross Section and Panel Data. Cambridge, MA: MIT Press, 2002.
Ravn, Morten and Uhlig, Harald, 2002. On adjusting the Hodrick - Prescott filter for the frequency of observations. The Review of Economics and Statistics 84
Pitlik, H., 2011 When do Economic Crises Trigger Economic Policy Liberalization? Forth-coming
Song F , Thakor A., Banks and capital markets as a coevolving financial system, VoxEU.org, December 1, 2010
Levine, R., Bank-Based or Market-Based Financial Systems: Which is Better? (February 2002). William Davidson Institute Working Paper No. 442.
Lin, Justin Yifu, Sun, Xifang and Jiang, Ye, 2009. Toward a theory of optimal financial structure,Policy Research Working Paper Series 5038, The World Bank.
A
Description and sources of data
Liberalization, Source: Abiad, Detragiache, Tressel (2008) Financial Reform Index see Abiad, Detragiache, Tressel (2008) for details.
Security Markets Different policies governments use to either restrict or encourage develop-ment of securities market.
International capital flows Restrictions on international financial transactions.
Entry barriers/pro-competition measures Government restrictions of new domestic banks into the financial system.
Interest rate controls All the government actions operated to control both lending and de-posit rates.
Banking Supervision Degree of government intervention in the banking sector. Privatization Share of banking sector assets controlled by state-owned banks.
Directed credit/reserve requirements Requirement of bank lending to certain priority sec-tors and reserve requirements.
Macroeconomic variables
Complementarity Index See Section 2 for the methodology. Represents the complementarity view. Index already used in Saillard, Url 2011b
Competition Index Described above. Represents the banks vs market view: Index already computed and used Saillard and Url (2011b)
Gvt Consumption Government Consumption Share of PPP Converted GDP Per Capita at 2005 constant prices Source: Penn World Table
Openness Openness at Current Price, Source: Penn World Table
Inflation Measured by the consumer price index reflects the annual percentage change in the cost to the average consumer of acquiring a basket of goods and services that may be fixed or changed at specified intervals, such as yearly. World Bank Indicators
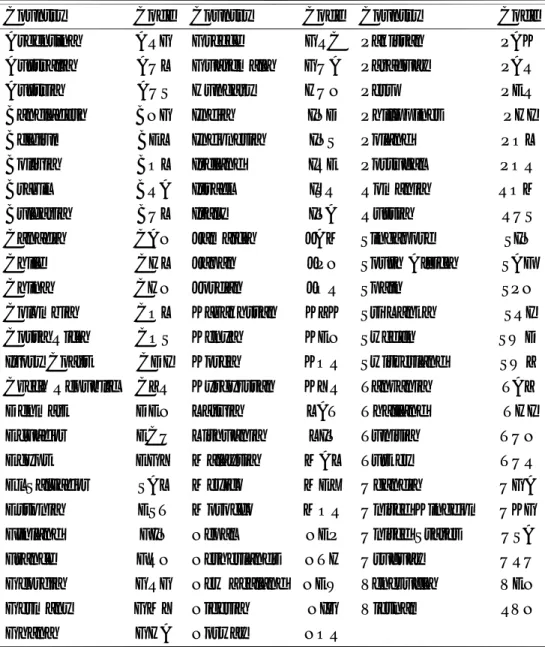
Table 6: Country Codes
Country Code Country Code Country Code
Argentina ARG Greece GRC Pakistan PAK
Australia AUL Guatemala GUA Paraguay PAR
Austria AUS Hungary HUN Peru PER
Bangladesh BNG India IND Philippines PHI
Belgium BEL Indonesia INS Poland POL
Bolivia BOL Ireland IRE Portugal POR
Brazil BRA Israel ISR Romania ROM
Bulgaria BUL Italy ITA Russia RUS
Canada CAN Jamaica JAM Singapore SIN
Chile CHL Japan JPN South Africa SAF
China CHN Jordan JOR Spain SPN
Colombia COL Kazakhstan KZK Sri Lanka SRI
Costa Rica COS Kenya KEN Sweden SWD
Ivory Coast CDI Korea KOR Switzerland SWZ
Czech Republic CZR Kyrgyzstan KYR Tanzania TAZ
Denmark DEN Latvia LAT Thailand THI
Ecuador ECU Lithuania LIT Tunisia TUN
Egypt EGY Malaysia MAL Turkey TUR
El Salvador SAL Mexico MEX Uganda UGA
Estonia EST Morocco MOR United Kingdom UKG
Finland FIN Nepal NEP United States USA
France FRN Netherlands NTH Uruguay URU
Georgia GRG New Zealand NEW Venezuela VEN
Germany GMY Nigeria NIG Vietnam RVN