INFORMAL EMPLOYMENT IN TURKEY:
AN OVERVIEW
Mélika BEN SALEM
*, Isabelle BENSIDOUN
**,
Selin PELEK
***Abstract - The Turkish labour market, like that of many developing economies, is characterised by widespread recourse to informal jobs. Sever-al measures have recently been taken by the Turkish authorities to limit the extent of this tendency. These are in keeping with the dynamic process of accession to the EU to which Turkey has been committed since the opening of negotiations in October 2005. From Household Labour Force surveys conducted by the Turkish Statistical Institute, the study presented here de-picts a panorama of informal employment in Turkey before the implementa-tion of these measures. It responds to the need expressed by the Council of the European Union to have an analysis of undeclared work. From a de-scriptive analysis of the main features of informal jobs and from the estima-tion of the probability of informal employment, it brings out a number of lessons on how to target policies to combat informal employment in Turkey and on the people who encounter the greatest difficulties in accessing or participating in the market.
Keywords: LABOUR MARKET, TURKEY, INFORMAL EMPLOYMENT.
JEL Classification: J21, J42.
Our thanks go to Richard Duhautois for his suggestions regarding the econometric section, to Marie Ruault and Aude Sztulman for their attentive reading of the text and to the two referees, who made it possible to improve the initial version of this article.
*
Centre d’études de l’emploi & Paris School of Economics, melika.bensalem@cee-recherche.fr
**Centre d’études de l’emploi, isabelle.bensidoun@cee-recherche.fr ***
INTRODUCTION
The Turkish labour market, like that of many developing economies, is characterised by widespread recourse to informal jobs. Several measures have been taken recently by the Turkish authorities to limit the extent of this tenden-cy. The priority of the plan to combat informal employment (KADIM), carried out under the responsibility of the Ministry of Labour and Social Security, was to deal with the informal employment of illegal foreign workers (Tekinarslan, 2007). More recently, a broader programme, aimed at reducing the informal economy, has been launched under the aegis of the Revenue Administration. With a duration of three years (2008-2010), this programme had as its main aim, through the encouragement of organisational and societal consensus re-garding the benefits of greater formalisation, to promote formal activities, to strengthen audit capacity and to make sanctions more dissuasive (Revenue Ad-ministration, 2009). This decision on the part of the government to combat in-formal employment is in keeping with the dynamics of the process of accession to the Union in which Turkey has been engaged since the opening of negotia-tions in October 2005. The examination of Chapter 19 (social policy and em-ployment) by the European Commission in fact points out each year the need for Turkey to fight against informal employment so as to align its labour market on that of the EU countries (Commission of the European Communities, 2005 to 2009). The present study depicts a panorama of informal employment in Tur-key prior to the implementation of these arrangements and accordingly responds to the need expressed by the EU Council to have at its disposal an analysis of undeclared work (OJ L 051, 2008). The study is based mainly on labour force surveys by the Turkish Statistical Institute (TUIK). These surveys make it pos-sible to identify the main characteristics of, and evolutions in, informal em-ployment over a recent period (2000-2006).
Following a reminder of ways in which the informal element in the econ-omy can be statistically apprehended (section 1), this overview of informal em-ployment in Turkey will be presented in two stages. The first stage will be de-voted to a descriptive analysis of the principal characteristics of these jobs, from both an individual and a professional standpoint (section 2.1). The second stage will use econometric methods to estimate the factors influencing the probability of having an informal job (section 2.2). The main aim of this exercise will be to examine, everything else remaining equal, the results obtained in the previous sub-section.
1. HOW CAN THE INFORMAL PHENOMENON BE STATISTICALLY APPREHENDED?
The informal element in employment is still being described in recent publications as a phenomenon that is difficult to apprehend. This is exemplified by the OECD’s "Employment Outlook for 2008, in which chapter 21
opens with a discussion under the heading "Informal employment is difficult to define and measure".
1
And yet, labour statisticians have been striving since the 1970s to trace out the boundaries of the sector. These efforts, launched following the reports by K. Hart (1973) on the urban sector in Ghana and by the International Labour Organisation's "employment" mission to Kenya (1972), led to the adoption in 1993 by the 15th International Conference of Labour Statisticians (ICLS) of a resolution concerning labour statistics in the informal sector. An international definition of the informal sector was at that time approved based on the
charac-teristics of the economic unit, the objective being to identify, within the system
of national accounts, those production units that constitute individual enterpris-es in the household institutional sector2. The informal sector then comprises:
• informal enterprises of own-account workers, who may themselves em-ploy family workers collaborating in the family enterprise and occasional work-ers: depending on the country, all own-account enterprises may be included or only those that are not registered in conformity with national legislation (tax laws, social security, professional associations or other laws and regulations);
• the enterprises of informal employers who may employ one or more workers on a permanent basis and who meet one or more of the following crite-ria3: (i) number of workers below a certain level (according to the minima pre-scribed by national legislation or statistical practices: set at 5 by the United Na-tions Statistical Commission's Delhi Group in 1999), (ii) non-registration of the enterprise, (iii) non-registration of its workers.
This definition makes it possible to distinguish several categories of em-ployment4 in the informal sector: own-account workers, employers and employ-ees whose behaviour, role or determinants can differ substantially. It neverthe-less leaves out those persons who are employed outside the informal sector in precarious conditions and who fall outside the scope of labour legislation (secu-rity of employment, job secu(secu-rity and social secu(secu-rity).
Accordingly, following suggestions made in 2001 by the Delhi Group5, directives relating to a statistical definition of informal employment were ap-proved in 2003 at the 17th ICLS. In addition to employment in the informal sector6, as defined 10 years earlier, there was now added informal employment outside the informal sector, within firms and within households. Informal em-ployment is now defined by the characteristics of the job, independently of the
2
Their legal status and the type of accounts kept by individual enterprises are what distinguishes them from firms and quasi-firms: they are not separate entities independent of the household that owns them and they do not keep full accounts enabling them to distinguish the production activities of the enterprise from those of the owner.
3
The informal character of the enterprises can be defined in two ways: either through their non-conformity with the legal and administrative framework or through their type of organisation. Failing agreement at the 15th ICLS on the most appropriate approach, both criteria (registration and/or size of enterprise) have been maintained.
4
The population working in the informal sector comprises all those who, during a given reference period, had a job in at least one unit of the informal sector.
5
A group of international experts on the statistics of the informal sector set up in 1997 by the Indian government at the request of the 15th ICLS.
6
The wage-earners having a formal job in an enterprise in the informal sector are excluded from the informal employment. This situation is observed only marginally, however.
characteristics of the entity in which the work is carried out: a job that is not subject, de jure or de facto7, to the labour legislation or to the social insurance
system as a result of its non-declaration, its occasional nature or the brevity of the period in which it is occupied.
This means that the two concepts differ regarding the observation unit concerned: production units in the case of employment in the informal sector and jobs in the case of informal employment. These two complementary con-cepts make it possible to apprehend the different forms taken by "informalisa-tion".
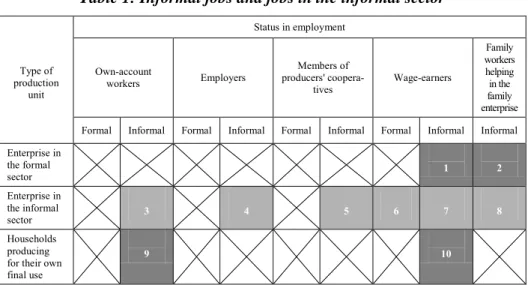
Table 1 presented in the annex to the directives concerning a statistical definition of informal employment approved by the 17th ICLS summarises, in these two dimensions, the different employment situations.
Table 1: Informal jobs and jobs in the informal sector
Type of production unit Status in employment Own-account workers Employers Members of producers' coopera-tives Wage-earners Family workers helping in the family enterprise Formal Informal Formal Informal Formal Informal Formal Informal Informal Enterprise in the formal sector 1 2 Enterprise in the informal sector 3 4 5 6 7 8 Households producing for their own final use
9 10
Key: the white cells indicate formal jobs, the grey cells informal jobs; those in the in-formal sector (light grey, with the exception of cell 6) and those outside the inin-formal sector (dark grey); cells marked with a cross indicate impossibility.
Notes: for the independent workers (first 3 categories), the informal character of the job is linked to the characteristics of the production unit (enterprise or cooperative). Own-account workers producing for the household's own final use (cell 9) are considered to be in employment if their production represents a substantial share of the household's total consumption. Cell 10 refers to households that employ remunerated domestic workers in an informal manner.
Source: taken from, with adaptations, the annex to the Directives concerning a statisti-cal definition of informal employment, approved by the 17th ICLS (2003).
7
Possibility of a difference between the formal character of the job and its reality. Certain workers may in theory be protected by the labour legislation or covered by the social security system but have not in practice been able to exercise their rights as a result of the failure of the institutions to apply the existing legislation.
2. WHO ARE THE INFORMAL WORKERS IN TURKEY?
The descriptive statistics that are about to be presented permit a first idea of the characteristics of informal workers in Turkey and of the evolutions that took place in this segment of the labour market between 2000 and 2006. The data emanate from the labour force surveys carried out by the Turkish Statistical Institute. The concept of informal employment used here is based on the charac-teristics of the jobs, in conformity with the definition proposed by the ILO in 2003. These jobs were able to be identified using the criterion of non-affiliation to the social security system.
2.1. A first approach: descriptive analysis
In 2006, 10.8 million Turkish workers out of a total of 22.3 million were occupying an informal job. The extent of these jobs has declined slightly since 2000, with their share of total employment falling from 51% to 48% (Graph 1).
Graph 1: Changes in the share of informal employment in total employment, whole economy and non-farm
Source: authors’ calculations based on Turkish Statistical Institute, household labour force survey results.
However, this decline is linked more to a sectoral evolution than to a decline in the phenomenon of "informality". The share of agriculture in employment, which was still as high as almost 50% at the end of 1980s, was no more than
0 10 20 30 40 50 60 %
Share of informal employment in total employment
Share of informal employment in non-farm employment
Farm sector
36% in 2000 and then went on to fall by almost a further 10 percentage points to 27% in 2006. Ninety per cent of agricultural employment is in fact informal. If agriculture is excluded, it turns out that there was, on the contrary, a substan-tial increase in informal jobs, with their share of employment, which had oscil-lated around 25% in the 1990s, reaching almost 35% in 2006. As a result, Tur-key, like many developing countries, has been faced in recent years with a rise in informal employment. The scale of the phenomenon is nevertheless more limited in Turkey than elsewhere. In India or in certain African countries, the share of informal non-farm employment is more of the order of 80%, while in Latin America it is 50 to 60%8.
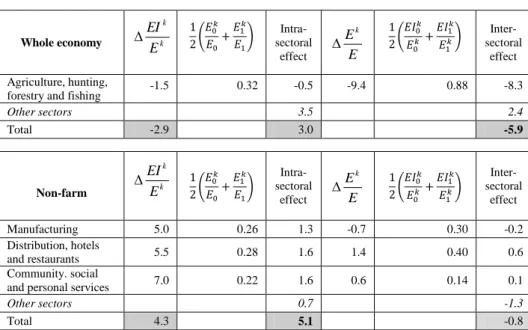
The origins of the variation in the two shares taken by informal employ-ment (whole economy and non-farm) in the Turkish case can be analysed by breaking them down into an intra-sectoral component and an inter-sectoral component. This makes it possible to determine whether these evolutions are linked to a variation in the intensity of the informal element within these sectors (the intra-sectoral effect) or to a shift in the structure of employment towards sectors with greater or smaller informality ratios (the inter-sectoral effect). Ta-ble 2 shows the result of this breakdown as follows:
kk kk k k k k k k k E EI E EI E E E E E E E EI E EI 1 1 0 0 1 1 0 0 2 1 * 2 1 * where :EI denotes the informal employment, E total employment,
k the sector,
Δ the variation between 0 and 1.
This breakdown shows that the decline in the ratio of informal to total employment does indeed result from an inter-sectoral effect related to the de-cline in the relative importance of agriculture in employment, a sector that has a particularly high informal employment ratio. On the other hand, in the case of the rise in the share of informal employment in non-farm employment, it is the intra-sectoral effect that predominates: the share of informal employment rose within the various sectors, especially those of "distribution, hotels and restau-rants", "community, social and personal services" and manufacturing, which account respectively for 28%, 22% and 26% of total employment.
8
OECD (2009).
Table 2: Breakdown of the change between 2000 and 2006 in the ratio of informal employment to total employment
Whole economy k k E EI ( ) sectoral Intra-effect E Ek ( ) sectoral Inter-effect Agriculture, hunting,
forestry and fishing -1.5 0.32 -0.5 -9.4 0.88 -8.3
Other sectors 3.5 2.4 Total -2.9 3.0 -5.9 Non-farm k k E EI ( ) Intra-sectoral effect E Ek ( ) Inter-sectoral effect Manufacturing 5.0 0.26 1.3 -0.7 0.30 -0.2 Distribution, hotels and restaurants 5.5 0.28 1.6 1.4 0.40 0.6 Community. social
and personal services 7.0 0.22 1.6 0.6 0.14 0.1
Other sectors 0.7 -1.3
Total 4.3 5.1 -0.8
Source: authors’ calculations based on Turkish Statistical Institute, household labour force survey results.
2.1.1. Informal employment: less and less dominated by agriculture
The decline in the relative importance of agriculture is reflected also in a modification in the sectoral structure of informal jobs (Table 3). Whereas in 2000 63% of the informal jobs were to be found in agriculture, in 2006 the per-centage was no more than 49%, meaning that most informal jobs were now in the non-farm sector. The structure in the case of formal jobs is less concentrated and shows little variation over time, with roughly one-quarter of jobs in the manufacturing sector, one-quarter in "distribution, hotels and restaurants" and a further quarter in "community, social and personal services".
If agriculture is now excluded, the ranking of the sectors is obviously left unchanged, but the relationship within these structures between formal and in-formal employment is modified as a result of the difference in the share of agri-culture in the two types of employment. Construction, "distribution, hotels and restaurants" and "transport and communications" account for a relatively larger share of informal employment. Agriculture and these three sectors are the more informal-intensive, in the sense that they are the ones that employ the largest proportions of informal workers: roughly 90% in agriculture, over 60% in con-struction, more than 60% in distribution, hotels and restaurants and 40% at the end of the period in transport (Graph 2). On the other hand, "electricity, gas and water supply", mining and quarrying and "community, social and personal ser-vices" have higher proportions of formal jobs.
Graph 2: Shares of informal employment by sector
Table 3: Sectoral structure of employment (%) Employment Sector Informal 2000 Formal 2000 Informal 2006 Formal 2006 Agriculture, hunting, forestry and fishing 63 8 49 7
Mining and quarrying 0 1 0 1
Manufacturing industry 9 25 12 25 Electricity, gas & water supply 0 1 0 1
Construction 8 4 7 4
Distribution, hotels and restaurants 13 23 19 23 Transport and communication 3 7 4 6 Financial and real estate activities 1 6 2 7 Community, social & personal service
activi-ties 3 25 6 26
Note: figures in bold type indicate sectors that are important for informal employment in relation to formal employment once agriculture is excluded.
Source: authors ‘calculations based on Turkish Statistical Institute, household labour force surveys results.
0 10 20 30 40 50 60 70 80 90 100 2000 2001 2002 2003 2004 2005 2006 %
Agriculture, hunting and fishing
Construction
Distribution, hotels and restaurants
Transport and communication
Manufacturing industry
Financial and real estate activities Community, social and personal services
Mining and quarrying Electricity, gas and water supply
2.1.2. Informal employment: a matter of size
Informal employment, outside agriculture, is seen mainly (more than 80%) in small-sized firms (less than 10 workers), whereas formal employment is mainly distributed between small-sized firms and firms with more than 50 workers (Graph 3-A).
Graph 3-A: Structure of formal and informal employment by size of firm
Graph 3-B: Share of informal employment by size of firm
Source: authors’ calculations based on Turkish Statistical Institute, household labour force survey results.
83 39 81 35 11 16 8 11 10 6 16 4 34 5 39 0 10 20 30 40 50 60 70 80 90 100
Informal_2000 Formal_2000 Informal_2006 Formal_2006
%
non-farm
Fewer than 10 workers From 10 to 24 workers
From 25 to 49 workers Over 50 workers
0 10 20 30 40 50 60 2000 2001 2002 2003 2004 2005 2006 % non-farm
Fewer than 10 workers
From 10 to 24 workers
From 25 to 49 workers
Over 10 workers Over 50 workers
Informal employment can, as was shown in the previous section, take place in the informal sector and/or in the formal sector. The Turkish "Employment" survey does not make it possible, for lack of precise indications regarding the characteris-tics of firms, to identify these two components as defined by the ILO. However, information regarding the size of firms makes it possible to approximate the concept of "formal sector" and to estimate a lower limit to informal employment in the sector, by taking workers who are not affiliated to the social security sys-tem and whose work takes place in firms with more than 10 workers (Table 4). As defined in this way, informal employment in the formal sector (excluding agriculture) accounted in 2000 for 17% of total informal employment and 10% of employment in the formal sector (Graph 3-B). These shares rose between 2000 and 2006 by 2 percentage points in the first case and almost 3 percentage points in the second.
Table 4: Approximation of informal employment in the formal sector based on employment in firms with more than 10 workers
Firms with < 10 workers Firms with > 10 workers Informal sector (IS) Formal sector (FS) Formal sector (FS) Affiliation to the
social security system
Former
employment (FE) FEIS FEFS FEFS
Non-affiliation to the social security system
Informal
employment (IE) IEIS IEFS IEFS
Total
employment (E) EIS EFS EFS
Note: what we have here is an estimate of the lower limit of informal employment in the formal sector (grey cell, IEFS) as informal workers employed in firms with fewer than 10 workers will be counted in the informal sector (IEIS) if the firm has the chara-cteristics used in the definition laid down by the International Conference of Labour Statisticians (ICLS) in 1993; if not, in the formal sector (IEFS).
Source: authors.
2.1.3. Informal employment outside agriculture: a matter of wage-earning The breakdown of employment by status-in-employment category shows that, all sectors taken together, wage-earners account for a small share (around 35%) of informal employment, but this breakdown is related to the specific features of the agricultural sector (relatively large number of unpaid female jobs). Outside agriculture, informal workers are in Turkey mainly wage-earners (as to almost two-thirds) and increasingly in the recent past are regular wage-earners (43% of informal employment (Graph 4-A)). Given that the bulk of agricultural jobs are informal, the distributions of formal total and non-farm employment show greater similarity. Wage-earners constitute the predominant employment category, accounting for almost 80% of formal employment in 2006.
Graph 4-A: Structure of formal and informal employment by status-in-employment category
Graph4-B: Share of informal employment by status-in-employment category
Source: authors’ calculations based on Turkish Statistical Institute, household labour force survey results.
31 72 43 78 33 4 20 1 24 13 25 12 0 10 20 30 40 50 60 70 80 90 100
Informal_2000 Formal_2000 Informal_2006 Formal_2006
%
non-farm
Regular wage-earners Casual wage-earners Employers Own-account workers Unpaid family workers
0 10 20 30 40 50 60 70 80 90 100 2000 2001 2002 2003 2004 2005 2006 % non-farm Total wage-earners Employers Regular wage-earners
Total independant workers Own-acount workers
Casual wage-earners
Certain categories are mainly to be found in informal employment. This is the case of unpaid family workers and casual workers, for which the shares of informal employment amount to 80% and 90% respectively (Graph 4-B). For own-account workers, the share is also relatively high, with more than 50% having an informal job. Even so, it is not possible, as is sometimes the case, to associate the status of independent worker with that of informal worker, at least not in Turkey. The least "informality-intensive" categories are those of wage-earners (30%) and employers (25%).
The breakdown by status category of informal non-farm employment is highly differentiated by age. For young people, wage-earning predominates (almost 80% of the informal non-farm jobs for the 12-24 age group in 2006, mainly in the form of regularly paid jobs), whereas the share of independent employment increases with age: 41% of the informal workers aged more than 50 work on their own account, compared with 28% for the 25-49 age group and 7% for the 12-24 age group. This phenomenon is also to be found in the case of formal jobs and is not specific to Turkey. It accordingly reflects more the exist-ence of financial barriers to entry into independent jobs than any specific char-acteristics of informal jobs.
2.1.4. Youths and the oldest workers are those most concerned by informal employment
Graph 5-B, giving the age breakdown of informal non-farm employment, shows that it is the extreme age groups that are the most concerned. In 2006, 54% of youth employment and 50% of the employment of the oldest workers was informal. It was in fact in the over-50 age group that a spectacular (18-point) rise in informal employment was to be seen between 2000 and 2006, accounting for almost one-third of the total variation. The age structures of for-mal and inforfor-mal employment accordingly differ substantially, with a larger proportion of the 25-49 age group in formal employment, more youths in in-formal employment and, in 2006, almost twice as many older workers in infor-mal employment as in forinfor-mal employment (Graph 5-A). In total, the average age is lower in informal employment (by four years in 2000) but this has been increasingly less true over time (down to no more than one year in 2006).
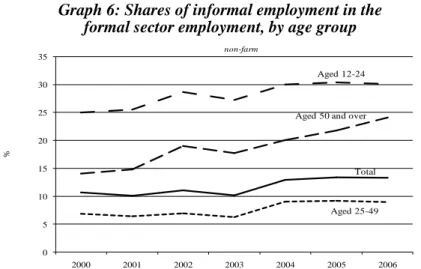
These differences in the importance of informal employment for different age groups is to be found also in the case of the formal sector, but to a smaller extent: in 2006, 30% of the employment of youths in the formal non-farm sector was informal and 24% of the employment of the over-50s, compared with only 9% for the 25-49 age group (Graph 6). The over-50s were also the age group showing the largest increase between 2000 and 2006: in 2000, only 14% of the employment of older workers in the formal sector was informal. As a result, whereas the overall rise in the share of informal employment in the formal sec-tor was only moderate, the deterioration has been more marked in the case of the older workers.
Graph 5-A: Age structure of informal and formal employment, 2000 and 2006
Graph 5-B: Shares of informal employment in employment by age group
Source: authors’ calculations based on Turkish Statistical Institute, household labour force survey results.
37 15 28 12 54 77 60 81 9 8 13 7 0 20 40 60 80 100
Informal_2000 Formal_2000 Informal_2006 Formal_2006
%
non-farm
Aged 12-24 Aged 25-49 Aged 50 and over
20 25 30 35 40 45 50 55 60 2000 2001 2002 2003 2004 2005 2006 % non-farm Aged 12-24
Aged 50 and over
Aged 25-49 Total
Graph 6: Shares of informal employment in the formal sector employment, by age group
Source: authors’ calculations based on Turkish Statistical Institute, household labour force survey results.
Clearly, over this period it was informal employment that enabled em-ployment of older workers to progress, with formal emem-ployment, for its part, posting a drop of 9% (Table 5). Within this informal employment, that in the formal sector constituted the most dynamic component, with its growth reach-ing 123% between 2000 and 2006 and contributreach-ing six percentage points to the 24% growth in the employment of the over-50s.
Table 5: Employment growth between 2000 and 2006, by age group
Non-farm %
12-24 age group 25-49 age group Aged 50 and over Total Growth rate Contrib. to growth Growth rate Contrib. to growth Growth rate Contrib. to growth Growth rate Contrib. to growth Informal employment 0.6 0.3 46.6 10.7 93.7 10.7 33.4 10.0 Of which, in the formal sector 24.8 2.6 64.4 2.3 123.1 5.6 51.2 2.6 Formal employment -13.0 -6.5 16.1 12.4 -8.7 -5.9 9.7 6.8 Total employment -6.2 -6.2 23.1 23.1 24.2 24.2 16.9 16.9 Source: authors’ calculations based on Turkish Statistical Institute, household labour force survey results.
2.1.5. What role did the retirement pension system play in the growth of informal employment of the over-50s?
It is possible that the importance of informal employment in the case of the over-50s was not unrelated to the incentives offered by the retirement pen-sion system to cease activity, or at least declared activity, at a fairly early age.
0 5 10 15 20 25 30 35 2000 2001 2002 2003 2004 2005 2006 % Total Aged 50 and over
Aged 25-49 Aged 12-24 non-farm
Although the legal retirement age went to 58 for women and 60 for men as part of the 1999 reform, the transition periods are so long that retirement at an earlier age still remains possible: after 5000 days' (15 years') contribution and 25 years' registration in the case of men and 20 years in the case of women. On average, the retirement age comes out at 50-53 years (Math, 2007). Early retirement is also encouraged by the receipt of an end-of-contract indemnity equal to one month's salary per year of service.
According to the OECD (2006), these provisions in the retirement pension system give workers an incentive to cease their formal activity in order to take advantage of the retirement benefits (indemnity + pension) and to continue their professional activity without being declared, especially as they benefit from health insurance without having to contribute out of their pensions. The World Bank (2010) also stresses, in its report on informality in Turkey, that the way the retirement pension system is structured, and especially the possibilities it gives for early retirement, plays a significant role in the importance of informal employ-ment in the case of older workers.
In order to estimate the number of retired people working informally, the OECD has calculated the difference between the number of retired men and the number of those who, at the time of the labour force survey, said that they were retired in response to the question "why are you not looking for a job?". The World Bank proposes a more refined calculation, taking the view that this differ-ence represents the number of active retired people and not the number working in the informal sector9. This being so, the difference has to be reduced by the number of retired people who are unemployed and the number of retired people occupying a formal job. In order to estimate the number of retired people who were unemployed, the overall non-farm unemployment rate is applied to the number of active retired people. The figure for the number of retired people in formal employment comes from the social security Institution (SGK).
In order to examine the importance of retired people as a proportion of older informal workers, we carried out this calculation for the years 2002 to 2006, taking the totality of the over-50s. However, instead of using the overall non-farm unemployment rate, we took the unemployment rate for the over-50s, which is a more relevant indicator to estimate the number of unemployed retired people. For the number of retired people over 50 in formal employment, we used data provided by the SGK covering all retired people (regardless of age) to calculate, for each year, a ratio for the retired people in formal employment (formality ratio in Table 6), comparing the number of retired people in formal employment with the number of retired people in employment10. This ratio was then applied to the number of over-50 retired people in employment11.
9
The World Bank made its estimate for July 2008 and for the retired group as a whole; the OECD's estimate was for the year 2005 and for men in the 50-59 age group.
10
The number of retired people in employment = the number of active retired people (regardless of their age) × (1- the unemployment rate for the over-40s). In the interests of consistency, given that the number of active retired people also includes some aged under 50, the unemployment rate
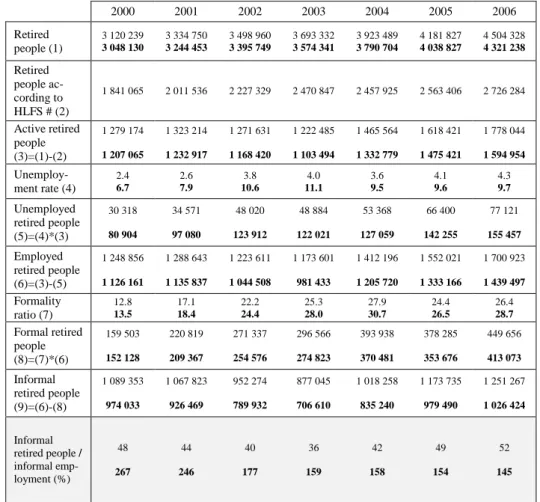
Table 6: Estimation of the number of retired people aged over 50 having an informal job
2000 2001 2002 2003 2004 2005 2006 Retired people (1) 3 120 239 3 048 130 3 334 750 3 244 453 3 498 960 3 395 749 3 693 332 3 574 341 3 923 489 3 790 704 4 181 827 4 038 827 4 504 328 4 321 238 Retired people ac-cording to HLFS # (2) 1 841 065 2 011 536 2 227 329 2 470 847 2 457 925 2 563 406 2 726 284 Active retired people (3)=(1)-(2) 1 279 174 1 207 065 1 323 214 1 232 917 1 271 631 1 168 420 1 222 485 1 103 494 1 465 564 1 332 779 1 618 421 1 475 421 1 778 044 1 594 954 Unemploy-ment rate (4) 2.4 6.7 2.6 7.9 3.8 10.6 4.0 11.1 3.6 9.5 4.1 9.6 4.3 9.7 Unemployed retired people (5)=(4)*(3) 30 318 80 904 34 571 97 080 48 020 123 912 48 884 122 021 53 368 127 059 66 400 142 255 77 121 155 457 Employed retired people (6)=(3)-(5) 1 248 856 1 126 161 1 288 643 1 135 837 1 223 611 1 044 508 1 173 601 981 433 1 412 196 1 205 720 1 552 021 1 333 166 1 700 923 1 439 497 Formality ratio (7) 12.8 13.5 17.1 18.4 22.2 24.4 25.3 28.0 27.9 30.7 24.4 26.5 26.4 28.7 Formal retired people (8)=(7)*(6) 159 503 152 128 220 819 209 367 271 337 254 576 296 566 274 823 393 938 370 481 378 285 353 676 449 656 413 073 Informal retired people (9)=(6)-(8) 1 089 353 974 033 1 067 823 926 469 952 274 789 932 877 045 706 610 1 018 258 835 240 1 173 735 979 490 1 251 267 1 026 424 Informal retired people / informal emp-loyment (%) 48 267 44 246 40 177 36 159 42 158 49 154 52 145
Notes: when two figures are shown on the same line, the first corresponds to the whole economy, the second (in bold type) to the non-farm sector.
# Number of individuals who replied that they were retired in response to the question "why are you not looking for a job?" In the Household Labour Force Survey (HLFS). Source: authors’ calculations based on Turkish Statistical Institute, household labour force survey results.
for the over-40s was used to calculate the number of retired people in employment. The impact of this choice on the formality ratio, and hence on the share of informally-employed retired people in informal employment, is marginal: the unemployment rates for the 30s, 40s and over-50s give very similar results.
11
The calculation of a non-farm formality ratio necessitated an approximation of the number of retired people in formal employment outside agriculture, as this figure was not available. For this purpose, the number of retired people in formal employment for the whole of the economy supplied by the SGK was adjusted by the ratio of the number of retired people outside agriculture to the number of retired people in the economy as a whole.
According to this calculation, between 870 000 and 1 250 000 retired people aged over 50, depending on the year, occupied an informal job (Table 6). If these figures are compared with the number of informal workers of the same age, one obtains ratios within the range from 36% to 52%. Remembering that farm workers account for a very small proportion of retired people (since most of them had always worked informally), if one now calculates this ratio exclud-ing agriculture12, the figure is well over 100 %, meaning that retired people aged over 50 occupying an informal job are more numerous than the over-50s in informal employment13!
Accordingly, the notion put forward by the international organisations (OECD and World Bank), according to which the pursuit of a professional ac-tivity by retired workers contributes to the scale of informal employment among older workers in Turkey, cannot be validated on the basis of the method they propose. This method arrives at an estimate of the number of retired people aged over 50 occupying an informal job (excluding agriculture) that is not com-patible with the number of informal non-farm jobs occupied by the over-50s14. As a consequence, this explanation cannot be called on to understand the changes seen between 2000 and 2006 in the informal employment of older workers. Given that these changes took place over a period subsequent to the 2001 financial crisis, it is possible to imagine that older individuals may have been forced to resume an activity and that such an activity, given the pressures existing on the labour market, could only be in the informal sector. The evolu-tion in the breakdown of the over-50 populaevolu-tion into individuals in employment (formal and informal), unemployed and inactive shows that the participation rate (active workers/population) barely changed over the period, meaning that the over-50s were no more active in 2006 than in 2000 (Table 7). On the other hand, their employment rate (employment/population) could be maintained at an almost unchanged level only through a rise in the rate of informal employ-ment. This rate in fact increased by 2.2 percentage points over the period, whereas the rate of formal employment fell by 2.9 points.
12
After excluding farm workers from the calculation of the number of retired people but not from the number responding in the employment survey that they were in retirement, for lack of being able to distinguish them. This leads to an underestimation of the number of active retired people and, as a result, everything else remaining equal, to an underestimation of the share of informally-employed retired people in informal employment.
13
In order to identify the extent to which the "formality ratio" excluding agriculture used here was liable to lead to inconsistent results, we recalculated this ratio using as the "formality ratio" the share of formal employment in employment of the over-50s excluding agriculture, in other words to a "formality ratio" for workers but not for retired people. As the result was substantially higher, it led to a much lower number of informally-employed retired people but did not, even so, eliminate the inconsistency, as the share of over-50 retired people working in the informal sector in the total informal employment of the over-50s excluding agriculture remained close to 100 %.
14
The OECD, by relating the number of retired men aged 50-59 in an informal job to the number of working retired men of the same age obtained a ratio that might seem acceptable. Similarly, the absolute figure of 2 million retired people in informal employment put forward by the World Bank could also seem reasonable.
Table 7: Participation rate and employment rate for the over-50s (%)
Non-farm Formal
employment
Informal
employment Employment Participation
2000 9.7 4.6 14.4 15.4
2006 6.8 6.9 13.7 15.2
Change 2000-2006 -2.9 2.2 -0.7 -0.2
Source: authors' calculations based on Turkish Statistical Institute, household labour force survey results.
2.1.6. Education limits the prevalence of informal employment among youths For the other category of the population particularly affected by informal employment, namely youths, the level of education exerts an important influ-ence on the prevalinflu-ence of informal employment.
Graph 7: Breakdown of the labour force aged 12-24 between formal employment, informal employment and unemployment in 2000 and 2006
non-farm
Source: authors’ calculations based on Turkish Statistical Institute, household labour force survey results.
In Graph 7, which shows the breakdown of the labour force in the 12-24 age group between formal employment, informal employment and
unemploy-13 32 38 50 66 40 70 53 44 26 6 41 17 14 18 24 29 19 7 32 26 43 60 35 69 47 54 31 12 41 23 20 20 26 28 23 0 100 200
No diploma Primary Lower secondary Higher secondary
Tertiary Total
Formal employment Informal employment Unemployment 100
ment (excluding agriculture) it turns out in fact that the share of informal em-ployment declines as the level of education rises15 (almost 70 % in 2000 for those without diploma, as against only 6% for those with tertiary education), whereas the unemployment rate is particularly high for those with the highest qualifications (24% in 2000 in the case of those who graduated from higher secondary school and 29% for those with a university diploma).
Between 2000 and 2006, taking all levels of education together, the share of formal employment of the 12-24 age group in the labour force fell by five percentage points, while the unemployment rate rose from 19% to 23%.16. The increase in the unemployment rate is to be found mainly at the lower levels of education (no diploma and primary school17), so that a certain convergence is to be observed between the unemployment rates at different levels of education. For levels of education from lower secondary school on, it is between formal and informal employment that evolutions are seen to take place, with the share of informal jobs rising at the expense of that of formal jobs. In the end, in 2006 the youths labour force was more evenly distributed between informal employ-ment and unemployemploy-ment, regardless of the level of education, with the excep-tion of young primary-school leavers, for whom the share of formal employ-ment remained unchanged (with formal employemploy-ment falling as much for this category as for the labour force as a result of the raising of the school-leaving age).
2.1.7. Informal non-farm employment is not a matter of gender
Whereas informal employment in a number of developing countries is characterised by a large female component, Turkey does not share this feature. Admittedly, the share of women is higher in informal employment (around 35%) than in formal employment, where women account for only 17% of the jobs (Graph 8-A). However, this feature is linked to female employment in ag-riculture, much of it in the form of unpaid family jobs. Excluding agag-riculture, the breakdown by gender of informal jobs is in fact very close to that of formal jobs, with the women's share particularly low, reflecting above all their very limited participation in the labour market. The same phenomenon is to be found in the share of formal employment by gender (Graph 8-B). While, taking all sectors together, 66% of the women and 42% of the men had an informal job in 2006; this difference disappears if agriculture is excluded, (with roughly 35% of the men and the women having an informal job).
15
It will be noted that in 2006 the share of informal employment was smaller for the young primary school leavers (47% of the labour force and 60% of the employment) than for the lower secondary school leavers (54% and 68% respectively).
16
Between 2000 and 2006, excluding agriculture, the labour force in the 12-24 age group declined by 0.9% and formal employment by 13%, while at the same time the number of unemployed was rising by 21.8% and informal employment by 0.6%.
17
For young primary school leavers, the rise in the unemployment rate between 2000 and 2006 stems from a decline in the number of unemployed (41%) that was smaller than the decline in the labour force (59 %).
Graph 8-A: Share of women in formal and informal employment
Whole economy (broken lines) and non-farm (solid line).
Graph 8-B: Share of informal employment in employment by gender
Whole economy (broken lines) and non-farm (solid line).
Source: authors’ calculations based on Turkish Statistical Institute, household labour force survey results.
2.2. A second approach: econometric analysis
In order to complement the analysis derived from descriptive statistics in a multi-dimensional framework, in this section the probability of occupying an informal job is modelled. This makes it possible to eliminate the composition effects present in the descriptive analysis and in so doing to isolate the effects of each individual or professional characteristic. The characteristics considered are those analysed in the previous section: the size of firm, the status-in-employment category and the sector of activity for the professional characteris-tics; the age, the level of education and the gender in the case of the individual characteristics, to which was added the marital status. The estimations were made excluding the agricultural sector, using cross-section data for each of the years between 2000 and 2006, since the Turkish surveys do not make it possible to monitor changes for individuals from one year to another. The probability is modelled using a logistic distribution function (the logit model) and the obser-vations were weighted with the weighting variable normalised in such a way that the mean was equal to unity (Leblanc, Lollivier, Marpsat, 2000) as follows:
where
p
i is the weighting of individual i and p*i the normalised weighting.
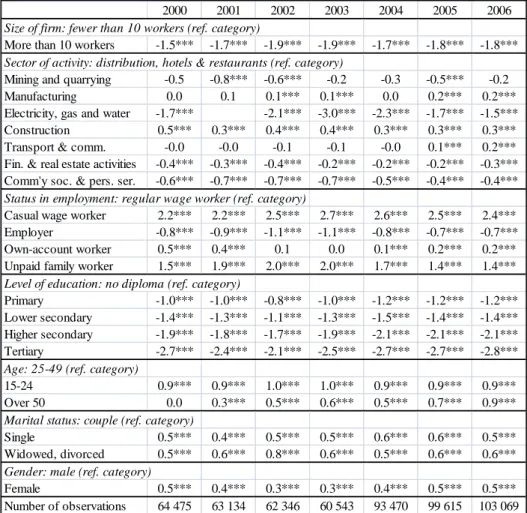
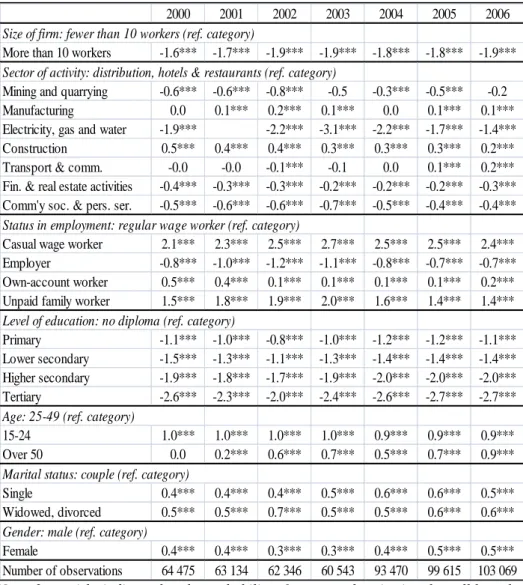
The results of these estimations (Table 8) show that most of the variables are significant at the 1% level and hence mainly confirm the lessons to be drawn from the descriptive analysis. For example, the probability of having an informal job is higher (lower) when one is working in a small firm (a large firm), in the construction sector ("electricity, gas and water supply"), when one is a casual worker or an unpaid family worker (employer), without diploma (higher education graduate), if one is not living in a couple and if one is a wom-an.However, these estimations made using large samples run the risk of providing over-optimistic results in terms of the significance of the variables. Accordingly, in order to examine whether they are resistant to this size effect, estimations were made on sub-samples of 5000 observations (roughly 5% of the initial sample) randomly drawn with replacement. The results are given in Table 9, which shows for each variable the coefficient derived from the unweighted initial sample18 and its level of significance at the 1% level, determined by
18
The re-sampling technique applied here does not make it possible to take into account the weighting of individuals. The results of the logistic regression on the whole of the sample in the absence of weighting are shown in an annex (Table A-1). The differences compared with the results shown in Table 8 are marginal: the sign and scale of the coefficients are most often identical. In only six cases does the unweighted estimation show significant effects that were not seen in the weighted estimation: in 2000 and 2004 for mining and quarrying, in 2001 for manufacturing, in 2002 for transport and communications and in 2002 and 2003 for own-account workers. Furthermore, differences between the coefficients shown in Table 9 and the average coefficients calculated on the sub-samples for each year are negligible, except in the case of “electricity, gas and water supply” where they reach around one percentage point (Table A-2).
* * * 1 1 1 1 , 1 N N i i i i i i i i i p p p p p p N N p
culating the standard deviation on the basis of all the sub-samples. It will be seen that most of the effects are robust to the sample size.
Table 8: Weighted logistic regression of the probability of having an informal job, excluding agriculture
Note: 3 asterisks indicate that the probability of erroneously rejecting the null hypothe-sis of non-significance is less than 1% (p-value below 1 %).
Source: authors’ calculations based on Turkish Statistical Institute, household labour force survey results.
The probability of being in informal employment is accordingly always greater the lower the level of education, the fact of being a woman, the fact of being single, being situated at the extremities of the age distribution, especially at end-period for older workers and the fact that one's status-in-employment category is precarious (casual worker or unpaid family worker). On the other hand, own-account workers do not, according to this estimation, have probabili-ties of being in informal employment that differ from those of regular wage-earners.
2000 2001 2002 2003 2004 2005 2006 More than 10 workers -1.5*** -1.7*** -1.9*** -1.9*** -1.7*** -1.8*** -1.8*** Mining and quarrying -0.5 -0.8*** -0.6*** -0.2 -0.3 -0.5*** -0.2 Manufacturing 0.0 0.1 0.1*** 0.1*** 0.0 0.2*** 0.2*** Electricity, gas and water -1.7*** -2.1*** -3.0*** -2.3*** -1.7*** -1.5*** Construction 0.5*** 0.3*** 0.4*** 0.4*** 0.3*** 0.3*** 0.3*** Transport & comm. -0.0 -0.0 -0.1 -0.1 -0.0 0.1*** 0.2*** Fin. & real estate activities -0.4*** -0.3*** -0.4*** -0.2*** -0.2*** -0.2*** -0.3*** Comm'y soc. & pers. ser. -0.6*** -0.7*** -0.7*** -0.7*** -0.5*** -0.4*** -0.4*** Casual wage worker 2.2*** 2.2*** 2.5*** 2.7*** 2.6*** 2.5*** 2.4*** Employer -0.8*** -0.9*** -1.1*** -1.1*** -0.8*** -0.7*** -0.7*** Own-account worker 0.5*** 0.4*** 0.1 0.0 0.1*** 0.2*** 0.2*** Unpaid family worker 1.5*** 1.9*** 2.0*** 2.0*** 1.7*** 1.4*** 1.4*** Primary -1.0*** -1.0*** -0.8*** -1.0*** -1.2*** -1.2*** -1.2*** Lower secondary -1.4*** -1.3*** -1.1*** -1.3*** -1.5*** -1.4*** -1.4*** Higher secondary -1.9*** -1.8*** -1.7*** -1.9*** -2.1*** -2.1*** -2.1*** Tertiary -2.7*** -2.4*** -2.1*** -2.5*** -2.7*** -2.7*** -2.8*** Age: 25-49 (ref. category)
15-24 0.9*** 0.9*** 1.0*** 1.0*** 0.9*** 0.9*** 0.9*** Over 50 0.0 0.3*** 0.5*** 0.6*** 0.5*** 0.7*** 0.9*** Single 0.5*** 0.4*** 0.5*** 0.5*** 0.6*** 0.6*** 0.5*** Widowed, divorced 0.5*** 0.6*** 0.8*** 0.6*** 0.5*** 0.6*** 0.6*** Female 0.5*** 0.4*** 0.3*** 0.3*** 0.4*** 0.5*** 0.5*** Number of observations 64 475 63 134 62 346 60 543 93 470 99 615 103 069 Size of firm: fewer than 10 workers (ref. category)
Sector of activity: distribution, hotels & restaurants (ref. category)
Status in employment: regular wage worker (ref. category)
Level of education: no diploma (ref. category)
Marital status: couple (ref. category)
Table 9: Logistic regression of the probability of occupying an informal job, outside agriculture, significance of the coefficients obtained by
re-sampling of 5000 individuals
Note: 3 asterisks indicate that the probability of erroneously rejecting the null hypothesis of non-significance is less than 1% (p-value below 1 %). This p-value is obtained from the standard deviation as follows:
2 1 1 1 1 , where N N i i i i N N
where i is the coefficient for each sub-sample, is its mean (Table A-2) and N is the number of
sub-samples indicated in the final line of the table. Initially set at 1000 for each year, the final number was in all cases smaller (between 199 in 2003 and 925 in 2001) because the calculation of the standard deviation can only be carried out on the basis of sub-samples for which it is pos-sible to estimate all the coefficients. Unfortunately, the electricity sector is characterised by hav-ing a relatively small number of individuals in employment and a highly unbalanced distribution between formal and informal jobs. As a result, the coefficient of this modality could not be esti-mated for all the sub-samples.
Source: authors’ calculations based on Turkish Statistical Institute, household labour force sur-vey results.
2000 2001 2002 2003 2004 2005 2006
More than 10 workers -1.6*** -1.7*** -1.9*** -1.9*** -1.8*** -1.8*** -1.9***
Mining and quarrying -0.6 -0.6 -0.8 -0.5 -0.3 -0.5 -0.2
Manufacturing 0.0 0.1 0.2 0.1 0.0 0.1 0.1
Electricity, gas and water -1.9*** -2.2*** -3.1*** -2.2*** -1.7*** -1.4
Construction 0.5*** 0.4 0.4 0.3 0.3 0.3 0.2
Transport & comm. -0.0 -0.0 -0.1 -0.1 0.0 0.1 0.2
Fin. & real estate activities -0.4 -0.3 -0.3 -0.2 -0.2 -0.2 -0.3 Comm'y soc. & pers. ser. -0.5*** -0.6*** -0.6*** -0.7*** -0.5*** -0.4*** -0.4*** Casual wage worker 2.1*** 2.3*** 2.5*** 2.7*** 2.5*** 2.5*** 2.4***
Employer -0.8*** -1.0*** -1.2*** -1.1*** -0.8*** -0.7*** -0.7***
Own-account worker 0.5*** 0.4*** 0.1 0.1 0.1 0.1 0.2
Unpaid family worker 1.5*** 1.8*** 1.9*** 2.0*** 1.6*** 1.4*** 1.4***
Primary -1.1*** -1.0*** -0.8*** -1.0*** -1.2*** -1.2*** -1.1***
Lower secondary -1.5*** -1.3*** -1.1*** -1.3*** -1.4*** -1.4*** -1.4*** Higher secondary -1.9*** -1.8*** -1.7*** -1.9*** -2.0*** -2.0*** -2.0***
Tertiary -2.6*** -2.3*** -2.0*** -2.4*** -2.6*** -2.7*** -2.7***
Age: 25-49 (ref. category)
15-24 1.0*** 1.0*** 1.0*** 1.0*** 0.9*** 0.9*** 0.9***
Over 50 0.0 0.2 0.6*** 0.7*** 0.5*** 0.7*** 0.9***
Single 0.4*** 0.4*** 0.4*** 0.5*** 0.6*** 0.6*** 0.5***
Widowed, divorced 0.5 0.5 0.7*** 0.5 0.5 0.6 0.6
Gender: male (ref. category)
Female 0.4*** 0.4*** 0.3*** 0.3*** 0.4*** 0.5*** 0.5***
Number of sub-samples 610 925 386 199 334 543 621
Size of firm: fewer than 10 workers (ref. category)
Sector of activity: distribution, hotels & restaurants (ref. category)
Status in employment: regular wage worker (ref. category)
Level of education: no diploma (ref. category)
This confirms that in Turkey the assimilation of the status-in-employment category of independent worker to that of informal worker is not applicable. However, it is above all the influence of the sector of activity whose estimation is modified. The probability of having an informal job is the same whatever the sector in which the activity is exercised, with the exception of electricity, gas and water supply and community, social and personal services, where this prob-ability remains very small.
CONCLUSION
This overview of the labour market provides a certain number of pointers regarding the method of targeting policies to fight against informal employment in Turkey and regarding the populations which encountered the greatest diffi-culty in acceding to, or participating in, the labour market.
In the first place, inasmuch as it is above all in small firms that informal employment is exercised, it is in these establishments that labour inspections, which are for the moment infrequent in Turkey (OECD, 2008 and Commission of the European Communities, 2009), should be stepped up. Second, the very sharp rise in the share of informal employment in the case of workers aged over 50 prompts one to reflect on the measures to be implemented in order once more to ensure this population more widespread access to formal jobs. As has been seen, the notion according to which informal employment is for these workers the result of a choice related to the incentives offered by the retirement pension system is not verifiable on the basis of the available data.
Lastly, for youths and women, leaving aside the question of informal working, there is that of the policies to be envisaged to enable them, for the former to accede to, and for the latter to participate in, the labour market. The 15-24 age group in fact suffer particularly high unemployment rates, now af-fecting also those with no diploma. The high prevalence of unemployment for the most educated group is not specific to Turkey. Numerous countries in the southern Mediterranean region are facing the same problem. Determining the extent to which this failing is due to a mismatch of types of training or to dis-crimination on the labour market is indispensable in order to ensure that the efforts made to augment human capital are profitable.
For women, the prevalence of informal employment, outside agriculture, is not greater than for men. Even so, the likelihood for a woman to have an in-formal job is greater, everything else remaining equal, showing the considerable difficulty women have in acceding to formal jobs or their greater appetite for informal jobs. These alternatives are at the heart of the debate on the raisons
d'être of informal jobs in developing countries. Ben Salem and Bensidoun
(2011) show that in Turkey informal employment results from a process of ex-clusion. The rationing that operates in the formal segment of the labour market leads workers, in order to escape unemployment, to accept jobs in which they do not benefit from social security coverage. In this situation, the measures adopted by the Turkish government to make the whole of the population aware of the benefits of greater formalisation and the arrangements made to increase
controls over firms are moves in the right direction. However, if it were to turn out that the measures to combat informal employment were not leading to a significant reduction in such jobs, it would then probably be necessary to reflect on the nature of the social security system as a whole, in order to offer individu-als, independently of their employment, coverage against risks.
APPENDIX
Table A-1: Unweighted logistic regression of the probability of having an informal job, excluding agriculture
Note: 3 asterisks indicate that the probability of erroneously rejecting the null hypothe-sis of non-significance is less than 1% (p-value below 1 %).
Source: authors’ calculations based on Turkish Statistical Institute, household labour force survey results.
2000 2001 2002 2003 2004 2005 2006
More than 10 workers -1.6*** -1.7*** -1.9*** -1.9*** -1.8*** -1.8*** -1.9*** Mining and quarrying -0.6*** -0.6*** -0.8*** -0.5 -0.3*** -0.5*** -0.2
Manufacturing 0.0 0.1*** 0.2*** 0.1*** 0.0 0.1*** 0.1***
Electricity, gas and water -1.9*** -2.2*** -3.1*** -2.2*** -1.7*** -1.4***
Construction 0.5*** 0.4*** 0.4*** 0.3*** 0.3*** 0.3*** 0.2***
Transport & comm. -0.0 -0.0 -0.1*** -0.1 0.0 0.1*** 0.2***
Fin. & real estate activities -0.4*** -0.3*** -0.3*** -0.2*** -0.2*** -0.2*** -0.3*** Comm'y soc. & pers. ser. -0.5*** -0.6*** -0.6*** -0.7*** -0.5*** -0.4*** -0.4***
Casual wage worker 2.1*** 2.3*** 2.5*** 2.7*** 2.5*** 2.5*** 2.4***
Employer -0.8*** -1.0*** -1.2*** -1.1*** -0.8*** -0.7*** -0.7***
Own-account worker 0.5*** 0.4*** 0.1*** 0.1*** 0.1*** 0.1*** 0.2***
Unpaid family worker 1.5*** 1.8*** 1.9*** 2.0*** 1.6*** 1.4*** 1.4***
Primary -1.1*** -1.0*** -0.8*** -1.0*** -1.2*** -1.2*** -1.1*** Lower secondary -1.5*** -1.3*** -1.1*** -1.3*** -1.4*** -1.4*** -1.4*** Higher secondary -1.9*** -1.8*** -1.7*** -1.9*** -2.0*** -2.0*** -2.0*** Tertiary -2.6*** -2.3*** -2.0*** -2.4*** -2.6*** -2.7*** -2.7*** 15-24 1.0*** 1.0*** 1.0*** 1.0*** 0.9*** 0.9*** 0.9*** Over 50 0.0 0.2*** 0.6*** 0.7*** 0.5*** 0.7*** 0.9*** Single 0.4*** 0.4*** 0.4*** 0.5*** 0.6*** 0.6*** 0.5*** Widowed, divorced 0.5*** 0.5*** 0.7*** 0.5*** 0.5*** 0.6*** 0.6*** Female 0.4*** 0.4*** 0.3*** 0.3*** 0.4*** 0.5*** 0.5*** Number of observations 64 475 63 134 62 346 60 543 93 470 99 615 103 069
Gender: male (ref. category)
Size of firm: fewer than 10 workers (ref. category)
Sector of activity: distribution, hotels & restaurants (ref. category)
Status in employment: regular wage worker (ref. category)
Level of education: no diploma (ref. category)
Age: 25-49 (ref. category)
Table A-2: Mean coefficients derived from the unweighted logistic regressions of the probability of occupying an informal job carried out
on sub-samples, excluding agriculture
Source: authors’ calculations based on Turkish Statistical Institute, household labour force survey results.
2000 2001 2002 2003 2004 2005 2006
More than 10 workers -1.6 -1.7 -1.9 -1.9 -1.8 -1.9 -1.9
Mining and quarrying -0.6 -0.7 -0.9 -0.6 -0.4 -0.6 -0.3
Manufacturing 0.0 0.1 0.2 0.1 0.0 0.1 0.1
Electricity, gas and water -1.3 -1.4 -1.8 -1.1 -1.1 -1.0
Construction 0.5 0.4 0.4 0.3 0.3 0.3 0.2
Transport & comm. 0.0 0.0 -0.1 -0.1 0.0 0.1 0.2
Fin. & real estate activities -0.4 -0.3 -0.4 -0.2 -0.2 -0.2 -0.3
Comm'y soc. & pers. ser. -0.5 -0.6 -0.7 -0.7 -0.5 -0.4 -0.4
Casual wage worker 2.1 2.3 2.5 2.8 2.5 2.5 2.4
Employer -0.8 -1.0 -1.2 -1.1 -0.9 -0.7 -0.7
Own-account worker 0.5 0.4 0.1 0.1 0.1 0.1 0.2
Unpaid family worker 1.5 1.8 1.9 2.0 1.7 1.4 1.4
Primary -1.1 -1.0 -0.8 -1.0 -1.2 -1.2 -1.2
Lower secondary -1.5 -1.4 -1.2 -1.3 -1.4 -1.4 -1.4
Higher secondary -1.9 -1.9 -1.7 -1.9 -2.0 -2.0 -2.0
Tertiary -2.6 -2.3 -2.1 -2.4 -2.7 -2.7 -2.7
Age: 25-49 (ref. category)
15-24 1.0 1.0 1.0 1.1 0.9 0.9 0.9
Over 50 0.0 0.2 0.6 0.7 0.5 0.7 0.9
Single 0.4 0.4 0.4 0.5 0.6 0.6 0.5
Widowed, divorced 0.5 0.5 0.7 0.5 0.5 0.6 0.6
Gender: male (ref. category)
Female 0.4 0.4 0.3 0.3 0.4 0.5 0.5
Number of sub-samples 610 925 386 199 334 543 621
Size of firm: fewer than 10 workers (ref. category)
Sector of activity: distribution, hotels & restaurants (ref. category)
Status in employment: regular wage worker (ref. category)
Level of education: no diploma (ref. category)
REFERENCES
Ben Salem M., Bensidoun I., 2011, « Emplois informels hétérogènes et segmen-tation du marché du travail turc », Document de travail CEE, n° 151, oc-tobre.
Brook A,. Whitehouse E. R., 2006, “The Turkish Pension System: Further Re-forms to Help Solve the Informality Problem”, OECD Economics Depart-ment Working Papers, n° 529.
Charmes J., 2003, « Nouveaux développements dans la mesure de l’économie informelle », Techniques financières et développement, 72, septembre. Commission of the European Communities, 2005, “Turkey 2005 Progress
Re-port”, Commission Staff Working Document, SEC (2005) 1426, COM (2005) 561.
Commission of the European Communities, 2006, “Turkey 2006 Progress Re-port”, Commission Staff Working Document, SEC (2006) 1390, COM (2006) 649.
Commission of the European Communities, 2007, “Turkey 2007 Progress Re-port”, Commission Staff Working Document, SEC (2007) 1436, COM (2007) 663.
Commission of the European Communities, 2008, “Turkey 2008 Progress Re-port”, Commission Staff Working Document, SEC (2008) 2699, COM (2008) 674.
Commission of the European Communities, 2009, “Turkey 2009 Progress Re-port”, Commission Staff Working Document, SEC (2009) 1334, COM (2009) 533.
Hart J.K., 1973, “Informal Income Opportunities and Urban Employment in Ghana”, Journal of Modern African Studies, 11, 3, 61-89.
ILO, 2010, “Concepts, definitions and sub-classifications of informal sector and informal employment”, Draft Chapter 2 Manual on Surveys of Informal Em-ployment and Informal Sector.
http://mospi.nic.in/Mospi_New/upload/DelhiGroup/ILO_Manual_Chapter2_22jan10 .pdf
ILO, 2003, Guidelines concerning a statistical definition of informal employ-ment, November.
ILO, 1993, Resolution concerning the International Classification of Status in Employment (ICSE), adopted by the Fifteenth International Conference of Labour Statisticians, January.
Leblanc D., Lollivier S., Marpsat M., 2000, « L’économétrie et l’étude des comportements. Présentation et mise en œuvre de modèles de régression qualitatifs. Les modèles univariés à résidus logistiques ou normaux (LOGIT, PROBIT) », Document de travail Insee, n° 0001, janvier.
Math A., 2007, « Turquie. La perspective d’un nouvel âge pour les retraites et les fins de carrière », Chronique internationale de l’Ires, n° 109, novembre. OECD, 2006, “Turkey”, Economic Surveys.
OECD, 2008, OECD Employment Outlook.
OECD, 2009, “Is informal normal? Towards more and better jobs in developing countries”, Development Centre Studies.
OJ L 051, 2008, “2008/157/EC: Council Decision of 18 February 2008 on the principles, priorities and conditions contained in the Accession Partnership with the Republic of Turkey and repealing Decision 2006/35/EC”, 26/02/2008, P. 000 4-0018.
Revenue Administration, 2009, “Action Plan of Strategy for Fight against the Informal Economy”, Department of Strategy Development publication n°88, Ankara.
TekinarslanM., 2007, “The project on Fight against Unregistered Employment (KADIM)”, Ministry of Labor and Social Security, Republic of Turkey.
http://www.calisma.gov.tr/sgb_web/sunum/ing.pdf
World Bank, 2010, “Informality: Causes, Consequences, Policies”, Turkey Country Economic Memorandum, Report, n° 48523-TR.
PORTRAIT DE L’EMPLOI INFORMEL EN TURQUIE
Résumé : Le marché du travail turc est caractérisé, comme celui de beaucoup
d’économies en développement, par un recours très large aux emplois infor-mels. Plusieurs actions ont été engagées récemment par les autorités turques pour en limiter l’ampleur. Celles-ci s’inscrivent dans la dynamique du proces-sus d’adhésion à l’Union européenne, dans lequel la Turquie est engagée de-puis l’ouverture des négociations en octobre 2005. Le travail présenté ici dresse, à partir des enquêtes sur la population active réalisées par l’Institut de statistiques turc, un panorama de l’emploi informel en Turquie avant la mise en œuvre de ces actions. Il répond ainsi au besoin exprimé par le Conseil de l’Union européenne de disposer d’une étude du travail non déclaré. À partir d’une analyse descriptive des principales caractéristiques, tant individuelles que professionnelles, des emplois informels et de l’estimation des facteurs qui influent sur la probabilité d'occuper un emploi informel, ce travail permet de dégager un certain nombre d’enseignements sur la manière de cibler les poli-tiques de lutte contre l’emploi informel en Turquie et sur les populations qui rencontrent le plus de difficultés à accéder ou à participer au marché du tra-vail.