HAL Id: hal-02326650
https://hal.archives-ouvertes.fr/hal-02326650
Submitted on 31 Oct 2019
HAL is a multi-disciplinary open access
archive for the deposit and dissemination of sci-entific research documents, whether they are pub-lished or not. The documents may come from teaching and research institutions in France or abroad, or from public or private research centers.
L’archive ouverte pluridisciplinaire HAL, est destinée au dépôt et à la diffusion de documents scientifiques de niveau recherche, publiés ou non, émanant des établissements d’enseignement et de recherche français ou étrangers, des laboratoires publics ou privés.
through FTIR spectroscopy gas phase analysis
Jérôme Berjonneau, Francis Langlais, Georges Chollon
To cite this version:
Jérôme Berjonneau, Francis Langlais, Georges Chollon. Understanding the CVD process of (Si)–B–C ceramics through FTIR spectroscopy gas phase analysis. Surface and Coatings Technology, Elsevier, 2007, 201 (16-17), pp.7273-7285. �10.1016/j.surfcoat.2007.01.039�. �hal-02326650�
Available at: https://doi.org/10.1016/j.surfcoat.2007.01.039 Understanding the CVD process of (Si)-B-C ceramics
through FTIR spectroscopy gas phase analysis
J. Berjonneau, F. Langlais* and G. Chollon
Laboratoire des Composites Thermostructuraux, UMR 5801 : CNRS - Snecma - CEA - UB1,
3 Allée de la Boétie, 33600 Pessac, France
Abstract – B-C and Si-B-C ceramics are used as self-healing matrices in ceramic matrix
composites. They can be processed by CVD respectively from BCl3-CH4-H2 and BCl3 -CH3SiCl3-H2 precursors under reduced pressure and relatively low temperature. An investigation of the CVD process is presented for the two systems on the basis of a FTIR in situ analysis of the gas phase. By adding a porous substrate with a high internal surface in the hot zone of the reactor, the consumption of specific species is enhanced, revealing the effective precursors of the solid (e.g., HBCl2 giving rise to boron). In order to better understand the mechanisms of the solid formation, correlations are pointed out between the gas phase analysis, the deposition kinetics and the properties of the coatings. In the B-C system, an amorphous carbon-rich boron carbide (comprising mostly B-C bonds) is obtained according to a heterogeneous reaction between HBCl2 and a carbon effective precursor (e.g. the CH3 radical), the C content of the coating increasing with the maturation of the hydrocarbon (i.e. with increasing temperature and PCH4). In the Si-B-C system, two chemical
processes compete against each other. The first one, occurring at low temperature (800-900°C), is similar to that involved for the B-C system. The second one, gradually prevailing at higher temperature (900-1000°C), is governed by the formation of Si-C bonds according to a heterogeneous reaction between hydrocarbons and chlorosilanes. This process competes with the formation of B-C bonds and gives rise to SiC nanocrystals for the highest temperatures (T > 1000°C), in a kinetic regime controlled by the mass transfers.
Keywords: CVD; (Si)-B-C; Gas phase analysis; FTIR; Deposition process
1- INTRODUCTION
The durability of SiC-based ceramic matrix composites (CMCs) under harsh conditions (mechanical stress, oxydizing environment, high temperature) can be improved by adding boron to the SiC-matrix. Its oxidation indeed leads to borosilicate glasses with a low melting point allowing crack healing between 500 and 1000°C [1-3]. A very convenient technique to process boron-based ceramic matrices is chemical vapour infiltration (CVI). The ternary ceramic Si-B-C can be infiltrated from the BCl3-CH3SiCl3(MTS)-H2 gaseous precursor. Due to the complexity of this system, the study of the deposition of B-C ceramics (which are also used in self-healing matrices) from the BCl3-CH4-H2 precursor is a helpful preliminary approach. The CVD of the B-C system has furthermore been widely investigated through theoretical and experimental approaches [4-14]. Conversely, except for the work of Goujard et al., very few studies have been carried out on the CVD of the Si-B-C ternary system [1-3, 15-17].
In order to control and optimize the processing of B-C and Si-B-C ceramic matrices and build an overall modelling of the CVI processes, it is necessary to identify the CVD kinetics and deposition mechanisms. The infiltration of a ceramic within fibrous performs requires to promote mass transfer with respect to chemical reaction rates. A hot-wall reactor operating at low temperature and reduced pressure is therefore preferred [18]. Except for the studies of Hannache et al. in the B-C system and Goujard et al. in the Si-B-C system, such conditions were not explored in the previous works. For the former system, most of the investigations were carried out using cold wall reactors at relatively high temperature (T > 1000°C) and either at atmospheric or reduced pressure. Vandenbulcke et al. proposed mass transfer-equilibrium and mass transfer-kinetics models and compared the theoretical data to the experimental deposition rates. These authors evidenced the limiting kinetic effect of the carbon formation from the decomposition of CH4, especially at low temperature, giving rise to carbon-rich rhombohedral (B13C or B13C3) and amorphous (BCx) boron carbide. These results were later confirmed by Jansson et al. [10], who pointed out the difficulty to obtain a high carbon content in the films deposited under reduced pressure (xc < 22 at.% for 1 < P < 7 kPa). In the case of the Si-B-C system, the temperatures and pressures explored by Goujard et al. [16] or Golda and Gallois [17] are relatively high (e.g., P = 40 or 30 kPa, respectively) and
not favourable to an effective infiltration process. Furthermore, the data obtained by these authors are incomplete to satisfactorily determine the kinetic laws of deposition (activation energies and partial reaction orders were not determined) and the homogeneous reactions involved in the process.
As recently shown in the case of laminar pyrocarbon deposition, a multiple experimental investigation (including in particular a kinetic study, a physico-chemical characterization and a gas phase analysis) is helpful to understand the CVD mechanisms [19]. The same approach has been very recently applied to the CVD of B-C and Si-B-C ceramics [20, 21]. In both cases, the results of the various experimental approaches were correlated and have supported preliminary discussions on the chemical processes respectively involved. The purpose of the present contribution is to emphasize the in-situ gas phase analysis, by mean of the FTIR spectroscopy. This technique has been shown to be very fruitful to identify, sometimes in conjunction with a thermodynamic study, the intermediate species playing the role of the effective precursors of the solid deposited, e.g. pyrocarbon [19], diamond [22], silicon [23], silicon carbide [24-26], boron carbide [8] and various oxides SnO
2[27], BaSrTiO3[28], Pb (Zr, Ti) O3[29]. For the present study of both the B-C and Si-B-C systems, correlations are reported between (1) in-situ FTIR gas phase analysis, (2) characterization of the coatings, (3) kinetic study and, as a conclusion, the various chemical processes possibly involved are discussed.
2- EXPERIMENTAL 2.1- CVD equipment
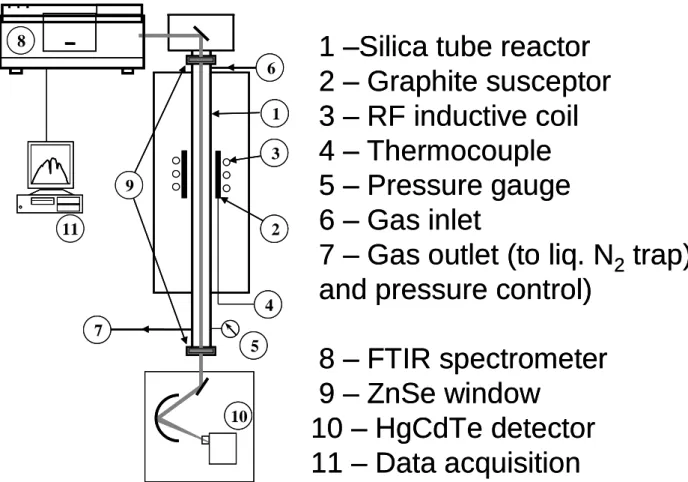
The B-C and Si-B-C ceramics were deposited on dense and polished graphite cylindrical substrates (10 mm height, 10 mm diameter) in a low pressure hot-wall CVD reactor (Fig. 1). This reactor is a vertical silica glass tube (700 mm length, 34 mm internal diameter) heated in its central part by a radio-frequency induction furnace using a 130 mm long graphite susceptor including a K-type thermocouple. The isothermal zone is 100 mm high within a temperature range of (T 25°C). The reactor is fed downward with the various species of the precursor mixture through electronic mass flow controllers (from Brooks Instruments) regulating the partial flow rates Qi. The effluent gases are pumped via cold traps by a classical rotary pump (from Alcatel). The total pressure P is controlled with a motorized valve coupled to a variable capacitance pressure gauge (both form MKS Instruments).
2.2- FTIR in-situ analysis
For the gas phase analysis, a FTIR spectrometer (Nicolet 550) was coupled to the CVD reactor (Fig. 1). The infrared beam coming out of the optical bench of the spectrometer is directed towards the entrance window (ZnSe) with a mirror. The parallel beam passes axially through the reactor, integrating signals due to the precursor and the various species produced in the hot reaction zone. The output IR beam is directed to and focused on a HgCdTe (MCT-A) detector cooled by liquid nitrogen. The mirrors and detector outside the optical bench and the tubing confining the whole IR-beam are purged with a nitrogen flow to prevent absorption by atmospheric water and carbon dioxide.
The variations of the gas phase composition were studied by infrared absorption spectroscopy, which provides a rapid measurement of the relative amounts of the detected species. For each absorption spectrum, about one hundred scans were collected in a spectral range from 600 to 4000 cm-1 and with a spectral resolution of 1 cm-1. The background spectrum was collected just before the sample spectrum by replacing the precursor mixture by a pure hydrogen flow at the same temperature. The relative concentrations of the various identified molecules were estimated by measuring the areas of representative peaks on the spectra displaying the absorbance versus wave number. A linear dependence between peak area and concentration can be assumed because of the low partial pressures (Beer-Lambert law). For each condition, three spectra were recorded in order to reduce the experimental errors.
Moreover, an annular porous carbon substrate with a high specific area and allowing the IR beam to go through, was in a few cases added in the hot zone, to more specifically favour the heterogeneous reactions and identify the consumed species.
2.3- CVD conditions
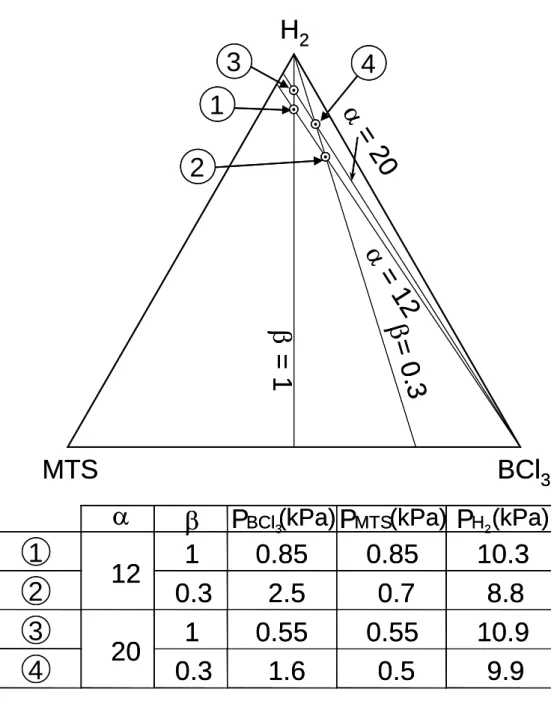
For both the B-C and Si-B-C systems, the experimental conditions were chosen compatible with the CVI process. The total pressure was P = 2, 5 and 12 kPa. The temperature T ranged from 750 to 1050°C. The total flow rate Q was chosen in the range 50-500 sccm. The initial gas phase composition was defined by the ratios = PBCl3/PCH4 and = PH2/PBCl3,
composition ranges were chosen as follows, for the B-C system: 2 < = PBCl3/PCH4 < 4 and 2
< = PH2/PBCl3 < 5 i.e., with a large excess of hydrogen to promote the reduction of BCl3 and a slight excess of BCl3 with respect to CH4, to adjust the stoichiometry of boron carbide (Fig. 2) and for the Si-B-C system: 12 < = PH2/PMTS < 20 and 0.3 < = PMTS/PBCl3 < 1 resulting,
besides the large excess of H2, to a slight excess of BCl3 with respect to MTS to obtain boron-rich Si-B-C ceramics (Fig. 3).
3- RESULTS
3.1- B-C ceramics from BCl3-CH4-H2
The main gaseous species detected in situ by FTIR spectrometry were BCl3, HBCl2 and HCl, as shown in the typical spectrum of figure 4. The positions of the characteristic bands and the associated vibration modes are given in table 1. The peak areas are represented in figures 5 and 6 as a function of temperature, for the four limit compositions of the studied domain at P = 12 kPa and for = 4, = 5 at P = 2 kPa, either in the presence or without porous perform in the hot zone. Owing to the contribution of the inlet initial species in the upper part of the reactor and the outlet gases (products and unreacted species) in the lower part, the variations of the IR peak areas characteristic of the reactants (CH4, BCl3) versus temperature are therefore underestimated with respect to the variations of the intermediate species such as HBCl2. The slight decrease of the CH4 and BCl3 apparent concentrations when the temperature increases up to 500°C, can be explained by a thermal expansion of the gases (their decomposition is not expected in this temperature range [20]). This decrease is enhanced when the temperature rises above 500°C, in qualitative agreement with the homogeneous equilibrium recently calculated (Fig. 7) [20]. The initiation of the consumption of BCl3 at low temperature is directly related to the starting production of HBCl2 and HCl according to the reaction:
BCl3 + H2 HBCl2 + HCl (1)
This result is in agreement with the FTIR analyses carried out by Noyan Dilek et al. [8] for the CVD on a tungsten substrate from the same BCl3-CH4-H2 system, at atmospheric pressure and
high temperature (between 1200 and 1450°C) and for slightly higher initial concentration of BCl3 (2.5 < < 6). These authors have shown the presence of HBCl2 in the reactor for a temperature as low as 350°C. Moreover, such a species had already been evidenced by FTIR for the BCl3-H2 system [33-35] and by mass spectrometry for the BCl3-TiCl4-H2 system [36-37].
Considering now the carbon source species, the dehydrogenation of CH4 into C2H2, according to the reaction:
2 CH4 C2H2 + 3 H2 (2)
which was predicted by the homogeneous equilibrium calculation (Fig. 7), is not detected in the present in-situ FTIR analysis. This is probably due to a fast heterogeneous consumption of this reactive hydrocarbon, as opposed to its slow homogeneous production.
The peak area of HBCl2 exhibits a maximum at about 800-900°C, corresponding to the starting deposition of the solid. HBCl2 is homogeneously produced according to reaction (1) below this temperature, whereas it is partly consumed beyond 900°C, probably through both homogeneous reaction (e.g., forming further reduced species such as H2BCl, as shown in figure 7) and heterogeneous reaction with a hydrocarbon, to produced boron carbide.
The various reactions described above are enhanced by the addition of a porous substrate in the hot zone of the reactor. Only homogeneous reactions take place below 800°C (e.g., reaction (1)), the deposition rate being indeed negligible [20], whereas both the homogeneous and heterogeneous reactions are expected to occur above 800°C. The addition of a porous substrate gives rise to a further consumption of CH4 and HBCl2, but only at temperatures beyond 800°C, corresponding to the starting of the solid deposition. Both species can therefore be assumed to contribute rather directly to the heterogeneous process (Fig. 5). It can be noticed that when the temperature increases up to the highest investigated values (i.e. 1000-1050°C) and for the total pressure of 12 kPa, the consumption of CH4 is apparently enhanced whereas that of HBCl2 tends to be reduced. This change of the gas phase may be associated with a decrease of the B/C atomic ratio at high temperature. On the other hand, when decreases from 4 to 2 (i.e. when PCH4 increases, as shown in figure 2), the
consumption of HBCl2 increases (Fig. 5) indicating the role of CH4 in promoting the deposition process. This phenomenon should lead to a boron-enriched coating and a higher deposition rate as decreases. HCl is produced in higher amounts as the temperature is raised and in presence of a porous substrate. This results from (i) the homogeneous reaction (1),
corresponding to the formation of HBCl2 at temperatures lower than 800°C and (ii) both homogeneous and heterogeneous reactions, giving rise to boron carbide beyond 800°C.
For a pressure of 2 kPa and an initial composition given by = 4, = 5, the thermal behaviours of the peak areas are similar to those observed at 12 kPa, except for HBCl2 (Fig. 6). The concentration of this species in the presence of a porous substrate remains higher than that without substrate over almost the whole temperature range (i.e. up to 1000°C). This result shows that HBCl2, which is only slightly produced by reaction (1), is not significantly consumed through heterogeneous reactions, probably owing to the very low partial pressure of CH4 (0.08 kPa). To be more thoroughly understood, this specific result must be correlated with a kinetic study and a characterization of the deposit.
The present FTIR gas phase analysis of the BCl3-CH4-H2 system experimentally establishes the role of HBCl2 as a reactional intermediate in the deposition process of boron carbide, provided a sufficient pressure (P > 10 kPa). This result is consistent with that obtained by Noyan Dilek et al. for slightly different conditions[8].
3.2- Si-B-C ceramics from BCl3-CH3SiCl3-H2
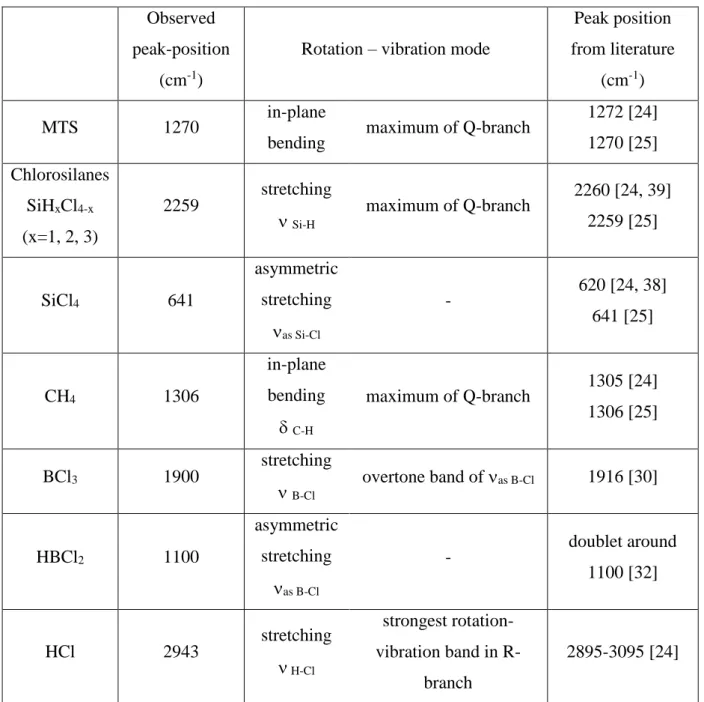
A typical IR spectrum of the gas phase in the BCl3-CH3SiCl3-H2 system (for T = 900°C, P = 12 kPa, = 12, = 1 and Q = 420 sccm) is shown in figure 8. The gaseous species detected are MTS, SiCl4, chlorosilanes HxSiCl4-x (with x = 1, 2, 3), CH4, BCl3, HBCl2 and HCl. The position of the characteristic bands chosen for the analysis and their corresponding vibration modes are given in table 2. The assignment of the peaks associated to MTS and its derived species was carried out on the basis of previous studies on the CVD/CVI of SiC ceramics from MTS/H2 precursor [24-26]. The analysis of BCl3 and HBCl2 was based on the present investigation on the B-C system.
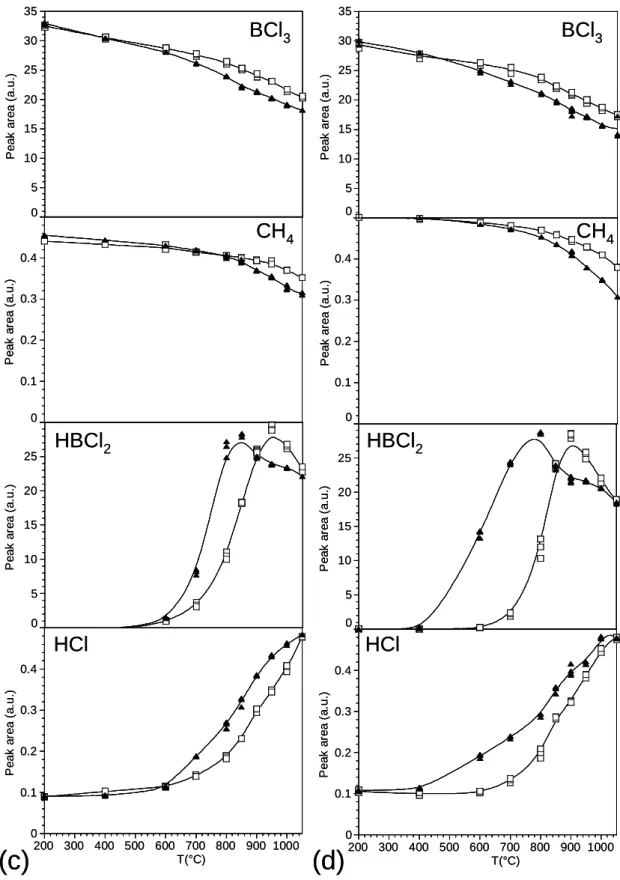
The peak areas are represented in figure 9 as a function of temperature (from room temperature to 1050°C) for P = 12 kPa, = 12 and = 1, either in the presence or without annular porous substrate in the reactional zone. From room temperature to about 500°C, the peak areas of MTS and BCl3 both slightly decrease owing, as for the B-C system, to the thermal expansion of the gases. The decrease becomes much more significant as the temperature rises, from about 800°C for MTS and 600°C for BCl3. As for the B-C system, the starting consumption of BCl3 at low temperature is directly related to the production of HBCl2 and HCl through homogeneous reactions (Fig. 9e-9g). Similarly, the consumption of MTS is
associated with the production of SiCl4, HxSiCl4-x and CH4 (Fig. 9a-9d). The decomposition of BCl3 is strongly enhanced by the addition of a porous substrate (starting at 400°C instead of 600°C). At such a low temperature, the deposition rate is negligible and heterogeneous reactions are not expected to occur. The porous substrate can be assumed to favour the homogeneous reactions (e.g. the reduction of BCl3 into HBCl2) by increasing the effective residence time of the gas phase in the hot zone. Conversely, the decomposition of MTS is only slightly enhanced by the porous substrate (starting at 750°C instead of 800°C, Fig. 9a). As already observed for the B-C system, the HBCl2 peak area exhibits a maximum at about 850-900°C without substrate and 750°C with the substrate (Fig. 9f), corresponding to the starting deposition of the solid[20]. Below these temperatures, HBCl2 is homogeneously produced whereas beyond, it is partly heterogeneously consumed to form B-C bonds through a reaction with a hydrocarbon. For the highest temperatures (T > 850°C), the peak area drop induced by the porous substrate can be assigned mostly to the heterogeneous consumption of HBCl2 and should be therefore related to the boron content of the coating. The peak areas of CH4 and the chlorosilane species show a maximum at about 1000°C, either in presence or without porous substrate (Fig. 9b-9d). A heterogeneous consumption of these species (as shown by the peak area drop due to the porous substrate) is however observed to increase with temperature from 900 to 1050°C, which may give rise to an increase of the silicon and carbon contents in the coating.
Figure 10 shows the peak areas of SiCl4 and chlorosilanes HxSiCl4-x versus temperature at P = 12 kPa and = 20, = 0.3. The influence of the gas phase initial composition on the heterogeneous consumption of the MTS-derived species can be assessed by comparison with Figure 9b-9c. When the composition varies from = 12, = 1 to = 20, = 0.3 (i.e., when the MTS partial pressure decreases from 0.86 to 0.49 kPa, hindering its decomposition), a strong decrease of the consumption of SiCl4 and chlorosilanes is observed, suggesting a possible decrease of the silicon content in the coating.
The increase of the total flow rate (i.e. the decrease of the residence time) results in a decrease of the heterogeneous consumption of HBCl2 (Fig. 11) which may induce a decrease of the boron content in the coating.
Finally, the gas phase composition at P = 5 kPa, = 12 and = 1 was compared to the same condition but in the absence of BCl3 in the initial gas mixture (P = 5 kPa, = 12), with a view to investigate the role of BCl3 in the decomposition of MTS. The production of SiCl4 is strongly enhanced by the presence of BCl3, whereas the formation of CH4 is almost
unaffected (Fig. 12). The small influence of BCl3 on the CH4 concentration could be explained by a heterogeneous consumption of CH4 (or of its direct precursor the radical CH3
), within the low temperature range (780 < T < 900°C), counterbalancing its homogeneous production from the decomposition of MTS. This phenomenon would then result in a high carbon content in the deposit.
The present FTIR investigation of the gas phase in the BCl3-MTS-H2 system suggests the existence of two parallel routes in the deposition of Si-B-C ceramics : the first one resulting in the formation of boron from HBCl2, at relatively low temperature (from about 800°C) ; the second one giving rise to the formation of silicon from chlorosilane at higher temperatures (from about 900°C).
4- DISCUSSION AND CONCLUSIONS
4.1- Previous results on the deposition kinetics and the properties of the coatings
4.1.1- B-C ceramics from BCl3-CH4-H2[20]
A kinetic study was carried out to define a domain of experimental conditions where the process is limited by the chemical reactions (characterized by linear Arrhenius plots and deposition rates independent of the total flow rate). The Arrhenius plots LnR = f(1000/T) reported in figure 13 for the total pressure of 12 kPa and the four initial compositions previously defined (conditions (1) to (4), given in figure 2) show linear behaviours between 800 and 975°C. The apparent activation energies and the reaction orders with respect to the initial gaseous species (BCl3, CH4, H2) were derived within these domains. This allowed to propose the following general kinetic law R = Ro exp (-Ea/RT) PCH4 PBCl3-0.5, valid for a total
pressure close to 12 kPa, where Ro and Ea depend on the initial composition and the temperature range (table 3). For a specific condition of pressure and initial composition (P = 2 kPa and = 4, = 5), a singular kinetic behaviour was observed, characterized by the absence of a linear domain in the Arrhenius plot (Fig. 14).
For the initial compositions (1) to (4), a pressure of 12 kPa, and for temperatures and total gas flow rates chosen within the kinetic domain controlled by chemical reactions, the B/C atomic ratio ranges from 2 to 3.5, indicating a carbon excess with respect to the
stoichiometry of B4C (table 4). This ratio was found to decrease when the deposition temperature increases and more specifically between 950 and 1000°C, for = 2, = 5. The surface and fracture section morphology was homogeneous and amorphous-like for the low temperature coatings and exhibited an extremely fine nanotexture for the samples processed at the highest temperatures. XRD could not evidence any organized phase. The occurrence of crystalline boron carbide and free aromatic carbon (with a sp2 hybridization) was not even revealed by Raman microspectroscopy. For the condition P = 2 kPa, = 4, = 5, related to the singular Arrhenius plot shown in Fig. 14, the coatings contained a high concentration of boron at 800°C (atomic ratio B/C > 4) and carbon at 1000°C (B/C << 1).
4.1.2- Si-B-C ceramics from BCl3-CH3SiCl3-H2[21]
For this more complex system, a large experimental domain favourable to a kinetic process limited by the chemical reactions has been evidenced. The deposition rate does not depend on the total flow rate over the whole investigated domain except for P = 12 kPa and an initial composition not too rich in H2 ( = 12). The Arrhenius plots (Fig. 15) have revealed a linear behaviour over the whole studied temperature range at 2 kPa and for T < 1000°C at 5 and 12 kPa. At P = 2 kPa, a single kinetic regime was observed with an apparent activation energy of about 185 kJmol-1. At P = 5 and 12 kPa, two chemical regimes were evidenced : the first one for intermediate temperatures (900 < T < 1000°C), with an apparent activation energy close to 285 kJmol-1 and the second one at lower temperature (T < 900°C), with a lower activation energy of about 180 kJmol-1. At 12 kPa, for = 12 and = 1, a decrease of the total flow rate from 420 to 175 sccm results in a noticeable increase of the deposition rate (Fig. 15c). Such a transition between two chemical processes, characterized by an increase of the activation energy with temperature, suggests a competition between two parallel deposition routes, the fastest prevailing over the slowest one. The determination of the apparent reactions orders at 800 and 900°C for P = 12 kPa confirmed and more precisely defined the transition between the two distinct kinetic regimes. The reaction order with respect to MTS is positive and relatively high (0.8 at 800°C and 1.6 at 900°C). Conversely, the reaction order with respect to BCl3 is slightly negative (-0.2 at 800°C and -1.5 at 900°C). As in the case of the B-C system, these negative reaction orders can be related to an inhibition effect due to the HCl species produced by the homogeneous decomposition of BCl3. This was
confirmed by the highly negative value of the reaction order with respect to HCl, at high HCl partial pressures (-2.5 at 800°C and -4.2 at 900°C).
The Si, B and C atomic concentrations of the coatings were determined by AES for temperatures ranging from 750 to 1050°C, for three different pressures 2, 5 and 12 kPa and for two gas phase compositions = 12, = 1 and = 20, = 0.3 (Fig. 16). The Si atomic concentration is surprisingly low, ranging from 0.5 to 18%, the C content ranges from 23 to 42 at. % and the B content remains relatively high (from 40 to 75 at. %). The Si concentration increases when both the temperature and the MTS and H2 initial contents increase with respect to BCl3. The variations of the B concentration exhibit a maximum while those of C show a minimum around 900°C. These changes in the B and C contents together with the increase of the Si content (especially beyond 900°C) can be related to the kinetic transition evidenced above, in terms of activation energy and MTS reaction order. The morphology of the coatings obtained at low temperature was found homogeneous and amorphous-like while an extremely fine nanotexture was observed for the solid deposited at the highest temperatures. When the temperature increases and the MTS and H2 initial partial pressures both increase with respect to BCl3, –SiC nanograins are formed within an amorphous phase (possibly consisting of BxCy icosahedra units with a high C content, but not containing any sp2 or sp3 free carbon phase), as shown by Raman microspectroscopy, X-ray diffraction and TEM analyses.
4.2- Correlations
The first significant conclusion of the present multiple experimental work on the deposition of both B-C and Si-B-C systems is the role of HBCl2 as an intermediate species for the formation of boron in the deposit. This conclusion is supported in particular by the correlation between (i) the consumption of HBCl2 in the presence of a porous substrate, decreasing at high temperature (T > 1000°C) (Fig. 5 and 9) and (ii) the decrease of the boron content in the solid (in both B-C and Si-B-C coatings) (Table 4 and Fig. 16). At low temperature (T < 800°C), HBCl2 is only produced by homogeneous decomposition of BCl3 (enhanced by the presence of a porous substrate). For intermediate temperatures (800 < T < 1000°C), a competition occurs between the homogeneous formation and the consumption of HBCl2, resulting in a maximum of concentration within this temperature range (Fig. 5 and 9). In the Si-B-C system, the change in the kinetic regime at about 900°C (Fig. 15) can be related to the maximum of the B content in the coating (Fig. 16) and to the maximum of HBCl2
consumption in the presence of a porous substrate (Fig. 9). The importance of the HBCl2 species is also evidenced in Fig. 11. The decrease of the total flow rate indeed favours the consumption of HBCl2, resulting in an increase of both the deposition rate (Fig. 15c) and the boron content (Fig. 16), the major element of the Si-B-C coating.
The effective precursor responsible for the formation of carbon in both systems, is less clearly evidenced. For B-C coatings, C2H2 is a possible reactional intermediate which might be readily decomposed into carbon after being produced by the dehydrogenation of methane (though this process is not experimentally established). When PCH4 is increased (e.g., by
decreasing from 4 to 2, as shown in Fig. 5), the consumption of HBCl2 and to a lesser extent of CH4 are increased, resulting in (i) a higher deposition rate (as shown by the Arrhenius plots of Fig. 13 and the reaction orders, especially with respect to CH4) and (ii) a boron-enriched coating (as reported for several conditions in Table 4). For Si-B-C coatings, the carbon and silicon effective precursors both result from the decomposition of MTS in the presence of H2. The FTIR analysis identified CH4 and chlorosilanes (including SiCl4) as respective intermediates in the formation of carbon and silicon. Their consumption (mainly heterogeneous) increases with temperature from 900 to 1050°C and correspond to an increase of the carbon and silicon contents in the coating. The effective precursor of carbon is probably the radical CH3 resulting from the decomposition of MTS. Due to the high reactivity at low temperatures of the effective boron precursor HBCl2, the effective carbon precursor is more likely to react with HBCl2 than with the silicon precursors, giving rise to B-C rather than Si-C bonds. This process can explain the increase of the production of SiCl4 when BCl3 is added to MTS/H2 (Fig. 12). The decomposition of MTS (favoured by this addition) produces (i) SiCl4 (and more generally chlorosilanes), remaining in the gas phase and (ii) CH3 quickly reacting with HBCl2 to form B-C bonds in the solid. This may also explain the relatively high carbon content in the Si-B-C deposit (> 23 at. %).
The formation of silicon during the Si-B-C deposition process occurs through a chlorosilane as effective precursor, but at a temperature higher than that required for the formation of boron. The consumption of chlorosilanes is indeed effective beyond 850 – 900°C (Fig. 9), where significant amounts of Si are formed (Fig. 16). This consumption of chlorosilanes, enhanced by increasing temperature and directly associated with the Si content of the coating, is also favoured by increasing the MTS partial pressure (e.g. from = 20, = 0.3 to = 12, = 1).
4.3- Conclusions on the deposition mechanisms
Within the experimental conditions explored in the present contribution, the solid deposited from the BCl3-CH4-H2 precursor is an amorphous boron carbide enriched in carbon with respect to the stoichiometry of the crystallized forms existing in the B-C system. The B/C atomic ratio ranges from 2 to 3.6, depending on the temperature and the CH4 initial partial pressure. In the deposition mechanism, the most influential step is the heterogeneous reaction between HBCl2 and the carbon effective precursor. This carbon precursor, which is fundamental in the process, is a hydrocarbon with a certain degree of maturation (i.e., of dehydrogenation, as already described in studies on the deposition of pyrocarbon [19]). A higher maturation (involving a more complex chemical route) is obtained by increasing the temperature and the CH4 initial partial pressure, resulting in higher deposition rates (i.e., a positive reaction order with respect to CH4 and an increase of the activation energy with PCH4)
and finally in carbon-enriched coatings. The mechanism involved for lower pressures (total pressure and partial pressure of CH4) seems to be drastically influenced by temperature (see 3.1 and 4.1.1), the composition of the coating varying from boron-rich to almost pure carbon. This specific behaviour needs more investigation to be confirmed and understood.
Three main kinetic regimes can be evidenced in the CVD of Si-B-C coatings from MTS-BCl3-H2 precursor, depending on the temperature range. At low temperatures (800-900°C) and medium temperatures (900-1000°C), two kinetic regimes compete each other. The first one, prevailing at low temperatures is rather similar to the regime observed for the B-C system, with kinetics controlled by heterogeneous reactions between effective precursors (e.g. CH3
and HBCl2) and giving rise to B-C bonds. B-B bonds can also result from the combination of boron-containing species. The coating obtained is amorphous and organized only at a very short range (in the form of disordered icosahedra) with a B/C atomic ratio close to 2. Silicon is not detected (or only in traces) and there is no evidence of aromatic C-C bonds despite the high carbon content. The second kinetic regime, which exhibits higher activation energy and reaction order with respect to MTS, appears at medium temperatures and gives rise to a true ternary solid (with significant amounts of silicon). At this temperature range, the reactivity of the silicon-containing species, the chlorosilanes, become comparable to that of HBCl2 (e.g., through the formation of SiCl2 or SiCl3 radicals). The kinetic process becomes therefore controlled by the heterogeneous reactions between hydrocarbons (e.g. CH3
) and chlorosilanes, to form Si-C bonds competing with B-C bonds. This transition to a different
mechanism gives an explanation of the increase of the silicon and carbon contents and the decrease of the boron content in the coating. However, the temperature is still too low (900-1000°C) to allow the formation of crystals (e.g. -SiC), the coating remaining totally amorphous. Finally, at higher temperatures (T > 1000°C), kinetics are controlled by mass transfer. The silicon and carbon contents increase at a level sufficient to form -SiC nanocrystals, embedded within the amorphous carbon-rich B-C phase. Such a multiphase solid is closer than that predicted by the thermodynamic calculation (SiC + B4C + graphite) [15]. This result can be related to the mass transfer regime favouring chemical reactions and consequently the heterogeneous equilibrium.
Acknowledgements. The authors wish to thank CNRS and SAFRAN for their financial
support through a grant to J. B. They are indebted to S. Bertrand and C. Descamps from SPS for fruitful discussions.
References
1- L. Vandenbulcke, Ceram. Trans. 175 (2005) 13.
2- S. Goujard and L. Vandenbulcke, Ceram. Trans. 46 (1994) 925.
3- E. Bouillon, F. Abbe, S. Goujard, E. Pestourie, G. Habarou and B. Dambrine, Ceram. Eng. Sci. Proc. 21 [3] (2000) 459.
4- A. O. Sezer and J. I. Brand, Mater. Sci. Eng., B79 (2001) 191.
5- M. Ducarroir and C. Bernard, in Proceedings of the 5th International Conference on CVD, J.M. Blochor et al., editors, p.72, The Electrochemical Society, Pennington, NJ (1975).
6- L. Vandenbulcke, R. Herbin, M. Basutcu and J.N. Barrandon, J. Less-Common Met., 80, 7 (1981).
7- L. Vandenbulcke, Ind. Eng. Chem. Proc. Res. Dev., 24 (1985) 568.
8- S. Noyan Dilek, H. O. Ozbelge, N.A. Sezgi and T. Dogu, Ind. Eng. Chem. Res., 40, 751 (2001).
9- L. R. Newkirk, R.E. Riley, H. Sheinberg, F. A. Valencia and T. C. Wallace, in Proceedings of the 7th International Conference on CVD, T. O. Sedwick et al., editors, p. 515, The Electrochemical Society, Pennigton, NJ (1979).
10- U. Jansson, J. O. Carlsson, B. Stridh, S. Soderberg and M. Olson, Thin Solid Films, 172 (1989) 81.
11- S. Lartigue, Cuzajous, M. Nadal and G.Male, in Proceedings of the 5th European Conference on CVD, p. 413, J. O. Carlsson and J. Lindsröm, editors, Uppsala, Sweden (1985).
12- H. Hannache, F. Langlais and R. Naslain, in Proceedings of the 5th European Conference on CVD, p. 219, J. O. Carlsson and J. Lindström, editors., Uppsala, sweden (1985).
13- J. Rey, G.Male, P. Kapsa and J. L. Loubet, J. Phys. Coll. , C5/T50, (1989) 311. 14- T. S. Moss, W. J. Lackey and K. L. More, J. Am. Ceram. Soc., 81 [12], (1998) 3077. 15- S. Goujard, L. Vandenbulcke, C. Bernard, G. Blondiaux and J. L. Debrun, J.
Electrochem. Soc. 141 [2] (1994) 452.
16- S. Goujard, L. Vandenbulcke and C. Bernard, J. Eur. Ceram. Soc. 15 (1995) 551. 17- E. M. Golda and B. Gallois, in: T. E. Besmann, B. M. Gallois and J. W. Warren (eds),
CVD of refractory metals and ceramics II, MRS Symp. Proc. 250 (1992) 167.
18- F. Langlais in: A. Kelly and C. Zweben (eds), Comprehensive Composite Materials 26 (2000) 611.
19- F. Langlais, H. Le Poche, J. Lavenac and O. Féron, Proc. EuroCVD-15, R. A. Fischer et al. (eds), Bochum, D (Sept. 2005)
20- J. Berjonneau, G. Chollon and F. Langlais, J. Electrochem. Soc., in press. 21- J. Berjonneau, G. Chollon and F. Langlais, submitted to Thin Solid Films.
22- S. Jin, L. Bourget and E. Sevillano, Surface and Coating Technology, 68/69 (1994) 394.
23- C. Panczyk and C. G. Takoudis, Proc. 14th Int. Conf. on CVD (and EuroCVD-11), M. D. Allendorf and C. Bernard (eds), The Electrochem. Soc., Pennington (1997) 652. 24- S. Jonas, W. S. Ptak, W. Sadovski, E. Valasek and C. Paluszkiewicz, J. Electrochem.
Soc., 142 [7] (1995) 2357.
25- V. Hopfe, H. Mosebach, M. Erhard and M. Meyer, J. Molecular Structure 347 (1995) 331.
26- K. Brennfleck, S. Schneweis and R. Weiss, J. Phys. IV 9 (1999) 1041.
27- V. Hopfe, D. W. Sheel, C. I. M. A. Spee, R. Tell, P. Martin, A. Beil, M. Pemble, R. Weiss, U. Vogt and W. Graehlert, Thin Solid Films 442 (2003) 60.
29- K. Nagashima, H. Funakubo, S. Saki, Y. Sawada, Y. Miura, N. Higuchi and H. Machida, Chem. Vap. Depo. 6 (2000) 311.
30- R. E. Seruby, J. R. Lacher and J. D. Park, J. Chem. Phys. 19 [3] (1951) 386.
31- O. Brieux de Mandirola and J. F. Westerkamp, Spectrochimica Acta 20 [10] (1964) 1633.
32- C. O. Bass, L. Lynds, T. Wolfram and R. E. De Wames, J. Chem. Phys. 40 [12] (1964) 3611.
33- N. A. Sezgi, T. Dogu and H. O. Ozbelge, Ind. Eng. Chem. Res. 36 (1997) 5537. 34- N. A. Sezgi, T. Dogu and H. O. Ozbelge, Chem. Eng. Sci.54 (1999) 3297.
35- N. A. Sezgi, A. Ersoy, T. Dogu and H. O. Ozbelge, Chem. Eng. Proc. 40 (2001) 525. 36- J. P. Dekker, P. J. Van der Put, J. Schoonman and H.J. Veringa, J. CVD 1 [4] (1993)
317.
37- T. H. Osterheld and M. D. Allendorf in: Covalents ceramics III, Science and Technology of Non-Oxydes, The Material Research Society 410 (1996).
38- P. Mirone and P. Chirboli, Ann. Chim. 50 (1960) 1095. 39- J. Nishizawa and H. Nihira, J. Crystal Growth 45 (1978) 82.
Table captions
Table 1: Absorption band position for the gaseous species identified by FTIR spectroscopy in the BCl3-CH4-H2 system.
Table 2: Absorption band position for the gaseous species identified by FTIR spectroscopy in the BCl3-MTS-H2 system.
Table 3 : Activation energy (Ea) and pre-exponential factor (R0) for the deposition kinetic laws in the BCl3-CH4-H2 system.
Table 4 : B/C atomic ratio of coatings deposited in the BCl3-CH4-H2 system, as measured by AES
Observed
peak-position (cm-1) Rotation – vibration mode
Peak position from literature (cm-1) CH4 3113 stretching C-H strong rotation-vibration band in R-branch 3018 [24] near 3000 [25] BCl3 1900 stretching B-Cl overtone band of as B-Cl at 956 cm-1 1916 [30] HBCl2 2600 stretching B-H - 2625 [31] 2617 [32] HCl 2943 stretching H-Cl strongest rotation-vibration band in R-branch 2895-3095 [24]
Table 1: Absorption band position for the gaseous species identified by FTIR spectroscopy in the BCl3-CH4-H2 system.
Observed peak-position
(cm-1)
Rotation – vibration mode
Peak position from literature
(cm-1)
MTS 1270 in-plane
bending maximum of Q-branch
1272 [24] 1270 [25] Chlorosilanes SiHxCl4-x (x=1, 2, 3) 2259 stretching Si-H maximum of Q-branch 2260 [24, 39] 2259 [25] SiCl4 641 asymmetric stretching as Si-Cl - 620 [24, 38] 641 [25] CH4 1306 in-plane bending C-H maximum of Q-branch 1305 [24] 1306 [25] BCl3 1900 stretching B-Cl overtone band of as B-Cl 1916 [30] HBCl2 1100 asymmetric stretching as B-Cl - doublet around 1100 [32] HCl 2943 stretching H-Cl strongest rotation-vibration band in R-branch 2895-3095 [24]
Table 2: Absorption band position for the gaseous species identified by FTIR spectroscopy in the BCl3-MTS-H2 system.
Qtot (sccm) T (°C) Ea (kJmol-1) R0 (µgcm-2min-1) 5 4 250 825-975 26010 8.1011 2 390 800-975 2988 7.1013 2 4 390 800-900 29710 4.1013 900-975 42510 2.1019 2 210 825-925 47312 1022
Table 3 : Activation energy (Ea) and pre-exponential factor (R0) for the deposition kinetic laws in the BCl3-CH4-H2 system.
4 3 2 1
T(°C) Qtot(sccm) 850 900 950 1000 5 4 250 78/22 (3.5) 73/26 (2.8) 74/26 (2.8) - 2 390 78/22 (3.6) 75/25 (3.0) 76/24 (3.2) 67/33 (2.0) 2 4 390 74/26 (2.9) 75/25 (3.1) 72/28 (2.6) - 2 210 71/29 (2.4) 70/30 (2.3) 74/26 (2.9) -
Table 4 : B/C atomic ratio of coatings deposited in the BCl3-CH4-H2 system, as measured by AES
1 2 3 4
Figure captions
Fig. 1: CVD reactor coupled with a FTIR spectrometer for in situ gas phase analysis
Fig. 2: Ternary diagram showing the gas phase composition experimentally investigated in the BCl3-CH4-H2 system (partial pressures are given for a total pressure of 12 kPa).
Fig. 3: Ternary diagram showing the gas phase composition experimentally investigated in the BCl3-MTS-H2 system (partial pressures are given for a total pressure of 12 kPa).
Fig. 4: FTIR spectrum of the gas phase in the BCl3-CH4-H2 system for T = 900°C, P = 12kPa, = 4, =5 and Q = 250 sccm
Fig. 5: Variations with temperature of the FTIR peak areas of the various gas species in the BCl3-CH4-H2 system, with (black triangles) and without (open squares) a porous substrate, at P = 12 kPa and (a) = 4, = 5, Q = 250sccm, (b) = 2, = 5, Q = 390 sccm, (c) = 4, = 2, Q = 390 sccm and (d) = 2, = 2, Q = 210 sccm.
Fig. 6: Variations with temperature of the FTIR peak areas of the various gas species in the BCl3-CH4-H2 system, with (black triangles) and without (open squares) a porous substrate, at P = 2kPa, = 4, = 5 and Q = 250 sccm.
Fig. 7: Influence of the temperature on the calculated yields at homogeneous phase equilibrium in the BCl3-CH4-H2 system, at P = 10 kPa, = 2 and =2.
Fig. 8: FTIR spectrum of the gas phase in the BCl3-MTS-H2 system for T = 900°C, P = 12kPa, = 12, =1 and Q = 420 sccm.
Fig. 9: Variations with temperature of the FTIR peak areas of the various gas species in the BCl3-MTS-H2 system, with (black triangles) and without (open squares) a porous substrate, at P = 12kPa, = 12, =1 and Q = 420 sccm.
Fig. 10: Variations with temperature of the FTIR peak areas of chlorosilanes and SiCl4, with (dark triangles) and without (open squares) a porous substrate, at P = 12kPa, = 20, =0.3 and Q = 365 sccm.
Fig. 11: Variations with temperature of the FTIR peak areas of HBCl2, with (dark triangles) and without (open squares) a porous substrate, at P = 12kPa, = 20, =0.3, for (a) Q = 420 sccm and (b) Q = 175 sccm.
Fig. 12: Variations with temperature of the FTIR peak areas of CH4 and SiCl4, at P = 5kPa, either with BCl3 (dark triangles, = 12, = 1 and Q = 245 sccm) or without BCl3 (open circles, = 12).
Fig. 13: Influence of the reciprocal temperature on the deposition rate (Arrhenius plot) in the BCl3-CH4-H2 system, at P = 12kPa and for the various compositions and flow rates of the gas phase.
Fig. 14: Influence of the reciprocal temperature on the deposition rate (Arrhenius plot) in the BCl3-CH4-H2 system, at P = 2 kPa and for = 4, = 5 and Q = 250 sccm.
Fig. 15: Influence of the reciprocal temperature on the deposition rate (Arrhenius plots) in the BCl3-MTS-H2 system, for the various compositions and flow rates of the gas phase, at (a) P = 2kPa, (b) P = 5 kPa and (c) P = 12 kPa.
Fig. 16: Variations with temperature of the elemental composition of the coatings deposited at various pressures and for (a) = 20, = 0.3, Q = 243 sccm (P = 2 and 5 kPa) or Q = 365 sccm (P = 12 kPa) and (b) = 12, = 1, Q = 245 sccm (P = 2 and 5 kPa) or Q = 420 sccm (P = 12 kPa).
1 –Silica tube reactor
2 – Graphite susceptor
3 – RF inductive coil
4 – Thermocouple
5 – Pressure gauge
6 – Gas inlet
7 – Gas outlet (to liq. N
2trap)
and pressure control)
8 – FTIR spectrometer
9 – ZnSe window
10 – HgCdTe detector
11 – Data acquisition
5 11 3 1 2 8 9 10 6 4 71 –Silica tube reactor
2 – Graphite susceptor
3 – RF inductive coil
4 – Thermocouple
5 – Pressure gauge
6 – Gas inlet
7 – Gas outlet (to liq. N
2trap)
and pressure control)
8 – FTIR spectrometer
9 – ZnSe window
10 – HgCdTe detector
11 – Data acquisition
5 5 11 3 3 1 1 2 2 8 9 10 10 6 6 4 4 7 7
P
BCl3(kPa)
P
CH4(kPa)
P
H2(kPa)
1
4
1.9
0.5
9.6
2
5
2
1.9
0.9
9.2
3
4
3.7
0.9
7.4
4
2
2
3.4
1.7
6.9
H
2BCl
3CH
43
1
2
4
=2
=5
=4
=2
P
BCl3(kPa)
P
CH4(kPa)
P
H2(kPa)
1
4
1.9
0.5
9.6
2
5
2
1.9
0.9
9.2
3
4
3.7
0.9
7.4
4
2
2
3.4
1.7
6.9
P
BCl3(kPa)
P
CH4(kPa)
P
H2(kPa)
1
4
1.9
0.5
9.6
2
5
2
1.9
0.9
9.2
3
4
3.7
0.9
7.4
4
2
2
3.4
1.7
6.9
H
2BCl
3CH
43
3
1
1
2
2
4
4
=2
=5
=4
=2
Fig. 2: Ternary diagram showing the gas phase composition experimentally investigated in the BCl3-CH4-H2 system (partial pressures are given for a total pressure of 12 kPa).
H
2
=
1
2
=
2
0
=
1
=
0
.3
P
BCl3(kPa)
P
MTS(kPa)
P
H2(kPa)
1
1
0.85
0.85
10.3
2
12
0.3
2.5
0.7
8.8
3
1
0.55
0.55
10.9
4
20
0.3
1.6
0.5
9.9
3
1
2
4
MTS
BCl
3H
2
=
1
2
=
2
0
=
1
=
0
.3
P
BCl3(kPa)
P
MTS(kPa)
P
H2(kPa)
1
1
0.85
0.85
10.3
2
12
0.3
2.5
0.7
8.8
3
1
0.55
0.55
10.9
4
20
0.3
1.6
0.5
9.9
3
3
1
1
2
2
4
4
MTS
BCl
3Fig. 3: Ternary diagram showing the gas phase composition experimentally investigated in the BCl3-MTS-H2 system (partial pressures are given for a total pressure of 12 kPa).
500
1000
1500
2000
2500
3000
3500
0
1
2
3
4
5
6
Abs
orban
ce
Wavenumber (cm
-1)
HBCl
2CH
4BCl
3HCl
X5
CH
40 0.1 0.2 0.3 0.4 200 300 400 500 600 700 800 900 1000 P e a k a re a ( a .u .) T(°C) 0 5 10 15 20 25 P e a k a re a ( a .u .) 0 0.1 0.2 0.3 0.4 P e a k a re a ( a .u .) 0 5 10 15 20 25 30 35 P e a k a re a ( a .u .) 0 0.1 0.2 0.3 0.4 200 300 400 500 600 700 800 900 1000 P e a k a re a ( a .u .) T(°C) 0 5 10 15 20 25 P e a k a re a ( a .u .) 0 0.1 0.2 0.3 0.4 P e a k a re a ( a .u .) 0 5 10 15 20 25 30 35 P e a k a re a ( a .u .)
(a)
(b)
BCl
3BCl
3CH
4CH
4HBCl
2HBCl
2HCl
HCl
0 0.1 0.2 0.3 0.4 200 300 400 500 600 700 800 900 1000 P e a k a re a ( a .u .) T(°C) 0 5 10 15 20 25 P e a k a re a ( a .u .) 0 0.1 0.2 0.3 0.4 P e a k a re a ( a .u .) 0 5 10 15 20 25 30 35 P e a k a re a ( a .u .) 0 0.1 0.2 0.3 0 0.1 0.2 0.3 0.4 200 300 400 500 600 700 800 900 1000 P e a k a re a ( a .u .) T(°C) 0 5 10 15 20 25 P e a k a re a ( a .u .) 0 0.1 0.2 0.3 0.4 P e a k a re a ( a .u .) 0 5 10 15 20 25 30 35 P e a k a re a ( a .u .)(a)
(b)
BCl
3BCl
3CH
4CH
4HBCl
2HBCl
2HCl
HCl
Fi g. 5: Variations with temperature of the FTIR peak areas of the various gas species in the BCl3-CH4-H2 system, with (black triangles) and without (open squares) a porous substrate, at P = 12 kPa and (a) = 4, = 5, Q = 250sccm, (b) = 2, = 5, Q = 390 sccm, (c) = 4, = 2, Q = 390 sccm and (d) = 2, = 2, Q = 210 sccm.0 0.1 0.2 0.3 0.4 200 300 400 500 600 700 800 900 1000 P e a k a re a ( a .u .) T(°C) 0 5 10 15 20 25 P e a k a re a ( a .u .) 0 0.1 0.2 0.3 0.4 P e a k a re a ( a .u .) 0 5 10 15 20 25 30 35 P e a k a re a ( a .u .) 0 0.1 0.2 0.3 0.4 200 300 400 500 600 700 800 900 1000 P e a k a re a ( a .u .) T(°C) 0 5 10 15 20 25 P e a k a re a ( a .u .) 0 0.1 0.2 0.3 0.4 P e a k a re a ( a .u .) 0 5 10 15 20 25 30 35 P e a k a re a ( a .u .)
(c)
(d)
BCl
3BCl
3CH
4CH
4HBCl
2HBCl
2HCl
HCl
0 0.1 0.2 0.3 0.4 200 300 400 500 600 700 800 900 1000 P e a k a re a ( a .u .) T(°C) 0 5 10 15 20 25 P e a k a re a ( a .u .) 0 0.1 0.2 0.3 0.4 P e a k a re a ( a .u .) 0 5 10 15 20 25 30 35 P e a k a re a ( a .u .) 0 0.1 0.2 0.3 0.4 200 300 400 500 600 700 800 900 1000 P e a k a re a ( a .u .) T(°C) 0 5 10 15 20 25 P e a k a re a ( a .u .) 0 0.1 0.2 0.3 0.4 P e a k a re a ( a .u .) 0 5 10 15 20 25 30 35 P e a k a re a ( a .u .)(c)
(d)
BCl
3BCl
3CH
4CH
4HBCl
2HBCl
2HCl
HCl
Fig. 5: Variations with temperature of the FTIR peak areas of the various gas species in the BCl3-CH4-H2 system, with (black triangles) and without (open squares) a porous substrate, at P = 12 kPa and (a) = 4, = 5, Q = 250sccm, (b) = 2, = 5, Q = 390 sccm, (c) = 4, = 2, Q = 390 sccm and (d) = 2, = 2, Q = 210 sccm.
0 0 0.02 0.04 0.06 0.08 200 300 400 500 600 700 800 900 1000 P e a k a re a ( a .u .) T(°C) 0 0.5 1 1.5 2 2.5 P e a k a re a ( a .u .) 0 0.5 1 1.5 2 2.5 3 P e a k a re a ( a .u .) 0.02 0.04 0.06 0.08 P e a k a re a ( a .u .)
BCl
3CH
4HBCl
2HCl
0 0 0.02 0.04 0.06 0.08 200 300 400 500 600 700 800 900 1000 P e a k a re a ( a .u .) T(°C) 0 0.5 1 1.5 2 2.5 P e a k a re a ( a .u .) 0 0.5 1 1.5 2 2.5 3 P e a k a re a ( a .u .) 0.02 0.04 0.06 0.08 P e a k a re a ( a .u .)BCl
3CH
4HBCl
2HCl
Fig. 6: Variations with temperature of the FTIR peak areas of the various gas species in the BCl3-CH4-H2 system, with (black triangles) and without (open squares) a porous substrate, at P = 2kPa, = 4, = 5 and Q = 250 sccm.
0
20
40
60
80
100
1000
1100
1200
1300
1400
H2
T (K)
Yie
ld (%)
CH
4H
2BCl
3HBCl
2HCl
H
2BCl
C
2H
2C
2H
4Fig. 7: Influence of the temperature on the calculated yields at homogeneous phase equilibrium in the BCl3-CH4-H2 system, at P = 10 kPa, = 2 and =2.
500
1000
1500
2000
2500
3000
3500
0
1
2
3
4
5
6
Abs
orban
ce
Wavenumber (cm
-1)
SiCl
4HBCl
2CH
4H
xSiCl
4-xMTS
BCl
3HCl
X10
CH
40 0 0.2 0.4 0.6 0.8 1 1.2 1.4 200 300 400 500 600 700 800 900 1000 T (°C) P e a k a re a ( a .u .) 0 1 2 3 4 5 6 7 P e a k a re a ( a .u .) 2 4 6 8 P e a k a re a ( a .u .) 5 10 15 20 25 30 P e a k a re a ( a .u .)
MTS
Chlorosilanes
SiCl
4CH
4 0 0.05 0.1 0.15 0.2 0.25 0.3 0.35 200 300 400 500 600 700 800 900 1000 T (°C) P e a k a re a ( a .u .) 0 10 20 30 40 P e a k a re a ( a .u .) 1 2 3 4 5 6 P e a k a re a ( a .u .)BCl
3HBCl
2HCl
(a)
(b)
(c)
(d)
(e)
(f)
(g)
0 0 0.2 0.4 0.6 0.8 1 1.2 1.4 200 300 400 500 600 700 800 900 1000 T (°C) P e a k a re a ( a .u .) 0 1 2 3 4 5 6 7 P e a k a re a ( a .u .) 2 4 6 8 P e a k a re a ( a .u .) 5 10 15 20 25 30 P e a k a re a ( a .u .)MTS
Chlorosilanes
SiCl
4CH
4 0 0 0.2 0.4 0.6 0.8 1 1.2 1.4 200 300 400 500 600 700 800 900 1000 T (°C) P e a k a re a ( a .u .) 0 1 2 3 4 5 6 7 P e a k a re a ( a .u .) 2 4 6 8 P e a k a re a ( a .u .) 5 10 15 20 25 30 P e a k a re a ( a .u .)MTS
Chlorosilanes
SiCl
4CH
4 0 0.05 0.1 0.15 0.2 0.25 0.3 0.35 200 300 400 500 600 700 800 900 1000 T (°C) P e a k a re a ( a .u .) 0 10 20 30 40 P e a k a re a ( a .u .) 1 2 3 4 5 6 P e a k a re a ( a .u .)BCl
3HBCl
2HCl
0 0.05 0.1 0.15 0.2 0.25 0.3 0.35 200 300 400 500 600 700 800 900 1000 T (°C) P e a k a re a ( a .u .) 0 10 20 30 40 P e a k a re a ( a .u .) 1 2 3 4 5 6 P e a k a re a ( a .u .)BCl
3HBCl
2HCl
(a)
(b)
(c)
(d)
(e)
(f)
(g)
Fig. 9: Variations with temperature of the FTIR peak areas of the various gas species in the BCl3-MTS-H2 system, with (black triangles) and without (open squares) a porous substrate, at P = 12kPa, = 12, =1 and Q = 420 sccm.
0 1 2 3 4 5
Chlorosilanes
SiCl
4 0 1 2 3 4 5 200 300 400 500 600 700 800 900 1000 T (°C) P e a k a re a ( a .u .) P e a k a re a ( a .u .) 0 1 2 3 4 5 0 1 2 3 4 5Chlorosilanes
SiCl
4 0 1 2 3 4 5 200 300 400 500 600 700 800 900 1000 T (°C) P e a k a re a ( a .u .) P e a k a re a ( a .u .)Fig. 10: Variations with temperature of the FTIR peak areas of chlorosilanes and SiCl4, with (dark triangles) and without (open squares) a porous substrate, at P = 12kPa, = 20, =0.3 and Q = 365 sccm.
(a)
0(b)
10 20 30 40 50 200 300 400 500 600 700 800 900 1000 T (°C) Peak are a ( a. u .) 0 10 20 30 40 50 200 300 400 500 600 700 800 900 1000 T (°C) Peak are a ( a. u .)HBCl
2HBCl
2 Q = 420 sccm Q = 175 sccm(a)
0(b)
10 20 30 40 50 200 300 400 500 600 700 800 900 1000 T (°C) Peak are a ( a. u .) 0 10 20 30 40 50 200 300 400 500 600 700 800 900 1000 T (°C) Peak are a ( a. u .)HBCl
2HBCl
2(a)
0(b)
10 20 30 40 50 200 300 400 500 600 700 800 900 1000 T (°C) Peak are a ( a. u .) 0 10 20 30 40 50 200 0 10 20 30 40 50 200 300 400 500 600 700 800 900 1000 T (°C) Peak are a ( a. u .)HBCl
2HBCl
2 Q = 420 sccm Q = 175 sccmFig. 11: Variations with temperature of the FTIR peak areas of HBCl2, with (dark triangles) and without (open squares) a porous substrate, at P = 12kPa, = 20, =0.3, for (a) Q = 420 sccm and (b) Q = 175 sccm.
200 300 400 500 600 700 800 900 1000 With BCl3(=12, =1) Without BCl 3(=12) 0 0.05 0.1 0.15 0.2 0.25 0.3 0.35 0.4 Peak are a ( a. u .) T (°C) 0 0.5 1 1.5 2 2.5 200 300 400 500 600 700 800 900 1000 With BCl 3(=12, =1) Without BCl 3(=12) T (°C) Peak are a ( a. u .)
CH
4SiCl
4 200 300 400 500 600 700 800 900 1000 With BCl3(=12, =1) Without BCl 3(=12) 0 0.05 0.1 0.15 0.2 0.25 0.3 0.35 0.4 Peak are a ( a. u .) T (°C) 0 0.5 1 1.5 2 2.5 200 300 400 500 600 700 800 900 1000 With BCl 3(=12, =1) Without BCl 3(=12) T (°C) Peak are a ( a. u .)CH
4SiCl
4Fig. 12: Variations with temperature of the FTIR peak areas of CH4 and SiCl4, at P = 5kPa, either with BCl3 (dark triangles, = 12, = 1 and Q = 245 sccm) or without BCl3 (open circles, = 12).
-2
0
2
4
6
0.7
0.75
0.8
0.85
0.9
0.95
1
=4
=5
=2
=5
=4
=2
=2
=2
1000/T (K
-1)
ln
R
(µ
g
cm
-2m
in
-1)
1000
900
800
T(°C)
1 2 3 4Q=250sccm
Q=390sccm
Q=390sccm
Q=210sccm
-2
0
2
4
6
0.7
0.75
0.8
0.85
0.9
0.95
1
=4
=5
=2
=5
=4
=2
=2
=2
1000/T (K
-1)
ln
R
(µ
g
cm
-2m
in
-1)
1000
900
800
T(°C)
1 2 3 4Q=250sccm
Q=390sccm
Q=390sccm
Q=210sccm
Fig. 13: Influence of the reciprocal temperature on the deposition rate (Arrhenius plot) in the BCl3-CH4-H2 system, at P = 12kPa and for the various compositions and flow rates of the gas phase.
-1
-0.5
0
0.5
1
1.5
2
2.5
3
0.7
0.75
0.8
0.85
0.9
0.95
1
1000/T (K
-1)
ln
R
(µ
g
cm
-2m
in
-1)
1000
900
800
T(°C)
=4
=5
-1
-0.5
0
0.5
1
1.5
2
2.5
3
0.7
0.75
0.8
0.85
0.9
0.95
1
1000/T (K
-1)
ln
R
(µ
g
cm
-2m
in
-1)
1000
900
800
T(°C)
=4
=5
Fig. 14: Influence of the reciprocal temperature on the deposition rate (Arrhenius plot) in the BCl3-CH4-H2 system, at P = 2 kPa and for = 4, = 5 and Q = 250 sccm.
-2 -1 0 1 2 3 4 5 6 0.7 0.75 0.8 0.85 0.9 0.95 1 1000 900 800 T°(C) 1100 ln R ( µ gcm -2 mi n -1 ) 1000/T (K-1) =12 =1 Q=420sccm =20 =0.3 Q=365sccm =12 =1 Q=175sccm -2 -1 0 1 2 3 4 5 6 0.7 0.75 0.8 0.85 0.9 0.95 1 1100 1000 900 800 T°(C) ln R ( µ gcm -2 mi n -1 ) 1000/T (K-1) =12 =1 Q=245sccm =20 =0.3 Q=243sccm -2 -1 0 1 2 3 4 5 6 0.7 0.75 0.8 0.85 0.9 0.95 1 1100 1000 900 800 T°(C) ln R ( µ gcm -2 mi n -1 ) 1000/T (K-1) =12 =1 Q=245sccm =20 =0.3 Q=243sccm (b) (a) (c) -2 -1 0 1 2 3 4 5 6 0.7 0.75 0.8 0.85 0.9 0.95 1 1000 900 800 T°(C) 1100 ln R ( µ gcm -2 mi n -1 ) 1000/T (K-1) =12 =1 Q=420sccm =20 =0.3 Q=365sccm =12 =1 Q=175sccm -2 -1 0 1 2 3 4 5 6 0.7 0.75 0.8 0.85 0.9 0.95 1 1100 1000 900 800 T°(C) ln R ( µ gcm -2 mi n -1 ) 1000/T (K-1) =12 =1 Q=245sccm =20 =0.3 Q=243sccm -2 -1 0 1 2 3 4 5 6 0.7 0.75 0.8 0.85 0.9 0.95 1 1100 1000 900 800 T°(C) ln R ( µ gcm -2 mi n -1 ) 1000/T (K-1) =12 =1 Q=245sccm =20 =0.3 Q=243sccm (b) (a) (c)
Fig. 15: Influence of the reciprocal temperature on the deposition rate (Arrhenius plots) in the BCl3-MTS-H2 system, for the various compositions and flow rates of the gas phase, at (a) P = 2kPa, (b) P = 5 kPa and (c) P = 12 kPa.
0 10 20 30 40 50 60 70 80 750 800 850 900 950 1000 1050 P=12kPa P=5kPa P=2kPa Conc entra tion (at.% ) T°(C)
Si
B
C
0 10 20 30 40 50 60 70 80 750 800 850 900 950 1000 1050 P=12kPa P=5kPa P=2kPa T°(C)Si
B
C
Conc entra tion (at.% )(b)
(a)
0 10 20 30 40 50 60 70 80 750 800 850 900 950 1000 1050 P=12kPa P=5kPa P=2kPa Conc entra tion (at.% ) T°(C)Si
B
C
0 10 20 30 40 50 60 70 80 750 800 850 900 950 1000 1050 P=12kPa P=5kPa P=2kPa T°(C)Si
B
C
Conc entra tion (at.% )(b)
(a)
Fig. 16: Variations with temperature of the elemental composition of the coatings deposited at various pressures and for (a) = 20, = 0.3, Q = 243 sccm (P = 2 and 5 kPa) or Q = 365 sccm (P = 12 kPa) and (b) = 12, = 1, Q = 245 sccm (P = 2 and 5 kPa) or Q = 420 sccm (P = 12 kPa).