HAL Id: hal-02294370
https://hal.archives-ouvertes.fr/hal-02294370
Submitted on 31 Oct 2019HAL is a multi-disciplinary open access
archive for the deposit and dissemination of sci-entific research documents, whether they are pub-lished or not. The documents may come from teaching and research institutions in France or abroad, or from public or private research centers.
L’archive ouverte pluridisciplinaire HAL, est destinée au dépôt et à la diffusion de documents scientifiques de niveau recherche, publiés ou non, émanant des établissements d’enseignement et de recherche français ou étrangers, des laboratoires publics ou privés.
Pr3+/Yb3+ fluorophosphate glasses: tuning visible
emission and energy transfer to Pr3+/Yb3+ ions
through excitation in different silver species
Tarcio Castro, Veronique Jubera, Hssen Fares, Yannick Petit, Alexandre
Fargues, Thierry Cardinal, Marcelo Nalin, Sidney Ribeiro
To cite this version:
Tarcio Castro, Veronique Jubera, Hssen Fares, Yannick Petit, Alexandre Fargues, et al.. Photolu-minescence of Ag+ and Ag m n+ in co-doped Pr3+/Yb3+ fluorophosphate glasses: tuning visible emission and energy transfer to Pr3+/Yb3+ ions through excitation in different silver species. Jour-nal of Materials Science: Materials in Electronics, Springer Verlag, 2019, 30 (18), pp.16878-16885. �10.1007/s10854-019-01530-7�. �hal-02294370�
Photoluminescence of Ag
+and Agm
n+in co-doped Pr
3+/Yb
3+fluorophosphate glasses: tuning visible emission and energy
transfer to Pr
3+/Yb
3+ions through excitation in different silver
species
Tarcio Castroa,b, Véronique Juberab, Hssen Faresa,b, Yannick Petitb,c, Alexandre
Farguesb, Thierry Cardinalb, Marcelo Nalina and Sidney Ribeiroa.
aInstitute of Chemistry - São Paulo State University - UNESP, CP 355, Araraquara, SP,
14800-060, Brazil.
bUniversity of Bordeaux, CNRS, ICMCB, UPR 9048, 87 avenue du Dr. A. Schweitzer, 33608
Pessac cedex, France.
cUniversity of Bordeaux, CNRS, CEA, CELIA, UMR 5107, 351 Cours de la Liberation, 33405
Talene Cedex, France.
Keywords: fluorophosphate glasses, rare earths, Ag nanoclusters and energy
transfer.
Abstract
Here, we report the luminescence properties of Yb3+/Pr3+ dual-doped
fluorophosphate glasses containing silver clusters. Through the solubility of silver into the glass system as function of its initial concentration, charged species
characterized as Ag+ and Ag
mn+ were formed and identified according to their
absorption and emission spectral responses. By changing the transition metal concentration, multi-energy transfer mechanisms were observed between silver
and Yb3+/Pr3+ co-doped glasses. The stabilization of silver species seems to be
detrimental to the radiative processes of the rare earth ions under excitation at
444 nm (Pr3+3H
4 → 3P0 absorption line). In other words, the main visible emissions
of Pr3+ and the NIR emission of Yb3+ decrease with increment of Ag
concentration. However, energy transfer occurs for large spectral range by the excitation of the silver species. In consequence, the visible and NIR emission could be activate in a broadband from ultraviolet to the blue part of the spectral region. These two observations highlight the competitive absorption processes
and probabilities between the cationic elements and the interest to use the transition metal species as sensitizers to excite the rare earth elements.
Introduction
Materials containing metal ions, such as silver have paved new advances in modern spectroscopy. Counting with the rich optical properties of silver nanoclusters and nanoparticles, new materials have been developed for numerous applications like solar cell efficiency enhancement [1], light frequency converter [2], white light generation [3,4] and others [5-7]. The large UV-Vis absorption and emission is ascribed to the evolution of certain charged and
uncharged silver species like, for example, Ag+, Ag0, and Ag
mn+ [8,9]. Agmn+
centers result from aggregation of y silver ions Ag+ and z silver atoms Ag0 forming
Agmn+ charged nanoclusters (m=y+z and n=y) [10]. Moreover, taking into account
the energy levels and the size of the Agmn+ species, broad absorption and
emission spectra can be observed [11,12], making such clusters suitable for
efficiently transfer energy to rare earth (RE) ions [13,14]. In one of the first
publication regarding NC’s-RE interaction, Tikhomirov et al., reported an energy
transfer (ET) between Agmn+ and Yb3+ in oxyfluoride glasses [15]. In that case,
the Yb3+ ions emission at 1000 nm was achieved by resonant and non-resonant
excitation in Agmn+. Huiyun Wang et al., studied a broadening excitation by
co-doping oxyfluoride glass resulting in a energy transfer Ag clusters → Yb3+ ions
and simultaneous energy transfer Ag clusters → Eu3+ → Yb3+. Recently, Zhuang
Guo et al., proved that Agmn+ is an efficient broadband sensitizer for Sm3+ ions in
the visible range [16] via energy transfer Ag clusters → Sm3+. From these studies
we conclude that RE3+ energy levels may be assessed via Ag clusters energy
transfer.
Size-dependent of the Agmn+ species have been investigated in different
glass hosts. Previous publications indicate that many factors might affect the size distribution of Ag species, such as heat treatment, Ag concentration, glass network changes and RE doping [17-20]. Concomitantly, in a system that
presents rare earth ions, Agmn+ may benefit ET interactions in such a way that
visible and near-infrared emissions of RE3+ ions may be sensitized and enhanced
cross-section of the RE3+ small. On the other hand, the presence of Ag entities
can boost the absorption efficiency, in this sense an efficient interaction among
RE and Agmn+ can globally enhance the luminescence [23].
In this work, fluorophosphate glasses with molar composition 30NaPO3
-30MgF2-30BaF2-10YF3 were prepared via melt-quenching method by co-doping
with Pr3+/Yb3+ and different silver contents. We investigate the luminescence
properties of the Pr3+/Yb3+ ions as a function of the silver concentration. In
addition, the broadband excitation and emission of the Ag species were studied as well as their interaction with rare earth ions.
2. Experimental section 2.1 Glass preparation
The glass samples were prepared by the melt-quenching method with the
following chemical batch composition (mol %): (29-x) NaPO3–30MgF2–30BaF2–
10YF3–0.5Pr2O3-0.5YbF3 – xAgNO3 (x = 0, 2 and 10)with, approximately, 5 g to
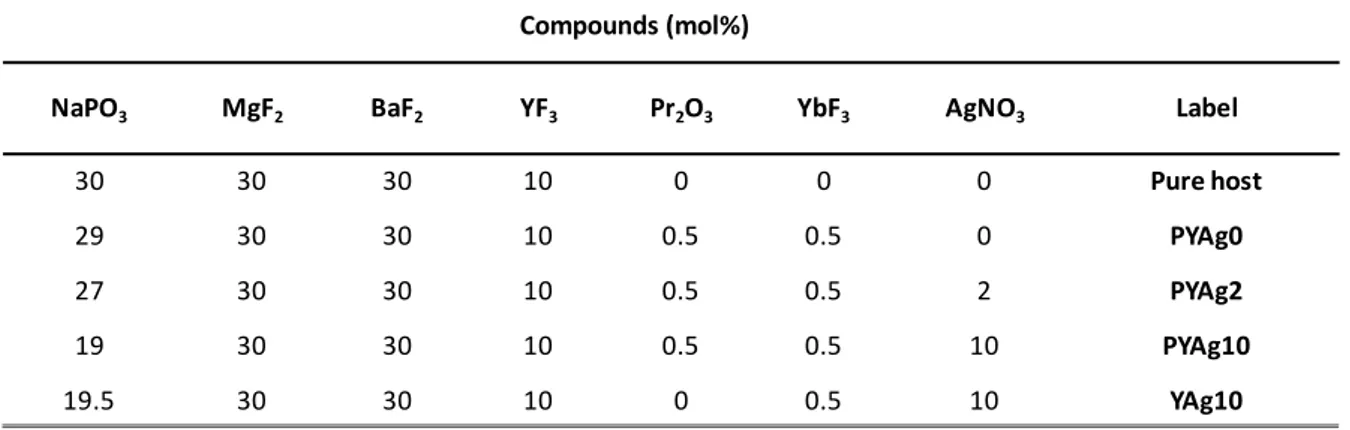
each. All compounds used were 99.9 % purity (Sigma Aldrich). The raw materials were thoroughly mixed in a speed mixer with 1000 rpm, transferred to an alumina crucible and melted at 800 °C for 30 min in ambient atmosphere to eliminate nitrates and have a homogeneous liquid. The melt was poured onto a stainless-steel mold, preheated at 340 °C and kept at this temperature for 2 h to reduce mechanical stress due to the fast cooling. Table 1 summarizes the sample
compositions: the amount of Pr2O3 and YbF3 raw materials introduced were fixed
at 0.5 mol% and AgNO3 concentration between 0 and 10 mol % resulting from
the AgNO3 introduced in the batch. To verify the effect of silver ions in the
emission and excitation spectrum, a sample without silver was prepared. Still, for
comparison, a sample without Pr3+ ions was also prepared to evidence the energy
transfer from the silver species present in the glass network (Agmn+ and Ag+) to
Table 1. Molar compositions of the raw materials and samples label.
2.2 Characterizations
Absorption spectra were recorded using a Carry 5000 Spectrometer (Varian) double-beam coupled with resolution of 1 nm. The excitation and emission spectra were collected in a Horiba Jobin Yvon Fluorolog 3 equipped with Xenon lamp (450 W), an InGaAs detector and a photomultiplier tube (PMT - Hamamatsu R298) for the infrared detection and visible signal, respectively. All measurements were performed at room temperature and the samples were grinded in order to avoid re-absorption process. Emission spectra were corrected from the lamp intensity variation, configuration geometry and detectors sensitivity.
3. Results and discussions 3.1 Absorption Spectra
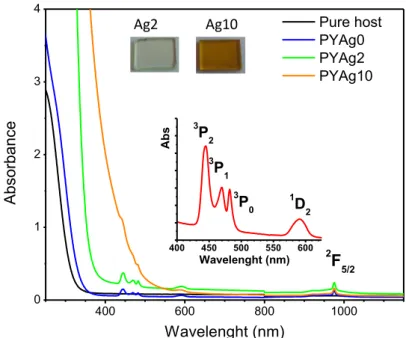
The absorption spectra of the prepared samples are depicted in Figure 1. The non-doped matrix absorption spectrum (black line) is illustrated to discriminate the rare earth and silver absorption. The PYAg0 curve clearly evidenced the
insertion of Pr3+ and Yb3+ ions in the glass. Pr3+ doped glass shows four groups
of lines ranging from 400 to 650 nm attributed to 4f-4f absorption lines, which are
emphasized on the inset graph. These peaks correspond to the 3H4→ 3P2, 3P1,
3P
0 and 1D2 excited states transitions and are located at 445, 469, 482 and
580-610 nm respectively. The Yb3+ (2F7/2 → 2F5/2) absorption lines are visible at around
980 nm. As compared to the reference (pure host), no real influence of the rare earth doping is evidenced at high energy as the charge transfer band (CTB)
Compounds (mol%)
NaPO3 MgF2 BaF2 YF3 Pr2O3 YbF3 AgNO3 Label
30 30 30 10 0 0 0 Pure host
29 30 30 10 0.5 0.5 0 PYAg0
27 30 30 10 0.5 0.5 2 PYAg2
19 30 30 10 0.5 0.5 10 PYAg10
between Yb3+ and the ligands or the 4f-5d absorption band of Pr3+ are both
expected at smaller wavelength than the absorption threshold observed. The cut-off from the pure host (black line) starts in 300 nm, and this limit is shifted to longer wavelengths when the concentration of silver amounts increases. For the highest silver concentration, the absorption due to silver species clearly overlaps
the absorption lines of the Pr3+ ions. Their contribution appears as shoulder on
the curves. In addition, a higher silver concentration reduces the transparency in the visible due to the brown color of the samples (see inset digital pictures in Figure 1). This color is attributed to the increases of particle size as a function of Ag amount (Ag NC’s aggregate and tend to adopt a metallic behavior) and/or to the formation of Ag NP’s [25].
Figure 1. Absorption spectra of the pure host (black line), co-doped with Pr3+/Yb3+
and different silver amount. The inset shows Pr3+ absorption lines in the visible
range for the sample PYAg0 (without silver oxide introduced) and the digital pictures show the change in color as a function of the Ag content.
3.2 Spectroscopic Results
In order to evaluate the spectroscopic properties of Ag+ and Ag
mn+ species and
their interaction with the rare earth ions, we dedicated a deeper attention to the photoluminescent properties. 400 600 800 1000 0 1 2 3 4 1 D2 3 P0 3 P1 Pure host PYAg0 PYAg2 PYAg10 Abs orbanc e Wavelenght (nm) 3 P2 2 F5/2 400 450 500 550 600 A b s Wavelenght (nm) Ag2 Ag10
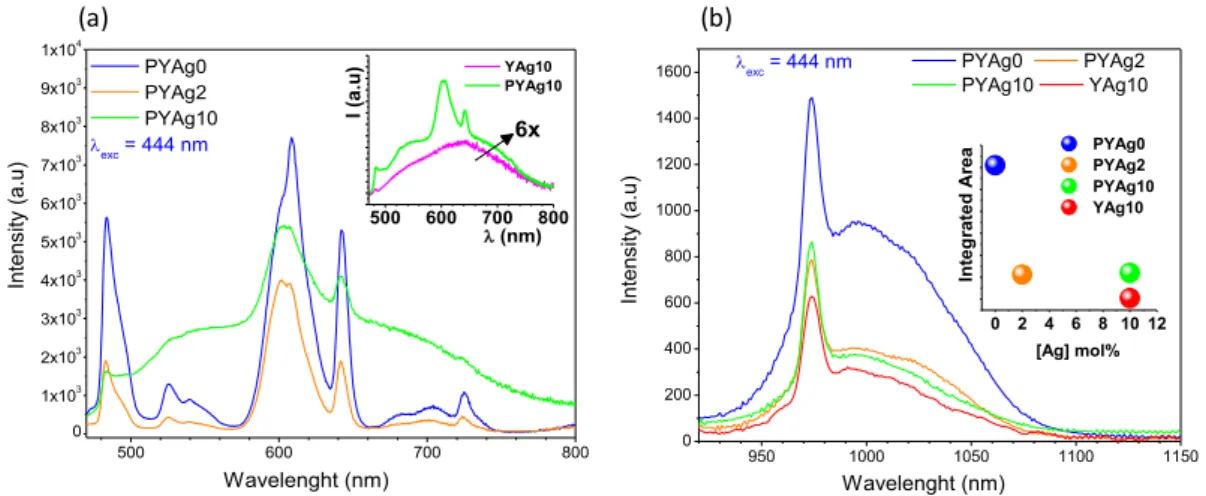
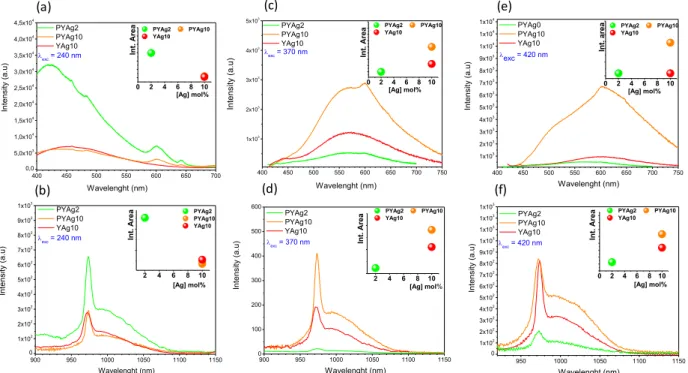
First, the emission spectra collected for excitation at 444 nm wavelength
associated to Pr3+ ions 3H4 → 3P2 transition are illustrated for the different samples
in Figure 2.
Figure 2. Emission curves of PYAgx glasses (x= 0, 2, 10) under excitation at 444 nm
in the 3P2 level of Pr3+ ions. a) The acquisition in the visible range shows the
contribution of silver species in addition to Pr3+ lines; b) Luminescence of Yb3+ ions
is clearly detected in the infrared range at around 1000 nm.
Under such an excitation (Pr3+: 3H
4 → 3P2), the radiative de-excitation from
3P
0 Pr3+ level is clearly detected in the visible range (Figure 2a). The main
emissions are centered at around 486 nm, 580-620 nm and 700 nm, which
correspond to the radiative transitions 3P
0 → 3H4, 1D2→ 3H4, 3P0 → 3H6 and 3P0 → 3F
2, respectively. The nature of the emitting levels of Pr3+ strongly depends on
the phonons energy of the host. Radiative de-excitation from 1D
2 level were
reported in fluorophosphates [25], fluoroindate glasses [26], lead borate [27] glasses, as well as, oxyfluoride silicate glass–ceramics [28], whereas this level
relaxes non radiatively down to the 1G
4 level in ZBLAN glass [29]. With the
addition of silver ions, the Pr3+ emissions decrease in intensity and a broadband
rises, covering the region between 480 and 800 nm. The quenching of the green
emission (3P
0 → 3H4) is more accentuated compared to the red one (overlap
between 1D
2 → 3H4 and 3P0 → 3H6 lines). For the silver containing sample with
x=10, the 486 nm green line almost disappeared. The persistence of a red component seems to confirm that, in the proposed materials, the potential
de-500 600 700 800 0 1x10³ 2x10³ 3x10³ 4x10³ 5x10³ 6x10³ 7x10³ 8x10³ 9x10³ 1x10⁴ Int ens ity (a. u) Wavelenght (nm) PYAg0 PYAg2 PYAg10 exc = 444 nm 500 600 700 800 YAg10 PYAg10 I ( a.u) (nm) 6x (a) (b) 950 1000 1050 1100 1150 0 200 400 600 800 1000 1200 1400 1600 0 2 4 6 8 10 12 Int ens ity (a. u) Wavelenght (nm) PYAg0 PYAg2 PYAg10 YAg10 exc = 444 nm PYAg0 PYAg2 PYAg10 YAg10 In teg rat ed Ar ea [Ag] mol%
excitation from 1D
2 to 1G4 level, if existing, is limited. For comparison, the inset of
the Figure 2a shows the emission of the sample for x=10 without Pr3+ ions (pink
line) under the same excitation (444 nm); in this case, we can see a wide emission that is similar to the rare earth co-doped sample containing silver (x=10).
Second, the excitation at 444 nm makes also possible the observation of
the Yb3+2F5/2 → 2F7/2 transition, pointing out energy transfer from Pr3+ ions to the
Yb3+ ions. Several mechanisms can be proposed to illustrate such energy
transfer. (1) A cross-relaxation between the 3P0 → 1G4 Pr3+ transition and the 2F7/2
→ 2F5/2 transition of Yb3+ ions. This is followed by a multiphonon relaxation from
1G
4 down to lower energy levels and a radiative de-excitation of one Yb3+ excited
from the 2F
5/2 level. (2) Another potential mechanism could be a resonant
two-step energy transfer: the cross-relaxation process proposed before could be
followed by a second transfer step involving the 1G
4 → 3H4 Pr3+ line and 2F7/2 → 2F
5/2 absorption. This second scheme should make possible the emission of two
photons at around 1 micron. (3) A third cross relaxation process could occur
between the 1D
2 → 3F4 transition of Pr3+ and 2F7/2 → 2F5/2 transition of Yb3+ ions.
In this case, the excited Yb3+ ion relaxes radiatively by emitting one photon and
the 3F
4 → Pr3+ level implies multiphonon de-excitation mechanism. (4) Depending
on the system and concentration, back energy transfer from Yb3+ to 1G
4 level of
Pr3+ can be observed [26,29,30]. These mechanisms may be easily accessed in
the Figure 6.
Under a 444 nm excitation, the intensity of the infrared emission is strongly affected by the introduction of silver in the glass composition (the integrated intensity as function of silver content is reported in the inset of Figure 2b). However, energy transfer from praseodymium ions seems to compete with a
potential back transfer from Yb3+ ions to other ions: the intensity of PYAg10 is
superior to that of YAg10 sample (Figure 2b).
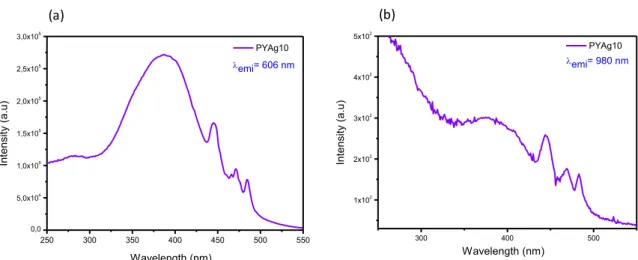
Excitation spectra performed for the most intense lines of Pr3+ (λem =
606 nm) and Yb3+ (λ
em = 980 nm) ions are illustrated in Figure 3a and 3b
respectively. In addition to the Pr3+ absorption lines (lines peaking at 445, 469,
482 and 580-610 nm, see also Figure 1), the broadband ranging between 250 to 500 nm (Figure 3a), is attributed to silver species. This overlapping of silver and
praseodymium excitation bands is a clear evidence of energy transfer between
the Pr3+ ions and silver species. Broad excitation bands between 250 to 500 nm
(Figure 3b) are also detected in the excitation spectrum of Yb3+ ions, showing the
energy transfer pathway to this rare earth element.
Figure 3. Excitation spectra of the sample PYAg10 with emission fixed at 606 and 980 nm.
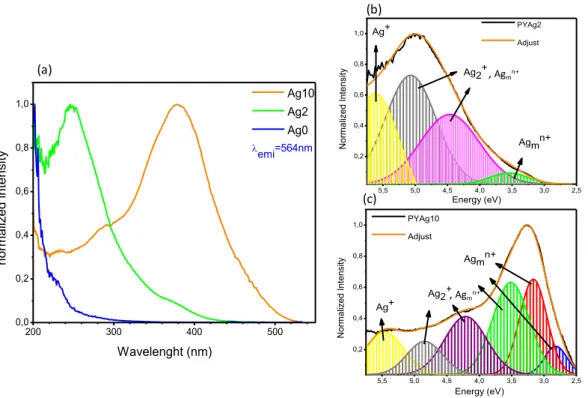
To discriminate the contribution of rare earth elements from that of silver species, excitation spectra were collected for a fixed emission wavelength at
564 nm for which no emission from Pr3+ ions is observed. The corresponding
spectra obtained for different silver content are illustrated in the Figure 4.
250 300 350 400 450 500 550 0,0 5,0x10⁴ 1,0x10⁵ 1,5x10⁵ 2,0x10⁵ 2,5x10⁵ 3,0x10⁵ Int ens ity (a. u) Wavelength (nm) PYAg10 emi= 606 nm 300 400 500 1x10² 2x10² 3x10² 4x10² 5x10² Int ens ity (a. u) Wavelength (nm) PYAg10 emi= 980 nm (a) (b)
Figure 4. Excitation spectra of PYAgx glasses (x= 0, 2, 10) for an emission
wavelength fixed at 564 nm (a). Deconvolutions of the excitation bands for the samples PYAg2 (b) and PYAg10 (c).
The excitation curves revealed different bands. The relative intensity of
these bands is modulated with the silver concentration meaning that the PYAgx
glasses stabilize several species of silver depending on the silver concentration introduced and are assigned to various silver species. The spectral signature depends on the ion distribution, as well as the local environment around the silver species [26]. The deconvolution spectra point an absorption band at 230 nm (5.5
eV) that can be attributed to Ag+ ions [31]. The bands ranging from 250 nm to
310 nm (≈5.2eV - 4eV) overlap the absorption of silver pairs (Ag+)2 and Agmn+
silver clusters whereas the band peaking at the lowest energy could be
compatible to the stabilization of Agmn+ clusters [31-33]. The noticeable number
of silver species indicates a low dispersion of Ag in this glass system with silver aggregation starting for x = 2. In this concentration, two main excitation bands
are observed around 250 nm and 280 nm, whose are assigned to the 3D
1 → 1S0
Ag+ transition [27]. Still, for 2 mol% the formation of Ag
mn+ start to be relevant.
One can notice a weak excitation band at around 370 nm which is attributed to
5,5 5,0 4,5 4,0 3,5 3,0 2,5 0,2 0,4 0,6 0,8 1,0 Energy (eV) Agmn+ Ag2+ Ag+ N orm aliz ed Int ens ity PYAg10 Adjust 5,5 5,0 4,5 4,0 3,5 3,0 2,5 0,2 0,4 0,6 0,8 1,0 Agmn+ Ag2+ PYAg2 Adjust N orm aliz ed Int ens ity Energy (eV) Ag+ 200 300 400 500 0,0 0,2 0,4 0,6 0,8 1,0 emi=564nm Ag10 Ag2 Ag0 norm aliz ed int ens ity Wavelenght (nm) (a) (b) (c) , Agmn+ , Agmn+
Agmn+ species. In relative intensity the excitation band attributed to Ag+ is not
dominant for x=10.
Figure 5 shows the emission spectra of the samples with different excitation wavelengths in agreement with the deconvolution proposed in Figure 4: 240 nm, 370 nm and 420 nm excitation wavelengths. Visible emissions are shown on the up side (5a, 5c and 5e) and the near-infrared on the bottom (5b, 5d and 5f). In the visible range, the main emission is due to contribution of the silver
species (Ag+ and Agmn+). The excitation at 240 nm results in a large band located
at around 400 nm. For such an excitation, a decrease of the emission intensity is observed with the increase of silver content. The 370 nm and 420 nm excitations give rise to two bands peaking at 500 nm and 650 nm, respectively. The intensity of these two contributions clearly increases with the silver content in a good coherence with the evolution of the silver species nature stabilized in the glasses.
In addition, a weak contribution of Pr3+ ions is also visible and the Yb3+ 2F
5/2 →
2F7/2 transitions are detected in the infrared. In our case, if we cannot totally
discard the existence of silver metallic nanoparticles, an effect of the surface plasmon resonance is not expected. Still, our investigation also tends to
emphasize that the Pr3+ and Yb3+ emission is observed by direct excitation of
silver species, although a small emission is observed at around 600 nm, which
corresponds to the Pr3+ transition (1D
2 → 3H4).Thus, emissions from silver species
become an interesting channel to excite the rare earth cations. For the sake of brevity, we present here only results from three excitation wavelengths (240 nm, 370 nm and 420 nm). However, the rare earth ions luminescence can be detected
when the excitation is carried out in a wide range of the Ag+ and Ag
mn+ response
(270 nm to 420 nm). The Yb3+ ions emission is also visible in the Pr3+ free sample
(red line in Figures 5b, 5d and 5f). This Ag+, Ag
mn+→ Yb3+ energy transfer was
also reported for oxyfluoride system [33]. For the Yb3+ emission the 5 → 1 zero
phonon line is clearly visible whereas the other components related to the
radiative de-excitation from the lowest Stark component of the 2F
5/2 level down to
the fundamental multiplet (Transitions 5 → 2, 3, 4) are merged into a large band
as observed previously for the excitation at 444 nm in the Pr3+ ions absorption.
The inset graphics from the Figure 5 show the integrated intensities of the
dominant specie (sample PYAg2), an excitation at 240 nm leads to a more
efficient energy transfer to the Pr3+ and Yb3+ cations for the lowest silver content
glasses: Ag+ and rare earth ions emissions decrease with the increase of silver
content in the glass (Figures 5a and 5b). This observation is consistent with the
decrease in concentration of isolated silver ions Ag+ in the glass for high silver
loading. However, the rare earth cations emission increases with the silver content for excitations above 300 nm corresponding to the excitation wavelength
range of the Agmn+ species (Figures 5c, 5d, 5e and 5f).
For an excitation at 444 nm corresponds to both an absorption of the Pr3+
lines and the Agmn+ species (Figure 3b). The competitive absorption affects the
emission intensity of the rare earth and the transfer from Pr3+ ions to Yb3+ ions.
Figure 5. Emission spectra in the visible range (a, c and e) and near-infrared (b, d and f) performed under excitation in silver species. The broadband visible
emissions characterizes the Ag and Agmn+ species and an ET is observed by the
weak emission of Pr3+ at around 600 nm.
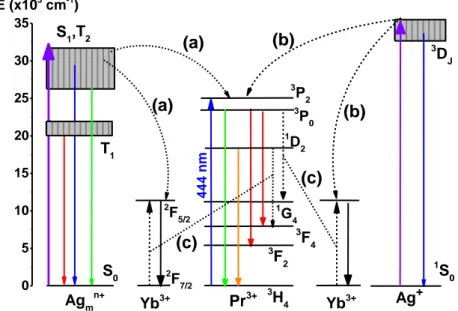
Finally, different energy mechanisms can be proposed as function of the silver species nature. Figure 6 shows the partial diagram of energy levels of the
400 450 500 550 600 650 700 750 1x10³ 2x10³ 3x10³ 4x10³ 5x10³ 6x10³ 7x10³ 8x10³ 9x10³ 1x10⁴ 1x10⁴ 1x10⁴ Wavelenght (nm) Int ens ity (a. u) PYAg0 PYAg10 YAg10 exc = 420 nm 0 2 4 6 8 10 PYAg2 PYAg10 YAg10 Int . are a [Ag] mol% 400 450 500 550 600 650 700 750 1x10³ 2x10³ 3x10³ 4x10³ 5x10³ PYAg2 PYAg10 YAg10 exc = 370 nm In te ns ity ( a.u ) Wavelenght (nm) 0 2 4 6 8 10 PYAg2 PYAg10 YAg10 Int . A rea [Ag] mol% 400 450 500 550 600 650 700 0,0 5,0x10³ 1,0x10⁴ 1,5x10⁴ 2,0x10⁴ 2,5x10⁴ 3,0x10⁴ 3,5x10⁴ 4,0x10⁴ 4,5x10⁴ exc = 240 nm PYAg2 PYAg10 YAg10 In te n sity (a. u ) Wavelenght (nm) 0 2 4 6 8 10 PYAg2 PYAg10 YAg10 Int . A rea [Ag] mol% 900 950 1000 1050 1100 1150 0 1x10² 2x10² 3x10² 4x10² 5x10² 6x10² 7x10² 8x10² 9x10² 1x10³ Wavelenght (nm) PYAg2 PYAg10 YAg10 In te n sity (a. u ) exc = 240 nm 2 4 6 8 10 PYAg2 PYAg10 YAg10 Int . A rea [Ag] mol% 900 950 1000 1050 1100 1150 0 100 200 300 400 500 600 Wavelenght (nm) In te nsity (a. u) PYAg2 PYAg10 YAg10 exc = 370 nm 2 4 6 8 10 PYAg2 PYAg10 YAg10 Int . A rea [Ag] mol% 950 1000 1050 1100 1150 0 1x10² 2x10² 3x10² 4x10² 5x10² 6x10² 7x10² 8x10² 9x10² 1x10³ 1x10³ 1x10³ 1x10³ Wavelenght (nm) I nt ens ity (a. u) PYAg2 PYAg10 YAg10 exc = 420 nm 0 2 4 6 8 10 PYAg2 PYAg10 YAg10 Int . A rea [Ag] mol% (a) (c) (e) (b) (d) (f)
Pr3+/Yb3+ co-doped samples and containing Ag+ and Ag
mn+ species accordingly
with the energy diagram proposed by Velazquez et al.[34].
3 DJ Ag+ 1 S0 Yb3+ S1,T2 T1 S0 1 G4 3 P0 3 P 2 1 D 2 3 F4 3 F2 3 H4 2 F5/2 Pr3+ Yb3+ 2 F7/2 Agmn+ E (x103 cm-1) 4 4 4 n m (c) (c) (b) (b) (a) (a) 0 5 10 15 20 25 30 35
Figure 6. Partial diagram of energy levels of co-doped Pr3+/Yb3+, Ag+ and Agmn+
in fluorophosphate glass; a and b denote energy transfer and c, cross relaxation.
The blue, green and red emission rise respectively from the radiative
transitions of the excited states S1, T2 and T1 to the ground state S0 in the Agmn+
clusters [14,35]. The energy states of the silver nanoclusters vary significantly
due to the non-shielded 3d orbitals. Thus, the Agmn+ may be excited in a broad
range of the UV light and part of the visible radiation, from 240 nm up to 444 nm.
In contrast, the 4f energy levels of the Pr3+ and Yb3+ result from weak interactions
with the closest neighbor in the glass network. Upon 444 nm excitation, the Pr3+
ions excite electrons from the ground state 3H4 to the excited states 3P2, 3P1, 1I6,
3P0 and 1D2. The excited state of the Yb3+ can be activated by energy transfer
from the Ag+ and Ag
mn+ species or by cross relaxation between the Pr3+ and Yb3+
4. Conclusions
In summary, silver containing fluorophosphate glasses co-doped with Pr3+/Yb3+
were prepared by the melting quenching method. Different silver species from silver ions to silver clusters were obtained depending on the silver amount introduced. Energy transfers have been evidenced between the silver species and the rare earth ions. Thanks to the absorption of the silver species, a broad
band in the visible range become accessible for the excitation Pr3+ and Yb3+ rare
earth ions. At short wavelength excitation (240 nm) the Ag+ ions response
predominates under the visible and NIR emission from the Pr3+ and Yb3+ ions,
respectively. At this excitation the increment of the Ag concentration leads to a quenching of the rare earths luminescence. However, for longer wavelength (> 370 nm) the rare earths ions emissions become more evident and increase with
the Ag increment. This approach point out hopeful perspectives to explore a new
approach for down-conversion layers and phosphors.
Acknowledgments
The authors are grateful for the financial support from the Brazilian agencies CAPES, CNPq, grants numbers #2018/09296-3, #2016/16343-2 and
#2013/07793-6, São Paulo Research Foundation – FAPESP and the French
agencies CNRS, the Cluster of Excellence LAPHIA (ANR-10-IDEX-03-02) and
the Region “Nouvelle Aquitaine” in the frame of the FabMat project
(2016-1R10107).
References
1. F. Enrichi, C. Armellini, G. Battaglin, F. Belluomo, S. Belmokhtar, A. Bouajaj, E. Cattaruzza, M. Ferrari, F. Gonella, A. Lukowiak, M. Mardegan, S. Polizzi, E. Pontoglio, G.C. Righini, C. Sada, E. Trave, L. Zur, Opt. Mater. 60, 249–269 (2016).
2. Ronghua Ma, Jiangyun Qian, Shuo Cui, Xvsheng Qiao, Feng Wang, Xianping Fan, J. Lumin. 152, 222–225 (2014).
3. Ronghua Ma, Jun Gao, Xu Qian, Shuo Cui, Xvsheng Qiao, Du Jincheng, Xianping Fan, J. Non-Cryst. Solids 432, 348–353, (2016).
4. J.J. Li, J.D. Chen, R.F. Wei, H. Guo, J. Am. Ceram. Soc. 95, 1208–1211, (2012).
5. J.-C. Desmoulin, Y. Petit, L. Canioni, M. Dussauze, M. Lahaye, H.M. Gonzalez, E. Brasselet, T. Cardinal, J. Appl. Phys. 118, 213104 (2015).
6. A. Khalil, J.-P. Bérubé, S. Danto, J.-C. Desmoulin, T. Cardinal, Y. Petit, R. Vallée, L. Canioni, Sci Rep 7, 1–9, (2017).
7. A.S. Kuznetsov, V.K. Tikhomirov, M.V. Shestakov, V.V. Moshchalkov, Nanoscale 5, 10065–10075, (2013).
8. Song Ye, Zhuang Guo, Huiyun Wang, Song Li, Tianhua Liu, Deping Wang, J. Alloy. Compd. 685, 891–895, (2016).
9. Sungmoon Choi, Robert M. Dickson, Yu. Junhua, Chem. Soc. Rev. 41, 1867– 1891, (2012).
10. I. Diez, R.H.A. Ras, Nanoscale 3, 1963–1970, (2011). 11. W.P. Halperin, Rev. Mod. Phys. 58, 533–606, (1986).
12. Zhuang Guo, Song Ye, Xvsheng Qiao, Deping Wang, J. Am. Ceram. Soc. 00, 1–7, (2017).
13. D. Rajesh, R.J. Amjad, M. Reza Dousti, A.S.S. de Camargo, Journal of Alloys Compounds. 695, 607–612, (2017).
14. José A. Jiménez, J. Inorg. Organomet. Polym Mater. 27, 372–379, (2017). 15. V.K. Tikhomirov, V.D. Rodríguez, A. Kuznetsov, D. Kirilenko, G. Van Tendeloo, V.V. Moshchalkov, Opt. Express 21, 22032–22040, (2010).
16. Zhuang Guo, Song Ye, Tianhua Liu, Song Li, Deping Wang, J. Non-Cryst. Solids 458, 80–85, (2017).
17. V.D. Dubrovin, Opt. Mater. 36, 753–759 (2014)
18. A.S. Kuznetsov, N.T. Cuong, V.K. Tikhomirov, M. Jivanescu, A. Stesmans, L.F. Chibotaru, J.J. Velázquez, V.D. Rodríguez, D. Kirilenko, G. Van Tendeloo, V.V. Moshchalkov, Opt. Mater. 34, 616–621, (2012).
19. Ronghua Ma, Junjie Zhao, Xiaotong Chen, Xvsheng Qiao, Xianping Fan, Du Jincheng, Xianghua Zhang, Phys. Chem. Chem. Phys. 19, 22638–22645, (2017). 20. Qing Jiao, Jianbei Qiu, Dacheng Zhou, Xu Xuhui, Mater. Res. Bull. 51, 315– 319, (2014).
21. Longji Li, Yong Yang, Dacheng Zhou, Zhengwen Yang, Xu Xuhui, Jianbei Qiu, Opt. Mater. Express 6, 806–812, (2013).
22. Wu Yi, Xiang Shen, Shixun Dai, Xu Yinsheng, Feifei Chen, Changgui Lin, Xu Tiefeng, Qiuhua Nie et al., J. Phys. Chem. C 115, 25040–25045, (2011).
23. RongFei Wei, JingJing Li, JiaYu. Gao, Hai Guo, J. Am. Ceram. Soc. 95, 3380–3382, (2012).
24. M.C. Mathpal, P. Kumar, S. Kumar, A.K. Tripathi, M.K. Singh, J. Prakash, A. Agarwal, RSC Adv. 5, 12555–12562, (2015).
25. S. Babu, P. Rajput, Y.C. Ratnakaram, J. Mater. Sci. 51, 8037–8054, (2016). 26. L.J. Borrero-González, G. Galleani, D. Manzani, L.A.O. Nunes, S.J.L. Ribeiro, Opt. Mater. 35, 2085–2089, (2013).
27. D. Serrano, A. Braud, J.L. Doualan, P. Camy, A. Benayad, V. Ménard, R. Moncorgé, Opt. Mater. 33, 1602–1606, (2011).
28. Gu Mu, Qing-Chun Gao, Shi-Ming Huang, Xiao-Lin Liu, Bo Liu, Chen Ni, J. Lumin. 132, 2531–2536, (2012).
29. L.J. Borrero-González, L.A.O. Nunes, J.L. Carmo, F.B.G. Astrath, M.L. Baesso, J. Lumin. 145, 615–619, (2014).
30. Hongli Wen, Peter A. Tanner, Opt. Mater. 33, 1602–1606, (2011).
31. T. Guérineau, L. Loi, Y. Petit, S. Danto, A. Fargues, L. Canioni, T. Cardinal, Opt. Mater. Express 8, 3748–3760, (2018).
32. N. Marquestaut, Y. Petit, A. Royon, P. Mounaix, T. Cardinal, L. Canioni, Adv. Func. Mater. 24, 5824–5832, (2014).
33. V.K. Tikhomirov, T. Vosch, E. Fron, V.D. Rodríguez, J.J. Velázquez, D. Kirilenko, G. Van Tendeloo, J. Hofkens, M. Van der Auweraer, V.V. Moshchalkov, RSC Adv. 2, 1496–1501, (2012).
34. J.J. Velázquez, V.K. Tikhomirov, L.F. Chibotaru, N.T. Cuong, A.S. Kuznetsov, V.D. Rodríguez, M.T. Nguyen, V.V. Moshchalkov, Opt. Express 12, 13582– 13591, (2012).