HAL Id: hal-00808990
https://hal.inria.fr/hal-00808990
Submitted on 8 Apr 2013
HAL is a multi-disciplinary open access archive for the deposit and dissemination of sci-entific research documents, whether they are pub-lished or not. The documents may come from teaching and research institutions in France or abroad, or from public or private research centers.
L’archive ouverte pluridisciplinaire HAL, est destinée au dépôt et à la diffusion de documents scientifiques de niveau recherche, publiés ou non, émanant des établissements d’enseignement et de recherche français ou étrangers, des laboratoires publics ou privés.
Alzheimer’s disease and mild cognitive impairment using
information and communication technology
Guillaume Sacco, Véronique Joumier, Darmon Nelly, Deschamps Arnaud,
Alexandre Derreumaux, Ji-Hyun Lee, Piano Julie, Nathalie Bordone,
Alexandra Konig, Bernard Teboul, et al.
To cite this version:
Guillaume Sacco, Véronique Joumier, Darmon Nelly, Deschamps Arnaud, Alexandre Derreumaux, et al.. Detection of activities of daily living impairment in Alzheimer’s disease and mild cognitive impairment using information and communication technology. Clinical Interventions in Aging, Dove Medical Press, 2012, 2012:7, pp.539 - 549. �10.2147/CIA.S36297�. �hal-00808990�
Clinical Interventions in Aging
Detection of activities of daily living impairment
in Alzheimer’s disease and mild cognitive impairment
using information and communication technology
Guillaume Sacco1–3 Véronique Joumier1,4 Nelly Darmon1 Arnaud Dechamps1,5 Alexandre Derreumaux1,3 Ji-Hyun Lee2 Julie Piano2 Nathalie Bordone2 Alexandra Konig1,6 Bernard Teboul3 Renaud David1,2 Olivier Guerin1,3 François Bremond1,4 Philippe Robert1,2 1EA CoBTeK, Université de Nice
Sophia-Antipolis, 2Centre Mémoire
de Ressource et de Recherche, CHU de Nice, 3Plateforme Patient du
Centre d’Innovation et d’Usage en Santé, CHU de Nice, 4Equipe Stars,
Institut National de Recherche en Informatique et en Automatique (INRIA), Sophia-Antipolis, France;
5University of Pancasila, Department
of Psychology, Jakarta, Indonesia;
6University of Maastricht, Faculty of
Psychology and Neuropsychology, Department of Psychiatry and Neuropsychology, Maastricht, The Netherlands
Correspondence: Guillaume Sacco Centre Mémoire de Ressources et de Recherche, Hôpital de Cimiez, 4 Avenue Reine Victoria, Pavillon Mossa, 06000 Nice, France Tel +33 609733254
Email sacco.g@chu-nice.fr
Background: One of the key clinical features of Alzheimer’s disease (AD) is impairment
in daily functioning. Patients with mild cognitive impairment (MCI) also commonly have mild problems performing complex tasks. Information and communication technology (ICT), particularly techniques involving imaging and video processing, is of interest in order to improve assessment. The overall aim of this study is to demonstrate that it is possible using a video monitoring system to obtain a quantifiable assessment of instrumental activities of daily living (IADLs) in AD and in MCI.
Methods: The aim of the study is to propose a daily activity scenario (DAS) score that detects
functional impairment using ICTs in AD and MCI compared with normal control group (NC). Sixty-four participants over 65 years old were included: 16 AD matched with 10 NC for protocol 1 (P1) and 19 MCI matched with 19 NC for protocol 2 (P2). Each participant was asked to undertake a set of daily tasks in the setting of a “smart home” equipped with two video cameras and everyday objects for use in activities of daily living (8 IADLs for P1 and 11 for P2, plus 4 temporal execution constraints). The DAS score was then computed from quantitative and qualitative parameters collected from video recordings.
Results: In P1, the DAS score differentiated AD (DASAD,P1 = 0.47, 95% confidence interval [CI]
0.38–0.56) from NC (DASNC,P1 = 0.71, 95% CI 0.68–0.74). In P2, the DAS score differentiated MCI (DASMCI,P2 = 0.11, 95% CI 0.05–0.16) and NC (DASNC,P2 = 0.36, 95% CI 0.26–0.45). Conclusion: In conclusion, this study outlines the interest of a novel tool coming from the ICT
world for the assessment of functional impairment in AD and MCI. The derived DAS scores provide a pragmatic, ecological, objective measurement which may improve the prediction of future dementia, be used as an outcome measurement in clinical trials and lead to earlier therapeutic intervention.
Keywords: functional impairment, ICT, IADL, MCI
Introduction
One of the key clinical features of Alzheimer’s disease (AD) is impairment in daily functioning. Activities of daily living (ADLs) consist of bathing, dressing, going to the toilet, transferring, continence, and feeding.1 Instrumental ADLs (IADLs) are the
activities often performed by a person who is living independently in a community setting during the course of a normal day, such as using the telephone, shopping, food preparation, housekeeping, laundry, mode of transportation, responsibility for own medication, and ability to handle finances.2 The inability to perform ADLs and IADLs
leads to loss of independence, affects quality of life of patients with dementia, and increases the burden of caregivers by shifting to them many daily responsibilities.3
Dove
press
O R I G I N A L R E S E A R C Hopen access to scientific and medical research Open Access Full Text Article
Number of times this article has been viewed
This article was published in the following Dove Press journal: Clinical Interventions in Aging
Mild cognitive impairment (MCI) is often a precursor to AD and other forms of dementia, as 12% of individuals with MCI convert to AD within 1 year,4 and as many as 60% of
individuals with MCI develop AD over a 5-year period.5 It
has been shown that more complex IADL may already be impaired in the early stages of cognitive decline before a diagnosis of dementia is warranted.6–9 As indicated in the
recommendations from the National Institute on Aging-Alzheimer’s Association (NIA-AA),10 persons with MCI
commonly have mild problems performing complex tasks. Nevertheless, they generally maintain their independence with minimal assistance. It is recognized that the application of this criterion is challenging but also necessary for the determination of whether a person has dementia. Methods to assess IADL comprise self-reported questionnaires, performance-based assessment, and informant-based questionnaires. These measurements have some limitations11
because they do not offer accurate, reproducible, objective, and ecological perspectives. Moreover, these assessment batteries and standardized tools rely on quantitative scales, which are often lacking sensitivity.
For this reason, information and communication technology (ICT), particularly techniques involving imaging and video processing, is of interest12 and may
overcome the limitations in reducing the inter/intra-rater variability due to human interpretation. Such techniques enable the patients’ performances and actions in real time and real life situations to be captured and accurately evaluated.
In France, a third Alzheimer plan was launched in 2008 (French National Plan for “Alzheimer and Related Disorders” 2008–2012)13 to strengthen research on
Alzheimer’s disease and related disorders, promote earlier diagnosis, and improve both patient management and support for carers. In this context, the French National Research Agency (ANR) launched a call to promote research projects in health and autonomy through innovative concepts and technological breakthrough. This call was proposed to engineers and companies involved in innovative computer sciences but also to clinical practitioners. This explains why clinical centers belonging to the nationwide network comprising 27 “memory resource and research centers” (CMRRs: centres mémoire de ressources et de recherche) also participated.
The overall aim of the SWEET Home (ANR TecSan 2009) project was to demonstrate that it is possible using a video monitoring system (VMS), to obtain a quantifiable assessment of IADLs in AD and in MCI.
Study participants and methods
This study was promoted by the Nice University Hospital (study 11-pp-03) and funded by the National Research Agency in France (ANR-09-TECS-016-01). Ethical approval was received from the Protection of Persons Committee “Sud Méditerranée V” (CPP N°11029 from May 24, 2011) and the “Agence Française de Sécurité Sanitaire des Ali-ments et des Produits de Santé” (AFSSAPS N°B110465-30 from April 14, 2011). Informed consent was obtained before the first assessment.
Participants and clinical assessment
Sixty-four individuals aged 65 or older were recruited at the Nice Research Memory Center within two consecutive protocols: P1 for AD and normal controls (NC), P2 for MCI (NIA-AA criteria) and NC.
For the AD group, the diagnosis was determined using the NINCDS-ADRDA criteria.14 For the MCI group, patients
with a mini-mental state examination (MMSE) score higher than 24 were included using the Petersen clinical criteria.4 Subjects were not included if they had a history
of head trauma with loss of consciousness, psychotic or major depressive disorder according to the Diagnostic
and Statistical Manual of Mental Disorders, 4th edition
criterion, or aberrant motor activity (tremor, rigidity, Parkinsonism) as defined by the Movement Disorder Society Unified Parkinson Disease Rating Scale.15 Participants
were administered a cognitive and behavioral examination prior to completing the video monitoring session. Global cognitive functioning was assessed using the MMSE.16
Other cognitive functions were assessed with the frontal assessment battery,17 5 Words,18 clock drawing test,19 and
verbal fluencies.20 Depressive symptoms were assessed using
MADRS21 and GDS.22 Finally, functions were assessed using
the IADL scale (IADL-E)23 during a clinical interview with
the caregivers.
Ecological assessment of autonomy
based on a VMS
The ecological assessment of IADLs was conducted in an observation room located in the Nice Research Memory Center. This room was equipped with everyday objects for use in ADLs and IADLs, eg, an armchair, a table, a tea corner, a television, a personal computer, and a library. Two fixed monocular video cameras (eight frames per second) were installed to capture the activity of the participants during the experiment. The aim of this ecological assessment of autonomy was to determine the extent to which the participant could undertake a list of
Table 1 Daily activity scenarios characteristics in protocols 1 (P1) and 2 (P2) Daily activity scenario associated
with the protocol 1 (P1)
Daily activity scenario associated with the protocol 2 (P2)
Activities “Your task is to perform this list of activities in the order given within a time frame of 20 minutes”
• Walk to the reading table and read something for 2 mn
• Walk to the coffee corner where the kettle is and boil some water
• Walk to the phone and compose this number: xxxxxx
•Take the watering can and water the plant. • Walk to the television and turn it on with the
remote control
• Walk to the reading table, take the playing cards and classify them by color (reds with reds, blacks with blacks)
• Take the green “ABCD” folder on the desk with the A, B, C, D sheets in it. Match the A, B, C, D sheets from the folder to the relevant folders dispersed all over the room; A with A, etc … Put the “ABCD” folder back on the desk
•Leave the room
“Your task is to perform this list of 10 activities in a logical manner within 15 min. These 15 minutes represent a typical morning period of everyday life” •Read the newspaper
•Water the plant •Answer the phone •Call the taxi
•Prepare today’s medication
•Make the check for the Electricity Company • Leave the room when you have finished all
activities •Watch the TV •Prepare a hot tea
•Write a shopping list for lunch
Constraints Participant has to perform the activities in the given order
1. watch the TV before the phone call 2. water the plant just before leaving the room 3. call the taxi, which will arrive in 10 minutes and
ask the driver to drive you to the market
Duration 20 minutes 15 minutes
Parameters extracted from video used to compute DAS.,n scores
– REff Є R[0,1]
– Number of activities omitted, a1,P1 Є [1,7]
– Total number of repetitions, a2,P1 Є N
– Order error, a3,P1 Є {0,1} with a3,1 = 1 if order error
was done
– Total number of attempts before completing a given activity, a4,P1 Є N
– REff Є R[0,1]
– Number of activities omitted, a1,P2 Є [0,10]
– Total number of repetitions excluding the leisure activities (“watching TV”, and “reading”), a2,P2 Є N
– Number of activities performed but not achieved, a3,P2 Є [0,10]
– Respect of temporal execution constraints, a4,P2 Є {0,1} with a4,P2 = 1 if more than two
or three temporal constraints were not respected
daily activities with the respect of constraint after having been given a set of instructions. To achieve this aim, two functional scenarios which could realistically be undertaken within the confines of the room were proposed to participants: one for the AD and NC participants (P1), and the other for the MCI and NC participants (P2). All assessments were performed at the same time of day, between 2 pm and 3 pm. The rating of the videos was made by engineers specialized in video signal analysis working at the Institut National de Recherche en Informatique et en Automatique.
Daily activity scenario (DAS).,n associated with protocol P1
For the protocol P1 scenario, participants were assessed in their ability to carry out a list of seven activities (eg, reading
the newspaper, turning on the television) in a specific order within a timeframe of 20 minutes (see Table 1).
DAS associated with protocol P2
For the functional scenario associated with P2, participants were assessed in their ability to carry out a list of ten activities in a logical order respecting temporal execution constraints within a timeframe of 15 minutes (see Table 1). Prior to leaving the room, the examiner described each of the activities and the location and use of various objects needed to undertake the tasks. The examiner left the room only after it was clear that the participant understood the tasks. The participant kept the list of instructions and referred to them at any point during the assessment. He/she could leave the room when he/she felt that he/she had completed the required tasks. The participant was
also told that the examiner would be available for questions on the other side of the door and that he/she could leave the room at any point should he/she choose to do so. During the clinical scenario, an examiner located outside of the room monitored the safety of the participants.
The DAS score [DAS
.,.()] for assessing
the scenario
The first step (Step 1) was to manually select and collect the clinical relevant data to be extracted from videos. Secondly (Step 2), the mathematical algorithm for assessing the scenario (DAS score) was constructed, and then parameters
ki,n included in the expression of the DAS score were determined using a fitting procedure (Step 3). The final step (Step 4; to validate the procedure and the values of parameters ki,n) was done using the leave-one-out cross-validation (LOOCV) methodology. All these steps are described below.
Step 1: DAS.,.() development – annotated data
Researchers blinded to a participant’s clinical status viewed and annotated the video to extract relevant parameters. To avoid inter- and intra-rater variability due to subjective interpretation of performed activities, the beginning and the end of each activity were defined using specific criteria (Table 2). A ratio related to the percentage of time participants carried out goal-oriented behaviors was computed as follows:
REff= (total time [in seconds] spent by the participant in performing the listed activities/total time spent in the room), REffЄ R[0,1].
For the DAS associated with P1, the following parameters were extracted: a1,P1 number of activities omitted, a1,P1Є [1,7]; a2,P1 total number of repetitions, a2,P1Є N; a3,P1 order error, a3,P1Є {0,1} with a3,1= 1 if order error was done; and a4,P1 total number of attempts before completing a given activity, a4,P1Є N.
For the DAS associated with P2, the following parameters were extracted: a1,P2 number of activities omitted, a1,P2Є [0,10]; a2,P2 total number of repetitions excluding the leisure activities (“watching television,” and “reading”), a2,P2Є N; a3,P2 the number of activities performed but not achieved, a3,P2Є [0,10]; and a4,P2 parameter related to the respect of temporal execution constraints a4,P2Є {0,1} with a4,P2= 1 if more than two or three temporal constraints were not respected.
Step 2: DAS.,.() development – mathematical expression of DAS score
The score DASj,n, n Є {P1, P2}, for a participant j was expressed by: DASj,n (k1,n,k2,n,k3,n,k4,n) (j) = [REff(j)] × Π4 i a j ki n i n =1 , ,( ) with
k1,P1, k2,P1, k3,P1, and k4,P1 verifying the following relationship 0 , k1,P1 , k2,P1 , k3,P1 , k4,P1 , 1, and no constraints were established for ki,P2 parameters i Є [1,4].
Table 2 Observable criteria used to annotate video sequences of the protocol 2 (P2)
Activity Activity period Achievement
Start End
Read the newspaper Taking for the first time the newspaper
Putting on the table the last newspaper taken
Opening a newspaper taken to read the content
Water the plant Taking the watering can Putting the watering can on the table Making the gesture of watering the plant
Answer the phone Taking the handset in the hand Putting the handset on the phone base Speaking on the phone
Call the taxi Taking the handset in the hand Putting the handset on the phone base Dialing the correct phone number and speaking on the phone Prepare the medication
for today
Taking the pillbox located inside a basket with the medication prescription inside
Putting the pillbox inside the basket Correct use of medication prescription (both dose and timetable)
Make the check for the Electricity Company
Taking the pen to write on the check
Putting the pen on the desk Correct amount, date, signature and recipient name on the check Leave the room when you
are finished with all activities
Taking the handle of the exit door Closing the door Closing the door as the last activity undertaken in the scenario Watch the TV Taking the remote call Returning for the last time the remote
control
TV must have been switched off Prepare a hot tea Turning on the tea kettle Returning the tea kettle after having
poured the water in the cup of tea
Brewed tea Write the shopping list
for the lunch
Taking the pen to write on the shopping list
Replacing the pen Write at least one item to eat or drink
Step 3: Fitting procedure
To determine values of the model parameter set (k1,n, k2,n, k3,n, k4,n), n Є {P1, P2}, the fitting procedure was divided into two steps. Firstly, 50,000 different combinations of parameter values, consistent with constraints of order (P1), and no specific constraints for (P2) were drawn up using a random number generator. Secondly, multiple model parameter sets (k1,n, k2,n, k3,n, k4,n) to produce a “good fit” were selected if their associated score was both strongly and positively correlated with MMSE score, as well as being strongly and negatively correlated with IADL score using a nonparametric Spearman correlation coefficient as the criterion distance of good fit. For the analyses, the final functional DAS.,n (k1,n, k2,n, k3,n, k4,n) score was calibrated by using the combination of the mean of the parameters which were selected as the model parameter set during the second step of fitting procedure.
Step 4: Cross-validation methodology
Predictive performance of the DAS.,n score, n Є {P1, P2} was done by a LOOCV given the small sample sizes. Criteria used for validating the model with other current neuropsychological rating scales were the Spearman correlation between the DAS.,n score with both MMSE and IADL-E. Criteria used for performing the predictive performance of the model were accuracy rate, positive predictive value, negative predictive value, false-positive rate, and false-negative rate computed from test data according to the LOOCV methodology.24
Statistical analysis
All analyses were performed following the per-protocol analyses, including all patients who correctly finished the
protocol. Results are presented as means and their 95% confidence intervals (CIs) or standard deviations (SDs) (mean, 95% CI; or mean ± SD) for continuous variables, and as the value and its associated proportion (n, %) for categorical variables. Intergroup comparisons for continuous variables were performed using a nonparametric Mann–Whitney test. Analyses of association between two categorical variables (two modalities) were studied using the Fisher’s exact test. Analyses of associations were measured using Spearman rank correlation. The significance level was set at an alpha risk of 5% (P , 0.05). The receiver operating curves (ROCs) and its area under the ROC was also provided to assess the predictive performance of the DAS.,n scores computed from all data. All calculations were performed using SPSS Statistics (IBM Corporation, Somers, NY) software, version 19.0, and R software, version 2.13.2.
Results
Protocol 1
Population
Sixteen AD patients (age = 76.7 ± 7.6) and 10 NC (age = 73.9 ± 6.2) were included in protocol 1. Table 3 shows the clinical and demographic data of the participants. Significant intergroup differences in demographic factors (gender and age) were not seen. The mean MMSE for the AD group was 20.7 (±2.0) and 28.1 (±1.3) for the NC group (P , 0.001), and the mean IADL-E scores also differed between groups, with the AD group having significantly different mean IADL-E scores (14.3 ± 5.9) compared with the NC group (10.5 ± 1.1) (P , 0.05).
Table 3 Characteristics of the participants in protocol 1 (P1)
Characteristics NC n = 10 AD n = 16 P values
Female, n (%) 5 (50%) 11 (68.8%) 0.425
Age-yrs, mean [CI95%] 73.9 [69.4, 78.4] 76.7 [72.7, 80.7] 0.182
Level of education, n (%) Unknown 0 (0%) 0 (0%) – No formal education 0 (0%) 0 (0%) – Elementary school 1 (10%) 7 (43.8%) 0.099 Middle school 0 (0%) 4 (25.0%) 0.136 High school 2 (20.0%) 2 (12.5%) 0.625 Post-secondary education 7 (70.0%) 3 (18.8%) 0.015*
MMSEa, mean [CI95%] 28.1 [26.8, 29.4] 20.7 [18.7, 22.7] ,0.001**
IADL-Eb, mean [CI95%] 10.5 [9.7, 11.3] 14.3 [11.2, 17.5] 0.031*
MADRSc, mean [CI95%] 3.5 [0.3, 6.7] 4.3 [1.9, 6.6] 0.698
GDSd, mean [CI95%] 7.2 [1.5, 12.9] 7.9 [5.4, 10.5]e 0.411
Notes: aScores on the Mini Mental State Examination (MMSE) range from 0 to 30, with higher scores indicating better cognitive function; bscore on the Instrumental Activities of Daily Living for Elderly (IADL-E) range from 0 to 36, with lower score indicating a better functional independency; cscores on the Montgomery Asberg Depression Rating Scale (MADRS) range from 0 to 60 (10 items range from 0 to 6), with higher scores indicating depressive state; dscores on the Geriatric Depression Scale (GDS) range from 0 to 30, with higher scores indicating depressive state; e1 missing data. *P , 0.05; **P , 0.001.
0.00 A B C D E 0.10 0.20 0.30 0.40 0.50 REFF = Index 0 Index 1 Index 2 Index 3 S..P1 ()= Index 4 0.60 0.70 0.80 0.90 1.00 0.00 0.10 0.20 0.30 0.40 0.50 0.60 0.70 0.80 0.90 1.00 0.00 0.10 0.20 0.30 0.40 0.50 0.60 0.70 0.80 0.90 1.00 0.00 0.10 0.20 0.30 0.40 0.50 0.60 0.70 0.80 0.90 1.00 0.00 0.10 0.20 0.30 0.40 0.50 0.60 0.70 0.80 0.90 1.00
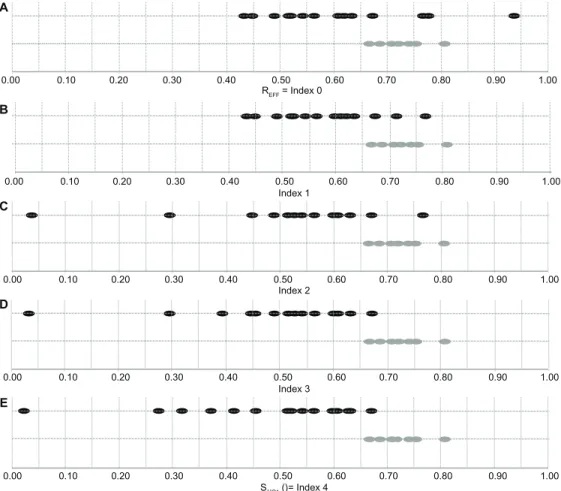
Figure 1 DAS.,P1 scores for AD patients and NC participants for protocol 1 (P1). The first line (A) represents the ratio of efficacy for the two groups (Grey dots for NC and Black dots for AD). Then the next lines (B–E) show the evolution of the index from ratio of efficacy (index 0) to DAS.,P1 score (index 4) including omission (B), repetition (C), order error (D), and bad completion at the first attempt (E). Measurements represented for each participant j: (A) REff = Index0,P1(j) (Percentage of time spent in the room to behave directed to perform a listed activities). (B) Index1,P1(j) = [REff(j)]×∏ ki=14 1, 1a1, 1 (j)PF(impact of omission mistakes on the REff). (C) Index2,P1(j) = [REff(j)]×∏ ki=14 1, 1a1, 1 (j)PF (cumulative impact of omission and repetition mistakes on the REff). (D) Index3,P1(j) = [REff(j)]× i=1
2 1, a , ( )
2 12
∏ kPF j(cumulative impact of omission, repetition, and order mistakes on the REff). (E) Final
DAS score Sj,P1 (k1,P1, k2,P1, k3,P1, k4,P1) (j) = [REff(j)]× i=1 4
1, 1 a1, 1 (j)
∏ kPF (cumulative impact of omission, repetition, order mistakes, and bad completion at the first attempt on the R Eff).
LOOCV results for DAS.,P1
Table 5 shows predictive performances results of the assessment methodology to classify the new test data as AD observation (refers to a positive case) or NC observation (refers to a negative case) using its DAS.,P1() score fitted using the value of parameter set (k1,P1, k2,P1, k3,P1, k4,P1) defined from the training dataset.
Assessment based on DAS.,P1
Figure 1 shows evolution of the indexes fitted from all data (n = 26). The differentiation between the AD and NC groups increased progressively when the cumulative impact of parameters k1,P1, k2,P1, k3,P1, and k4,P1 were taken into account. The DAS.,P1() scores fitted from all data (n = 26) differed significantly (Mann–Whitney,
P , 0.001) between AD (DASAD,P1 = 0.47, 95% CI 0.38–0.56) and NC (DASNC,P1= 0.71, 95% CI 0.68–0.74). The Spearman correlation coefficients were ρ (DAS.,P1,
MMSE) = 0.81, ρ (DAS.,P1, IADL-E) = −0.65, and ρ (DAS.,P1, diagnosis) = −0.76 (diagnosis = 0 refers to NC group, and diagnosis = 1 refers to AD group) (see Table 6). Based on the measurement of DAS.,P1 scores fitted from all data (n = 26), the test performance provided an area under the ROC of 0.98, 95% CI 0.92–1.00, and for a cutoff point of 0.65 (±0.01), the sensitivity and specificity were 100% and 94% (see Figure 2).
Protocol 2
Population
Nineteen MCI patients (age = 75.2 ± 4.25) and 19 NC (age = 71.7 ± 5.4) were included in protocol 2. Table 4 shows the clinical and demographic data of the participants. Significant intergroup differences in demographic factors (gender and age) were not seen. The mean MMSE for the MCI group was 25.8 (±2.2) and 28.8 (±1.0) for the NC group (P , 0.001), and the mean IADL-E scores did not differ
Table 4 Characteristics of the participants in protocol 2 (P2)
Characteristics NC n = 19 MCI n = 19 P-values
Female, n (%) 15 (78.9%) 9 (47.4%) 0.091
Age-yrs, mean [CI95%]/(±SD) 71.7 [69.2, 74.3] 75.2 [73.2, 77.3] 0.070
Level of education, n (%) Unknown 2 (10.5%) 2 (10.5%) 1.00 No formal education 0 (0%) 0 (0%) – Elementary school 1 (5.3%) 5 (26.3%) 0.405 Middle school 4 (21.0%) 7 (36.8%) 0.269 High school 4 (21.0%) 3 (15.8%) 1.00 Post-secondary education 8 (42.1%) 2 (10.5%) 0.062
MMSEa, mean [CI95%] 28.8 [28.3, 29.3] 25.8 [24.8, 26.8] ,0.001**
IADL-Eb, mean [CI95%] 9.6 [9.0, 10.1] 9.9 [9.1, 10.7] 0.488
MADRSc, mean [CI95%] 2.8 [1.1, 4.5] 4.6 [2.9, 6.4]e 0.075
GDSd, mean [CI95%] 7.1 [3.7, 10.4]e 8.4 [5.5, 11.3] 0.525
Notes: aScores on the Mini Mental State Examination (MMSE) range from 0 to 30, with higher scores indicating better cognitive function; bscore on the Instrumental Activities of Daily Living for Elderly (IADL-E) range from 0 to 36, with lower score indicating a better functional independency; cscores on the Montgomery Asberg Depression Rating Scale (MADRS) range from 0 to 60 (10 items range from 0 to 6), with higher scores indicating depressive state; dscores on the Geriatric Depression Scale (GDS) range from 0 to 30, with higher scores indicating depressive state. e1 missing data. **P , 0.001.
Abbreviations: NC, normal control; MCI middle cognitive impairment.
between groups, with the MCI group having a mean IADL-E score of 9.9 (±1.7) and 9.6 (±1.1) for the NC group.
LOOCV results for DAS.,P2
Table 5 shows predictive performance results of the assess-ment methodology to classify the new test data as MCI observation (refers to a positive case) or NC observa-tion (refers to a negative case) using its DAS.,P2() scores fitted using the value of parameter set (k1,P2, k2,P2, k3,P2, k4,P2) defined from the training dataset. Predictive perfor-mance results are better with the DAS.,P1 than the DAS.,P2 (eg, higher accuracy rate, higher positive and negative predictive values), which is coherent with the increasing difficulty to differentiate NC participants from patients at earlier stages of AD disease.
Assessment based on DAS.,P2
Figure 3 shows evolution of the indexes fitted from all data (n = 38). The first lines (a) represent the ration of efficacy for the two groups (one point represents one patient). The next lines (b, c, d, and e) show the evolution of the index from the ration of efficacy (index 0) to DAS.,P2 score (index 4) with the addition of omission (b), repetition (c), bad achievement (d), and planning mistakes (e). The differentiation between the MCI and NC groups is done progressively with the cumulative impact of parameters k1,P2, k2,P2, k3,P2, and k4,P2. The
DAS.,P2 scores differed significantly (P , 0.001) between MCI
(DASMCI,P2= 0.11, 95% CI 0.05–0.16) and NC (DASNC,P2= 0.36,
95% CI 0.26–0.45). The Spearman correlation coefficients were ρ (DAS.,P2, MMSE) = 0.81, ρ (DAS.,P2, IADL-E) = −0.06, and ρ (DAS.,P2, diagnosis) = −0.66 (diagnosis = 0 refers to NC
1.0 Sensitivity Specificity 0.8 0.6 0.4 0.2 1.0 0.8 0.6 0.4 0.2 0.0 0.0 0.2 0.4
Cut-off point 1-specificity
Sensitivity, specificit
y
Sensitivity
0.6 0.8 0.0 0.2 0.4 0.6 0.8 1.0
A B
Figure 2 Performance evaluation of the assessment methodology to classify observation data as AD group or NC group. (A) Specificity and sensitivity in function of the
cutoff point of DAS.,P1() scores. (B) Receiver operating curve associated with protocol 1.
A B C D E 0.00 0.10 0.20 0.30 0.40 0.50 REFF = Index 0 0.60 0.70 0.80 0.90 1.00 Index 1 0.00 0.10 0.20 0.30 0.40 0.50 0.60 0.70 0.80 0.90 1.00 Index 2 0.00 0.10 0.20 0.30 0.40 0.50 0.60 0.70 0.80 0.90 1.00 Index 3 0.00 0.10 0.20 0.30 0.40 0.50 0.60 0.70 0.80 0.90 1.00 S.,P2 ()= Index 4 0.00 0.10 0.20 0.30 0.40 0.50 0.60 0.70 0.80 0.90 1.00
Figure 3 DAS.,P2 scores for MCI patients and NC participants for protocol 2 (P2). The first line (A) represents the ratio of efficacy for the two groups (Grey dots for NC and Black dots for MCI). Then the next lines (B–E) show the evolution of the index from ratio of efficacy (index 0) to DAS.,P2 score (index 4) including omission (B), repetition (C), bad achievement of activities (D), and planning errors (E). Measurements represented for each participant j: (A) REff = Index0,P2 (j) (Percentage of time spent in the room to behave directed to perform a listed activities). (B) Index1,P2(j)= [REff(j)]× k1PF j2
12 ,
, ( )
α (impact of omission mistakes on the R
Eff). (C) Index2,P2(j) = [REff(j)]× i=1 2 1, a , ( ) 2 12 ∏ kPF j (cumulative
impact of omission and repetition (excluding repetition of leisure activities) mistakes on the REff). (D) Index3,P2(j) = [REff(j)]× i=1 3 1, a , ( ) 2 12 ∏ kPF j
(cumulative impact of omission, repetition (excluding repetition of leisure activities) mistakes and bad achievement of activities on the REff). (E) Final DAS score Sj,P2 (k1,P2, k2,P2, k3,P2, k4,P2) (j) = [REff(j)]× i=1
4 1, a , ( ) 2 12 ∏ kPF j
(cumulative impact of omission, repetition (excluding repetition of leisure activities) mistakes, bad achievements of activities, and planification mistakes on the REff). Table 5 Evaluation of predictive performance of our assessment methodology based on the DAS scores: Leave-one-out
cross-validation (LOOCV) resultsa
DAS.,P1() score DAS.,P2() score
K value of the K-folder for the cross-validation method, K 26 38
Number of observations of each training dataset used for classifying the new test data (ntest = 1), ntraining
25 37
Relationship between the DAS scores compared with current rating scales
Spearman’s correlation coefficient with MMSE, mean (±SD) 0.68 (±0.03) 0.81 (±0.01)
Spearman’s correlation with IADL-E, mean (±SD) −0.64 (±0.03) −0.05 (±0.03)
Predictive performance of the ecological assessment based on the DAS scores resultsb
Threshold of cut-off point, mean (±SD)c 0.62 (±0.01) 0.21 (±0.01)
Accuracy rate 88.5% 71.1%
Predictive positive value 93.3% 68.2%
Predictive negative value 81.8% 75%
False positive rate 3.9% 18.4%
False negative rate 7.7% 10.5%
Notes: aThe leave-one-out cross-validation was used to provide an un-biased estimation of the prevision errors of our models (the DAS scores), and therefore to assess how the results of our models will generalize to an independent data (data not used during the fitting procedure). In our context, this methodology consists to estimate the parameter set (k1,n, k2,n, k3,n, k4,n), n Є {P1, P2} with the training dataset (ntraining) and to define the threshold of cut-off point from the DAS scores computed from the training dataset, and then to validate this assessment methodology to classify the test data. For the LOOCV, this procedure was repeated K times: each observation in the initial sample is used once as the test data; bpredictive performance was computed according to the LOOCV methodology; cthe threshold was defined for each training dataset as the cut-off that minimizes the absolute value between the specificity and the sensitivity to optimize both.
Table 6 Spearman’s correlation coefficients between DAS.,n()
scores with Diagnosis, MMSE and IADL-E
Diagnosis MMSE IADL-E
P1a P2b P1 P2 P1 P2 REff −0.50** 0.11 0.55** −0.15 −0.53** −0.01 Index 1 −0.63** −0.20 0.59** 0.32 −0.62** −0.01 Index 2 −0.69** 0.34* 0.70** 0.34* −0.64** 0.07 Index 3 −0.76** 0.77** 0.77** 0.77** −0.65** −0.08 Index 4 −0.76** 0.81** 0.81** 0.81** −0.64** −0.06
Notes: aFor P1, Diagnosis = 0 refers to NC group, Diagnosis = 1 refers to AD group; bfor P2, Diagnosis = 0 refers to NC group, Diagnosis = 1 refers to MCI group. *P , 0.05; **P , 0.001.
group, and diagnosis = 1 refers to MCI group) (see Table 6). Based on the measurement of DAS.,P2 scores fitted from all data (n = 38), the test performance provided an area under the ROC of 0.87, 95% CI 0.76–0.99, and for a cutoff point of 0.24 (±0.01), the sensitivity and specificity were 74% and 89% respectively (see Figure 4).
Discussion
In the present study, the use of VMS was sought to assess participants during complex daily living activity scenarios. Using VMS, it was possible to determine that in comparison to NC participants, those with AD performed worse on sev-eral outcome parameters including the time to achieve the set activities and the number of repetitions of the same activity. These results highlight the importance of executive function in the performance of basic daily activities and are consistent with previous findings.25,26 Esposito et al27 explored
execu-tive function and multitasking in daily life using the modified six elements task. In that study, AD patients had significantly more multitasking deficits than NC participants. The VMS
method made it possible to define an objective and continu-ous measure of functional impairment disturbances. It was interesting to note that as the complexity of the DAS score increased, so did the magnitude of the difference between the AD and the NC participants. The complex DAS score included several clinically quantifiable as well as qualitative parameters representative of daily functioning. The complex DAS score was significantly correlated with the MMSE as a marker of global cognitive level. This correlation was strong (0.81) even though the DAS score included specific execu-tive characteristics that were not included in the MMSE, such as repetition, omission, and incorrect order. In addition, the ROC analysis of the DAS score showed 94% sensitivity and 100% specificity for discriminating AD from NC subjects.
Taking these initial results into account, the authors of this present paper designed another scenario aiming to stress more subtle differences between MCI and NC participants. The ROC analysis of the DAS score showed 89% sensitivity and 73% specificity for discriminating MCI from NC participants. More specifically, this second protocol showed that MCI patients had impaired performances on DAS scores and had difficulty correctly reorganizing activities and successfully carrying out the activities. As for the AD patients, the observed impaired performances in the MCI patients highlight the importance of executive and planning parameters in IADLs28 (see Table 7). In fact, there is an increasing call
for a stronger consideration of impairment in IADLs in the diagnostic criteria of MCI to improve the prediction of dementia.25 The aim of a recent longitudinal cohort study29
was to determine the predictive ability of MCI and IADL impairment for incident dementia. As part of the German Study on Ageing, Cognition, and Dementia in Primary Care
1.0 Sensitivity Specificity 0.8 0.6 0.4 0.2 1.0 0.8 0.6 0.4 0.2 0.0 0.0 0.2 0.4
Cut-off point 1-specificity
Sensitivity, specificity
Sensitivity
0.6 0.0 0.2 0.4 0.6 0.8 1.0
A B
Figure 4 Performance evaluation of the assessment methodology to classify observation data as MCI group or NC group. (A) Specificity and sensitivity in function of the
cutoff point of DAS.,P2() scores. (B) Receiver operating curve associated with the protocol 2.
Table 7 Ratio of efficacy and qualitative parameters in the two protocols for each diagnosis group
Raw parameters Participants
Raw parameters for the protocol 1 (P1) NC group (N = 10) AD group (N = 16)
Ratio of efficacy, mean [CI(95%)]* 0.71 [0.68, 0.74] 0.61 [0.54, 0.68]
Omission of at least one activity, n (%) 0 (0%) 2 (12.5%)
Repetition of at least one activity, n (%) 0 (0%) 6 (37.5%)
Incorrect order, n (%) 0 (0%) 4 (25%)
At least one failure to complete one activity at the first time, n (%) 1 (10%) 7 (43.75%)
Raw parameters for the protocol 2 (P2) NC group (N = 19) MCI group (N = 19)
Ratio of efficacy, mean [CI(95%)] 0.54 [0.49, 0.59] 0.56 [0.52, 0.61]
Omission of at least one activity, n (%) 0 (0%) 3 (15.8%)
Repetition of at least one activity excluding leisure activity, n (%) 3 (15.8%) 6 (31.6%)
No respect of 2 or 3 constraints order, n (%) 6 (31.6%) 8 (42.1%)
At least one activity not achieved, n (%)** 3 (15.8%) 13 (68.4%)
Notes: *P , 0.05; **P , 0.001.
Abbreviations: NC, normal control; AD, Alzheimer disease; MCI, middle cognitive impairment.
Patients, a sample of 3327 patients from general practitioners, aged 75 years and older, was assessed with four assessments at 1.5-year intervals over a period of 4.5 years. Results indicate that MCI and IADL are significantly associated with higher conversion to, shorter time to, and better predictive power for future dementia. Regarding IADL, a significant impact was found for impairment in responsibility for one’s own medication, shopping, and housekeeping, and in the ability to use public transport.
These pilot studies have several limitations. From a logistical point of view, this assessment is not yet reproduc-ible easily in others clinical facilities. In addition, even if the duration of the scenario is relatively short (20 minutes and 15 minutes respectively for the first and second study) the overall duration including preparation of the room and of the patient is too long. From a technical point of view, the main limitation of the computational model in this present study is that it relied on the fact that only the relative position of the participant in the room is automatically processed by computer vision algorithm. Automatic recognition of IADL remains in progress. Therefore, the annotation of timeframe when a participant performs an activity is made manually, which is time consuming for the clinicians. One possible option to have a more automated assessment would be to use other environmental sensors (such as contact sensors) in conjunction with the VMS system to give direct information concerning the correct realization of the activity and the time spent for performing the activity. Finally, a more accurate cognitive assessment for MCI patients to delineate amnesic from non-amnesic MCI patients needs to be proposed.
The next step of the research is to solve most of these technical limitations. These are the objectives of the ongo-ing European Commission project FP7 Dem@Care devoted to the development of an automatic system providing
multiparametric monitoring of daily activity lifestyle behavior in combination with medical data.
In conclusion, this study outlines the interest of a novel tool coming from the ICT world for the assessment of autonomy in AD and MCI. The derived DAS scores provide a pragmatic, ecological, objective measurement which may improve the prediction of future dementia, be used as an outcome measurement in clinical trials, and lead to earlier therapeutic intervention.
Acknowledgments
This study was supported by a grant from the ANR-09-TECS-016-01 – TecSan – SWEET HOME, by the Innovation Alzheimer and ARMEP associations and by the platform patients of the Nice CHU member of the CIU-S.
Disclosure
The authors report no conflict of interests in this work for the past 5 years.
References
1. Katz S, Ford AB, Moskowitz RW, Jackson BA, Jaffe MW. Studies of illness in the aged. The Index of ADL: a standardized measure of biological and psychosocial function. JAMA. 1963;185:914–919. 2. Lawton MP, Brody EM. Assessment of older people: self-maintaining
and instrumental activities of daily living. Gerontologist. 1969;9(3): 179–186.
3. Andersen CK, Wittrup-Jensen KU, Lolk A, Andersen K, Kragh-Sorensen P. Ability to perform activities of daily living is the main factor affecting quality of life in patients with dementia. Health Qual Life Outcomes. 2004;2:52.
4. Petersen RC, Smith GE, Waring SC, Ivnik RJ, Tangalos EG, Kokmen E. Mild cognitive impairment: clinical characterization and outcome. Arch
Neurol. 1999;56(3):303–308.
5. Morris JC, Cummings J. Mild cognitive impairment (MCI) represents early-stage Alzheimer’s disease. J Alzheimers Dis. 2005;7(3):235–239. 6. Tuokko H, Morris C, Ebert P. Mild cognitive impairment and everyday
Clinical Interventions in Aging
Publish your work in this journal
Submit your manuscript here: http://www.dovepress.com/clinical-interventions-in-aging-journal
Clinical Interventions in Aging is an international, peer-reviewed journal focusing on evidence-based reports on the value or lack thereof of treat-ments intended to prevent or delay the onset of maladaptive correlates of aging in human beings. This journal is indexed on PubMed Central, MedLine, the American Chemical Society’s ‘Chemical Abstracts
Service’ (CAS), Scopus and the Elsevier Bibliographic databases. The manuscript management system is completely online and includes a very quick and fair peer-review system, which is all easy to use. Visit http://www.dovepress.com/testimonials.php to read real quotes from published authors.
7. Artero S, Petersen R, Touchon J, Ritchie K. Revised criteria for mild cognitive impairment: validation within a longitudinal population study.
Dement Geriatr Cogn Disord. 2006;22(5–6):465–470.
8. Farias ST, Mungas D, Reed BR, Harvey D, Cahn-Weiner D, Decarli C. MCI is associated with deficits in everyday functioning. Alzheimer Dis
Assoc Disord. 2006;20(4):217–223.
9. Jefferson AL, Lambe S, Moser DJ, Byerly LK, Ozonoff A, Karlawish JH. Decisional capacity for research participation in individuals with mild cognitive impairment. J Am Geriatr Soc. 2008;56(7):1236–1243. 10. Albert MS, DeKosky ST, Dickson D, et al. The diagnosis of mild
cognitive impairment due to Alzheimer’s disease: recommendations from the National Institute on Aging-Alzheimer’s Association work-groups on diagnostic guidelines for Alzheimer’s disease. Alzheimers
Dement. 2011;7(3):270–279.
11. Sikkes SA, Visser PJ, Knol DL, et al. Do instrumental activities of daily living predict dementia at 1- and 2-year follow-up? Findings from the Development of Screening guidelines and diagnostic Criteria for Predementia Alzheimer’s disease study. J Am Geriatr Soc. 2011;59(12): 2273–2281.
12. Romdhane R, Mulin E, Derreumeaux A, et al. Automatic video monitoring system for assessment of Alzheimer’s disease symptoms.
J Nutr Health Aging. 2012;16(3):213–218.
13. Alzheimer Plan 2008–2012 [homepage on the Internet]. Available from: http://www.plan-alzheimer.gouv.fr. Accessed September 14, 2012. 14. McKhann G, Drachman D, Folstein M, Katzman R, Price D, Stadlan EM.
Clinical diagnosis of Alzheimer’s disease: report of the NINCDS-ADRDA Work Group under the auspices of Department of Health and Human Services Task Force on Alzheimer’s Disease. Neurology. 1984;34(7):939–944.
15. Goetz CG, Tilley BC, Shaftman SR, et al. Movement Disorder Society-sponsored revision of the Unified Parkinson’s Disease Rating Scale (MDS-UPDRS): scale presentation and clinimetric testing results. Mov
Disord. 2008;23(15):2129–2170.
16. Folstein MF, Folstein SE, McHugh PR. “Mini-mental state”. A practical method for grading the cognitive state of patients for the clinician.
J Psychiatr Res. 1975;12(3):189–198.
17. Dubois B, Slachevsky A, Litvan I, Pillon B. The FAB: a Frontal Assessment Battery at bedside. Neurology. 2000;55(11):1621–1626.
18. Dubois B, Touchon J, Portet F, Ousset PJ, Vellas B, Michel B. “The 5 words”: a simple and sensitive test for the diagnosis of Alzheimer’s disease. Presse Med. 2002;31(36):1696–1699.
19. Sunderland T, Hill JL, Mellow AM, et al. Clock drawing in Alzheimer’s disease. A novel measure of dementia severity. J Am Geriatr Soc. 1989;37(8):725–729.
20. Alberca R, Salas D, Perez-Gil JA, Lozano P, Gil-Neciga E. Verbal fluency and Alzheimer’s disease. Neurologia. 1999;14(7):344–348. 21. Montgomery SA, Asberg M. A new depression scale designed to be
sensitive to change. Br J Psychiatry. 1979;134:382–389.
22. Yesavage JA, Brink TL, Rose TL, et al. Development and validation of a geriatric depression screening scale: a preliminary report. J Psychiatr
Res. 1982;17(1):37–49.
23. Mathuranath PS, George A, Cherian PJ, Mathew R, Sarma PS. Instrumental activities of daily living scale for dementia screening in elderly people. Int Psychogeriatr. 2005;17(3):461–474.
24. Efron B, Gong G. A leisurely look at the bootstrap, the jackknife, and cross-validation. Am Stat. 1983;37(1):36–48.
25. Marshall GA, Rentz DM, Frey MT, Locascio JJ, Johnson KA, Sperling RA. Executive function and instrumental activities of daily living in mild cognitive impairment and Alzheimer’s disease. Alzheimers Dement. 2011;7(3):300–308.
26. Razani J, Casas R, Wong JT, Lu P, Alessi C, Josephson K. Relationship between executive functioning and activities of daily living in patients with relatively mild dementia. Appl Neuropsychol. 2007;14(3): 208–214.
27. Esposito F, Rochat L, Van der Linden AC, et al. Apathy and executive dysfunction in Alzheimer disease. Alzheimer Dis Assoc Disord. 2010; 24(2):131–137.
28. Dechamps A, Fasotti L, Jungheim J, et al. Effects of different learning methods for instrumental activities of daily living in patients with Alzheimer’s dementia: a pilot study. Am J Alzheimers Dis Other Demen. 2011;26(4):273–281.
29. Luck T, Luppa M, Wiese B, et al. Prediction of incident dementia: impact of impairment in instrumental activities of daily living and mild cogni-tive impairment – results from the German Study on Ageing, Cognition, and Dementia in Primary Care Patients. Am J Geriatr Psychiatry. Epub June 14, 2012.