HAL Id: hal-01291972
https://hal.archives-ouvertes.fr/hal-01291972
Submitted on 7 May 2020
HAL is a multi-disciplinary open access
archive for the deposit and dissemination of
sci-entific research documents, whether they are
pub-lished or not. The documents may come from
teaching and research institutions in France or
abroad, or from public or private research centers.
L’archive ouverte pluridisciplinaire HAL, est
destinée au dépôt et à la diffusion de documents
scientifiques de niveau recherche, publiés ou non,
émanant des établissements d’enseignement et de
recherche français ou étrangers, des laboratoires
publics ou privés.
the Morvan Mountains (France): a regional synthesis.
Isabelle Jouffroy-Bapicot, B. Vannière, Emilie Gauthier, Hervé Richard,
Fabrice Monna, Christophe Petit
To cite this version:
Isabelle Jouffroy-Bapicot, B. Vannière, Emilie Gauthier, Hervé Richard, Fabrice Monna, et al.. 7000
years of vegetation history and land-use changes in the Morvan Mountains (France): a regional
syn-thesis.. The Holocene, London: Sage, 2013, 23 (12), pp.1888-1902. �10.1177/0959683613508161�.
�hal-01291972�
The Holocene 23(12)
Introduction
Multiproxy palaeoecological investigations carried out during the last decades illustrated the complex interrelations between natural and human forcing, which drove ecological dynamics during the mid- and late Holocene (Berglund, 2003; Dearing, 2006). These analyses, related to archaeological and historical knowledge, are of primary importance to our understanding of the formation of European cultural landscape. Throughout these studies, the regional scale (in the sense of a natural region) has appeared as the most suitable spatial scale for understanding the complex interplay of human history, land-use and climate varia-tions (Dearing et al., 2006). In this context, European middle and high mountains are areas of primary importance (e.g. in the Alps: Court-Picon et al. (2006), Gauthier and Richard (2009), Moe et al. (2007) and Tinner et al. (2003); in the Jura: Gauthier and Richard (2007) and Magny et al. (2008); in the French Massif Central: Miras et al. (2004) and Miras et al. (2011) and in the Pyrenees: Ejarque et al. (2010), Miras et al. (2010) and Rius et al. (2009)). Mostly because of these studies, mountain regions are no longer considered as marginal zones but have shown original land uses over time that are strongly connected to the exploita-tion of local resources such as wood and metalliferous ore depos-its. Furthermore, mountainous environments have the advantage of combining an abundance of natural archives suitable for pal-aeoecological investigations and sensitivity to climatic and/or anthropogenic forcing. However, despite the increase in recent multiproxy studies concerning the micro-regional scale in Euro-pean mountainous environments linking palaeoecology, archae-ology and history (Curras et al., 2012; Ejarque et al., 2009; Miras et al., 2011; Rius et al., 2011; Roepke et al., 2011), scientific
papers focusing on a long-term regional approach based on sev-eral sequences remain scarce.
The Morvan Massif, a small middle mountain in central France, is well adapted to the study of landscape dynamics pro-cesses at the regional scale. From a geomorphological and a bio-geographical point of view, it is characterized by a homogeneity of environmental conditions over a restricted area (c. 1500 km2).
Furthermore, peat deposits spread throughout the massif provide the opportunity to investigate pollen records, and hence to docu-ment vegetation dynamics. Two periods of supra-regional impor-tance marked the local history. The first one took place during the 1st century bc, with the presence of one of the greatest oppidum
of the Celtic world, Bibracte, a major economic and political cen-tre (Dhennequin et al., 2008). The second one occurred much later, when the Morvan Forest supplied Paris with firewood dur-ing modern times (Vigreux, 1994). The goal of this paper is to investigate how these well-known periods are part of an evolution
1Laboratoire Chrono-Environnement UMR 6249 CNRS/Université de
Franche-Comté, Besançon, France
2ARTéHIS UMR 6298 Université de Bourgogne/CNRS/Ministère de la
Culture, Dijon, France
3Université de Paris 1, UMR CNRS 7041 ArScAn, Paris, France
Corresponding author:
Isabelle Jouffroy-Bapicot, Laboratoire Chrono-Environnement UMR 6249 CNRS/Université de Franche-Comté, 16, route de Gray, 25030 Besançon, France.
Email: Isabelle.jouffroy@univ-fcomte.fr
7000 years of vegetation history and
land-use changes in the Morvan
Mountains (France): A regional synthesis
Isabelle Jouffroy-Bapicot,
1Boris Vannière,
1Émilie Gauthier,
1Hervé Richard,
1Fabrice Monna
2and Christophe Petit
3Abstract
This paper aims to reconstruct the vegetation history of a middle mountain – the Morvan (Burgundy, France) – since the Neolithic (i.e. 7000 years). The results of palynological and non-pollen palynomorphs (NPPs) analysis performed on 10 peat cores document the main phases of human agro-pastoral practices and natural resources management which drove the formation of the cultural landscape of the Morvan Massif over time. To document the history of human activities at a regional scale, particular attention was given to the determination, the characterization and the graphical depiction of phrases of human impact. Both the quantification of the impact of human pressure and the chronological uncertainty of the different phases identified by pollen and NPP analysis were taken into account. This study reveals a clear human presence during periods that were formerly poorly documented, such as the onset of the Neolithic period, the Bronze Age, the early Iron Age and the early Middle Ages. It also sheds new light over periods for which there is better archaeological and historical knowledge, such as the widespread occupation of the massif in the late Iron Age, the cultivation of chestnut from the 11th to the 16th century and the impact of modern firewood exploitation on the forest.
Keywords
Burgundy (France), coprophilous fungi, human impact, middle mountain, mid–late Holocene, pollen Received 22 May 2013; revised manuscript accepted 5 August 2013
over the long term. It also aims to evaluate the role of poorly documented practices, especially breeding and cultivation, in the formation of the cultural landscape of the Morvan Massif, as well as the role of climate forcing. To achieve this goal, we attempted to quantify the impact of human pressure on the environment using the results of pollen analyses as well as coprophilous fungal spores identified through the study of non-pollen palynomorphs (NPPs). Finally, we explored a new kind of graphical depiction which allows comparison between different sequences in the area, while taking into account the chronological uncertainty inferred by radiocarbon dating.
The study area
The Morvan Massif, located in the north/centre of France (Bur-gundy), is the northern extension of the French Massif Central. The bedrock is mainly granitic, with volcano-sedimentary forma-tions (conglomerates and rhyolite) on the southern part (Ricordel et al., 2007). In the north (northern hills), the topography is smooth, with low altitudes ranging between 450 and 550 m a.s.l.,
while they are higher in the southern part (southern mountains), from 700 to 900 m a.s.l. (Figure 1). The climate is typical of sub-montane areas, marked by wet conditions with precipitations of more than 1000 mm in the most elevated zones, and a low average annual temperature of about 9°C. Influences of an Atlantic cli-mate are found on the western part, while influences of a conti-nental climate dominate in the east.
The whole massif is crosscut by several microgranitic and quartz veins in which abundant polymetallic mineralization (Pb, Zn, Ag) is present (Gourault, 1999; Marcoux, 1986). Textual and field evidence indicates the exploitation of fluorine, barite and lead during the 20th century. Geomorphological anomalies, such as wide trenches and gullies, found throughout the massif also suggest ancient mining. During the last decade, palaeoenviron-mental investigations, combining geochemical and palynological analysis on peat cores, provided indirect clues for local metallur-gical activities as early as the Bronze Age (c. 1300 cal. bc) and
during the Iron Age (c. 200–50 cal. bc; Jouffroy-Bapicot, 2007;
Jouffroy-Bapicot et al., 2008; Monna et al., 2004). Furthermore, recent excavations at Mont-Beuvray provided the first
Figure 1. Study area: location of the Morvan Massif and peatlands analysed in the northern hills (NH), the southern mountains (SM) and the
southern slope (SL).
VB: Verny-des-Brûlons; EB: Etang Bouquin; V: Le Vernay; N: Nataloup; M: Montbé; CG: Champ Gazon; GM: Grand-Montarnu; PL: Port-des-Lamberts; SY: Sources de l’Yonne; P: Poil.
archaeological evidence of Prehistoric mining in the Morvan dated to about the 1st century bc (Cauuet and Tamas, 2008).
Soils on the granitic and/or volcanic substrate have moderate to strong acidity (Quantin, 2004). Agricultural lands are rare, and at present, the landscape is dominated by forests and meadows. More precisely, 48% of the area is forested (Zakin et al., 2007): roughly half by natural deciduous forest with common beech (Fagus sylvatica) and sessile oak (Quercus petraea), and half with coniferous plantations (Abies sp., Pseudotsuga menziesii, Picea abies; Fedoroff et al., 2005). Since the 1960s, the cultiva-tion of Christmas trees has increased in the Morvan in an attempt to diversify agricultural activities. Forestry and breeding are the main economic activities, and rural depopulation has been impor-tant over the last five decades.
The history of human occupation in the Morvan Massif is unevenly documented over time and space. Published archaeo-logical data are scarce and archaeoarchaeo-logical investigations are rare, with the exception of the Aeduan oppidum of Bibracte, estab-lished on Mont-Beuvray, one of the highest points of the Morvan Massif. This Celtic hill fort was occupied during the 1st and 2nd centuries bc and, according to Caesar, who wrote his famous
nar-rative of the Gallic War there (Julius Caesar, De Bello Gallico, books 1–8), was one of the greatest and richest towns in Gaul. After the Roman conquest, the oppidum was gradually abandoned in favour of a new town founded by the Imperator Augustus, Augustodunum, nowadays known as Autun (Rebourg, 1991). Unlike the late Celtic period, the Prehistoric, the Roman and the Mediaeval human occupations of the Morvan are not well docu-mented with the exception of some recent papers dealing with archaeological data provided by old excavations and surveys (Martineau et al. (2011) for the Neolithic and Chevrier (2002) for the Bronze Age). Finally, the socio-economic history of the mas-sif in modern times, from the 16th to the early 20th century, when the timber floating industry of Morvan supplied Paris with fire-wood, is well-known (Benoit et al., 2004; Poux et al., 2011; Vigreux, 1994).
Materials and methods
Fieldwork and sites
There are no natural lakes on the Morvan Massif, but several peat deposits representing suitable natural archives for palaeoenviron-mental investigations. Their potential was little exploited before 2000, and only some old palynological analyses, with or without radiometric dating, were done (Lemée, 1951; Richard, 1996). All the known peat deposits of the Morvan Massif were investigated for this study. Only those with more than 1 m of sediments were cored, using a Russian corer (GYK-type). In all, 10 fossil pollen sequences from the Morvan were analysed. From north to south, we studied six cores in the northern hills (NH), three cores in the
southern mountains (SM) and one core on the southern slope (SL; Figure 1 and Table 1). Only the part of the cores concerning the last 7 kys, from the Neolithic to the present, is discussed in this paper; a complete analysis of the sequences with an older chro-nology can be found in Jouffroy-Bapicot (2010).
Radiocarbon dates
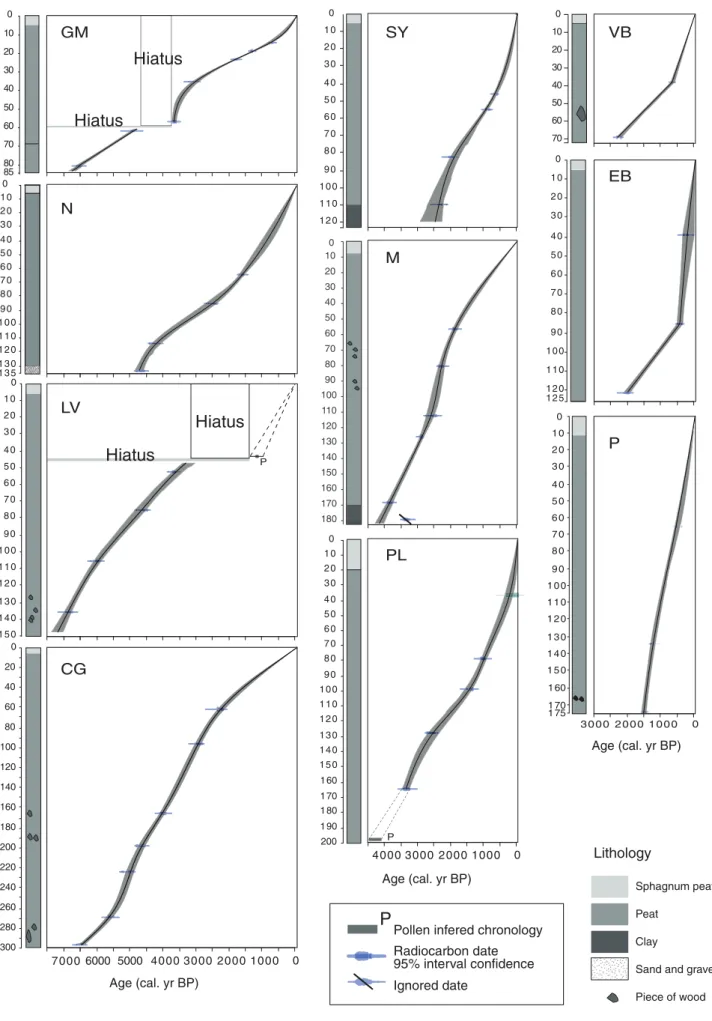
Three to seven radiocarbon dates per core were performed, depending on the depth and the timespan, representing a total of 46 dating. These dates were calibrated with IntCal09, and the age–depth models were done with CLAM (Blaauw, 2010). The smooth spline function was used when the studied core or a sec-tion of a core contained at least four dates, and the interpolated function was preferred when less than four dates were available. Radiocarbon dates and calibrations are reported in Table 2. Age– depth models and simplified lithology are shown for each sequence in Figure 2. Sediments mainly consist of homogenous peat, especially sphagnum-peat, except at Poil (P) where it is sedge-peat. According to the pollen data and the radiocarbon dat-ing in the sequences of Grand-Montarnu and Le Vernay, two sedi-mentary hiatuses, not visible in the lithology, appear. The upper part of the core performed at Le Vernay has no radiometric dating and will not be used to reconstruct vegetation history.
Pollen and NPP analyses
The samples for pollen and NPP analyses were routinely taken at intervals of 4 cm, but for the most compacted section-parts, sub-sampling was taken at intervals of 2 cm or 1 cm in order to refine time resolution analysis. Samples were prepared according to stan-dard techniques for pollen analysis (Faegri and Iversen, 1989). Pol-len grains were identified with the aid of keys (Beug, 2004; Moore et al., 1991), photographs (Reille, 1992) and reference to the mod-ern pollen-type slide collection of the Chrono-environment Labora-tory of Besançon. Nomenclature follows Beug (2004). In addition to pollen analysis, NPPs were identified and counted according to Van Geel classifications (Van Geel, 2001; Van Geel et al., 1981, 1983, 1989). The focus here is on fungal remains commonly used as dung indicators, which give a new reliable data set to character-ize pastoral phases in different kinds of environments (e.g. Baker et al., 2013; Cugny et al., 2010; Ejarque et al., 2010; Gauthier et al., 2010; Miehe et al., 2009; Mighall et al., 2006; Van Geel and Apt-root, 2006; Yeloff et al., 2007).
Pollen percentages are based on the sum of pollen of dry-ground vascular plants, total land pollen (TLP) sum exceeding 500 grains. Fern spores, aquatic plants, Cyperaceae and Alnus (whose impressive proportions along the diagrams suggest the develop-ment of these species in the wetlands) were excluded from the TLP (except at the site of Etang de Bouquin for the Cyperaceae and the site of Poil for Alnus, where these taxa percentages remain
Table 1. Sites location and description: altitudes a.s.l., type of the peatlands according to Charman (2002).
Code Name Altitude above sea level Geographical setting Type of peatland
VB Verny-des-Brûlons 565 m 47°19′04″N/04°07′22″E Pond border mirea
EB Etang Bouquin 540 m 47°16′17″N/04°01′23″E Pond border mirea
LV Le Vernay 590 m 47°15′43″N/04°04′45″E Blanket mire
N Nataloup 515 m 47°13′39″N/04°02′07″E Valley mire
M Montbé 562 m 47°12′53″N/04°06′25″E Blanket mire
CG Champ Gazon 585 m 47°12′12″N/04°02′55″E Blanket mire
GM Grand-Montarnu 770 m 47°00′41″N/04°03′12″E Sloping mire
PL Port-des-Lamberts 710 m 46°57′39″N/04°00′38″E Sloping mire
SY Sources de l’Yonne 740 m 46°57′23″N/04°00′36″E Sloping mire
P Poil 420 m 46°53′33″N/04°02′03″E Basin mire
moderate). Relative values of pollen and NPPs were calculated as a percentage of the TLP using Tilia, and the pollen diagrams were constructed with TGView (Grimm, 1991–1993).
Direct and indirect indicators of human impact were selected. Direct indicators of human disturbances consist of anthropo-chores pollen, including the following:
• Introduced and cultivated trees: Chestnut (Castanea sativa) and walnut (Juglans regia);
• Cultivated herbs. Cereals (Cerealia-type grains with a minimum diameter of 42 µm and a minimum diameter pore + annulus >10 µm (Beug, 2004; Tweddle et al.,
2005)), buckwheat (Fagopyrum) and hemp (Cannabis sativa). All the Cannabinaceae pollen grains are identified here as Cannabis-type because of the convergence of the following clues: (1) all the diameters of the pollen grain were >28 µm, (2) they appear after ad 500 and (3)
com-mon hop (Humulus lupulus), whose pollen grain can be confused with hemp, is absent from the Morvan Massif (Bardet et al., 2008);
• Archaeophyte weeds. Centaurea cyanus, Papaver rhoeas-type and Polygonum aviculare-rhoeas-type (Brun, 2011; Brun et al., 2007);
Table 2. Radiocarbon dates (AMS 14C dating).
Site code and depth (cm) Material Lab code Age uncalibrated BP Cal. bc–ad (2 sigma)
PL 34-38 Peat LY-10941 Modern
PL 77-79 Peat LY-10942 1070 ± 50 784–1015 cal. ad
PL 97-99 Peat LY-10943 1460 ± 60 435–665 cal. ad
PL 126-128 Peat LY-10944 2480 ± 40 768–415 cal. bc
PL 163-165 Peat LY-10945 3117 ± 54 1497–1264 cal. bc
SY 45,5-46,5 Peat Erl-11298 706 ± 35 1230–1388 cal. ad
SY 54,5-55,5 Peat Erl-11297 1006 ± 37 905–1154 cal. ad
SY 82-83 Seeds Erl-11296 2059 ± 47 194 cal. bc to 48 cal. ad
SY 109,5-110,5 Wood Erl-11295 2341 ± 41 723-235 cal. bc
GM 14-15 Peat Poz-13091 730 ± 30 1225–1296 cal. ad
GM 18-20 Peat Poz-20338 1365 ± 30 613–760 cal. ad
GM 23-24 Peat Poz-20289 1845 ± 30 86–238 cal. ad
GM 35,5-36 Peat Poz-13160 2920 ± 40 1259–1007 cal. bc
GM 56-58 Peat Poz-20339 3375 ± 30 1745–1540 cal. bc
GM 61,5-62,5 Peat Poz-13094 4290 ± 40 3030–2870 cal. bc
GM 80-81 Peat Poz-13093 5750 ± 40 4710–4490 cal. bc
P 64-66 Wood Erl-11294 447 ± 35 1410–1612 cal. ad
P 134-135 Peat Erl-11293 1311 ± 40 648–776 cal. ad
P 173,5-175 Seeds Erl-11292 1547 ± 36 426–591 cal. ad
M 56-57 Peat Poz-26581 1880 ± 35 61–227 cal. ad
M 80-81 Macro remains Poz-26604 2190 ± 35 371–171 cal. bc
M 112-113 Macro remains Poz-26582 2410 ± 40 748–396 cal. bc
M 125,5-126,5 Macro remains Poz-26605 2720 ± 30 916–811 cal. bc
M 168-169 Peat Poz-26583 3485 ± 35 1894–1693 cal. bc
M 179-180 Macro remains Poz-26606 3045 ± 35 1409–1212 cal. bc
V 53-54 Peat Poz-18740 3390 ± 35 1861–1540 cal. bc
V 77-78 Peat Poz-17990 4055 ± 35 2846–2474 cal. bc
V 109-110 Peat Poz-20340 5225 ± 35 4224–3962 cal. bc
V 141-142 Peat Poz-18742 5990 ± 50 5000–4729 cal. bc
CG 61-62 Peat Poz-2685 2295 ± 45 475–203 cal. bc
CG 97-95 Peat Ly-2463 (Poz) 2805 ± 45 1109–836 cal. bc
CG 165-166 Peat Poz-21627 3660 ± 35 2137–1941 cal. bc
CG 197,5-199 Charcoal Poz-21628 4120 ± 35 2869–2577 cal. bc
CG 223,5-224,5 Peat Poz-21629 4415 ± 35 3320–2917 cal. bc
CG 269-270 Peat Poz-22896 4850 ± 40 3706–3528 cal. bc
CG 296,5-297,5 Peat Poz-22893 5710 ± 40 4680–4449 cal. bc
N 64-65 Charcoal Poz-18739 1680 ± 30 258–423 cal. ad
N 85-86 Charcoal Poz-18647 2405 ± 35 745–396 cal. bc
N 114-115 Charcoal Poz-18648 3830 ± 35 2456–2150 cal. bc
N 134-135 Macro remains Poz-24016 4130 ± 35 2870–2581 cal. bc
EB 38,5-39,5 Macro remains Poz-26573 210 ± 35 1641–1964 cal. ad
EB 85-86 Macro remains Poz-26575 370 ± 35 1447–1634 cal. ad
EB 121-122 Peat Poz-26729 2040 ± 35 163 cal. bc to 49 cal. ad
VB 37,5-38,5 Peat Poz-13030 695 ± 30 1260–1390 cal. ad
VB 68-70 Charcoal Poz-12013 2300 ± 30 402–235 cal. bc
VB 76-77 Peat Poz-20364 3695 ± 35 2200–1970 cal. bc
AMS: accelerator mass spectrometry; Poz: Poznan Radiocarbon laboratory – Poland; Erl: AMS 14C-Labor Erlangen – Germany; LY: Centre des Sciences de
la Terre à Lyon – France.
Sphagnum peat Peat
Sand and gravel Piece of wood Clay Lithology 0 20 40 60 80 100 120 140 160 180 200 220 240 260 280 300
Pollen infered chronology Radiocarbon date 95% interval confidence Ignored date
P
P P 0 10 20 30 40 50 60 70 80 90 100 110 120 135 130 0 10 20 30 40 50 60 70 80 90 100 110 120 130 140 150 0 1000 2000 3000 4000 0 1000 2000 3000 4000 0 0 0 6 5000 7000 0 10 20 30 40 50 60 70 80 90 100 110 120 125 0 10 20 30 40 50 60 70 80 90 100 110 120 130 140 150 160 170 180 190 200 0 10 20 30 40 50 60 70 80 90 100 110 120 130 140 150 160 170 180 0 10 20 30 40 50 60 70 80 90 100 110 120 0 10 20 30 40 50 60 70 0 10 20 30 40 50 60 70 80 85GM
SY
M
PL
VB
EB
P
N
LV
CG
Age (cal. yr BP) Age (cal. yr BP) Age (cal. yr BP)Hiatus
Hiatus
Hiatus
Hiatus
0 1 0 2 0 3 0 4 0 5 0 6 0 7 0 8 0 9 0 1 0 0 1 1 0 1 2 0 1 3 0 1 4 0 1 5 0 1 60 1 70 1 75 0 1000 2000 3000Figure 2. Lithology and age–depth models of the 10 peat cores performed in Morvan, in the northern hills (NH), the southern mountains
(SM) and the southern slope (SL).
VB: Verny-des-Brûlons; EB: Etang Bouquin; V: Le Vernay; N: Nataloup; M: Montbé; CG: Champ Gazon; GM: Grand-Montarnu; PL: Port-des-Lamberts; SY: Sources de l’Yonne; P: Poil.
Table 3. Presence of ruderal taxa found in the Morvan’s pollen
spectra before the Neolithic (7000 cal. BP): ‘ ’ = absent; ‘I’ = rare; ‘X’ = present.
Verny des Brûlon s Le Ve rnay Etang de Bouquin Grand-MontarnuChamp Gazo n Nataloup Ruderal taxa Plantago lanceolata I Urticaceae I Chenopodiaceae I I I I Plantago major/media I Artemisia x x x x x I Rumex x x x I I Rubiaceae x x I x I I
• Ascospores of the coprophile fungal genera Sporormiella. Recent papers indicate that Sporormiella (HdV 113) is the most reliable indicator for documenting pastoral history during the mid- to late Holocene in different areas (Baker et al., 2013).
Indirect indicators of human disturbances consist of the following:
• Apophytes pollen, including ruderal, heliophilous and meadow taxa. This group includes taxa commonly used as anthropogenic indicators (Behre, 1981): Plantago lanceo-lata-type, Plantago major/media-type, Urtica, Chenopodi-aceae, Rumex acetosella-type, Rubiaceae and Artemisia. Some of these taxa were considered here as better indica-tors than others because they are absent or very rare in pol-len spectra before the Neolithic (Table 3, according to Jouffroy-Bapicot (2010)). Other taxa underlined by recent studies on modern assemblages conducted in mountainous areas (Brun, 2011; Brun et al., 2007; Court-Picon et al., 2005, 2006; Mazier et al., 2009; Miras, 2009) were added: Potentilla-type, Caryophyllaceae, Melampyrum, Composi-tae, Fabaceae, Epilobium, Echium and Scrophularia-type. • Fungal ascospores of Sordaria sp. (HdV 55a) and
Cer-cophora sp. (HdV 112). These coprophilous fungi are common in the sequences but as indicators of pastoralism, they are not as specific as Sporormiella sp., because they are not strictly linked to the dung of herbivores, although they are also saprophytic (Baker et al., 2013).
Anthropogenic impact phases (AIPs) were established from the pollen diagrams by a stratigraphically constrained cluster analysis using constrained incremental sums of squares (CONISS), a function of TGView. The cluster analysis was based on direct and indirect anthropogenic indicators as listed above (pollen and fungal spores), and also included trees, shrubs and Poaceae because they reflect wood clearance that may be related to an anthropogenic origin. Pollen and NPP diagrams are shown in Figure 3.
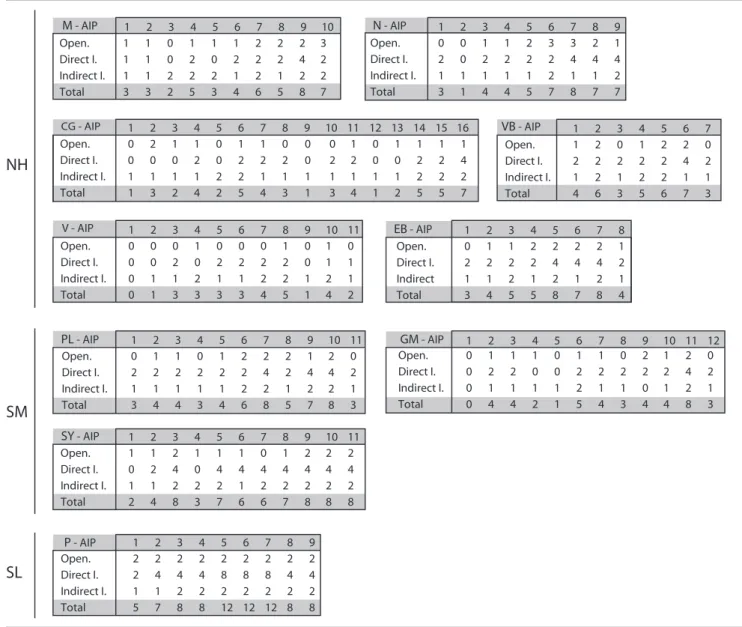
The degree of perceived human impact was estimated for each AIP by totalling the semi-quantitative scores related to (1) the arboreal pollen/non-arboreal pollen (AP/NAP) ratios, expressing the openness of the landscape, (2) the direct indicators and (3) the indirect indicators. Guidelines for scoring are reported in Table 4. Note that the direct indicators present higher scores than the oth-ers which may also be driven by natural dynamics. AIP values do not quantify agro-pastoral pressure and/or woodland openness. However, they offer an element of comparison of the changes in
the palaeoecological perception of anthropization, site by site, in the perspective of a regional synthesis.
The quantifications of the anthropogenic impact of the AIP are shown on a chronological scale using the age-model data pro-vided by CLAM (Figure 4). This graphic representation offers the opportunity to compare the anthropogenic impact site by site and, at the same time, to show the margins of the chronological incertitude (confidence intervals at 95%) of each AIP. It also allows a comparison of the trends of human impact at the regional scale with the regional chrono-cultural chronology and the mate dynamics in Western Europe provided by independent cli-mate proxies.
Results, vegetation dynamics
Neolithic (c. 7000–4300 cal. BP to c. 5000–2300
cal.
bc)
(Figure 3 – Grand-Montarnu: AIP-2 to AIP-5, Le Vernay: AIP-2 to AIP-8 – 7000–4300 cal. BP, Champ Gazon: AIP-1 to AIP-6 and Nataloup: AIP-1 and AIP-2)
Three sequences provide information about the timespan corresponding to the early and middle Neolithic (c. 7000–5200 cal. BP): Grand-Montarnu in the SM (GM-2 and GM-3) and Le Vernay and Champ Gazon in the NH (V-2 to V-5 and CG-1 and CG-2). All of these sequences are characterized by AP values that remain high but irregular, and by the appearance of anthro-pochore pollen grains. The presence of anthropogenic indica-tors is not continuous. Several phases alternate, characterized by more or less anthropochore and/or apophyte pollen associ-ated or not with a decrease in AP pollen. Some of them regis-tered a stronger decrease in AP and an increasing curve of Poaceae and/or apophytes. These are associated with the appearance and the increase in Sordaria and Cercophora spores (GM second part of V-2, V-3 and V-4). From c. 5500 cal. bc on, distinct trends characterize the two parts of the
Mor-van Massif. In the SM, at Grand-Montarnu (GM-4 and GM-5), cultivated and ruderal taxa disappear and other apophytes recede, despite the rise of Poaceae. In the NH, at Champ Gazon, the presence of the apophytes ‘strong indicators’ is continuous and Sordaria spores appear (CG-3 and GM-4); at Le Vernay, where anthropogenic indicators are constant until c. 6200 cal. BP (V-5 and V-6), an increasing presence of anthro-pochores and apophytes is registered from 5000 to 4000 cal. BP (V-6, V-7 and V-8). Then, from c. 4500 cal. BP on, a decrease is already registered at le Vernay (V: end of AIP-8 and beginning of AIP-9). At Nataloup, where the onset of peat accumulation occurs somewhat earlier (N-1 and first half of N-2), anthropogenic indicators are scarce. One exception to this regional scheme is recorded at Champ Gazon where all indicators increase (CG-6).
Bronze Age and Iron Age (c. 4300–2000 cal. BP to
2300–50 cal.
bc)
(Figure 3 – Grand-Montarnu: AIP-6 to AIP-8, Port-des-Lamberts: AIP-1 to AIP-6, Sources de l’Yonne: AIP-1 to AIP-3, Le Vernay: AIP-9 to AIP-11, Champ Gazon: AIP-7 to AIP-14, Nataloup: AIP-2 to AIP-4, Verny-des-Brûlons: AIP-1 and Montbé: AIP-1 to AIP-6)
Five sequences provide palaeoecological information about the Bronze Age in the Morvan (4300–2800 cal. BP). In the SM, the beginning of this period corresponds to the onset of peat accumula-tion in the Port-des-Lamberts, and in the Grand-Montarnu sequence, approximately one millennium is lacking, from 4500 to 3500 cal. BP, because of a hiatus in peat accumulation (Figures 2
20 60 Fagu s 100 Poac eae Othe r herb s 20 40 Casta nea Jugla ns Anthropochore s 20 40 Apophyte s (SI) 20 Other Apophyts 20 40 Sporormiella sp. 20 Sordaria sp. Cercophor a sp. 1000 2000 3000 4000
Total sum of squares CONISS 1 2 3 4 5 6 7 8 9
P
GM
20 60 100 Fagu s Poac eae Othe r herb s Casta nea Jugla ns AnthropochoresApophyte s (SI ) 20 Other apophyte s Sporormiella sp. Sordaria sp. 20 40 60 Cercophor a sp. 1000 2000Total sum of squares CONISS
SY
PL
1 2 3 4 5 6 7 8 9 10 11 4 10 20 30 40 50 60 70 80 90 100 110 120 130 140 150 160 170 180 190 200 20 60 100 Fagu s Depth (cm) Depth (cm) Age (cal. yr BP) Poac eae Othe r herb s Casta nea Jugla ns Anthropochore s Apophyte s (SI) 20 Other ApophytesAIP AIP AIP AIP 2000 4000 6000Total sum of squares CONISS 1 2 4 6 8 9 10 11 12 7 3 5 0 10 20 30 40 50 60 70 80 90 100 20 60 100 Fagu s Poac eae Othe r herb s Casta nea Jugla ns AnthropochoresApophytes (SI) 20 Other Apophyt s 20 Sordaria sp. Cercophor a sp. 2000 4000 6000 8000 10000
Total sum of squares CONISS 1 2 3 4 5 6 7 8 9 10 11 12 0 1000 500 1500 2000 2500 3000 4000 0 10 20 30 40 50 60 70 80 90 100 110 120 0 500 1000 1500 2000 2500 Depth (cm) 0 500 1000 1500 2000 2500 3000 3500 3900 5000 5500 6000 6500 7000 7500 8000 8500 9000 0 10 20 30 40 50 60 70 80 90 100 110 120 130 140 150 160 170 180 0 250 500 750 1000 1250 1500 Depth (cm) Hiatus
Trees and Shrubs Trees and Shrubs
Trees and Shrubs Trees and Shrubs
Age (cal. yr BP)
Age (cal. yr BP) Age (cal. yr BP)
(a)
(Figure 3 Continued) and 3a). In the NH, Champ Gazon and Nataloup document all the
period, and peat accumulation initiates around 4000 cal. BP in Montbé. A durable hiatus interrupts the sequence of Le Vernay around 3500 cal. BP (Figure 2).
On the whole, at the beginning of this period, in the SM as in the NH, the AP pollen is dominant with values up to 80% of the TLP sum. Fagus became the main arborean pollen in the area (PL-1 and PL-2, N-2, CG-7, V-9 and M-1). However, the arboreal pollen/total pollen (AP/T) curves are irregular in the SM, whereas agro-pastoral indicators remain low and intermittent everywhere.
During middle Bronze Age and the beginning of late Bronze Age (c. 3600–3000 cal. BP), the AP curve, and especially the Fagus percentages, rise in Montbé (M-3), and anthropochores disappear at the end of the period. The increase of AP is especially strong at Champ Gazon, up to 95% (CG-8 to CG-10), while anthropo-chores disappear evenly from c. 3500–3200 cal. BP. At Nataloup, the crop indicators are constant and the AP curve decreases slightly (N-3). At the end of the period, the presence of agro-pastoral indicators increases anew at Champ Gazon (CG-11) even if the forest canopy remains strong. In the SM, the anthropogenic
20 40 60 80 100 20 20 20 20 2 4 6 8 10
Total sum of squares CONISS M N VB EB V CG 1 1 2 2 3 3 4 4 5 5 6 7 7 8 8 9 9 10 20 40 60 80 100 200 400 600 800 1000 Total sum of squares
CONISS 1 2 3 4 5 6 7 8 20 40 60 80 100 20 20 2 4 6 8 10 18
Total sum of squares CONISS 1 1 2 2 3 3 4 4 5 5 6 6 7 7 8 8 9 9 10 10 11 11 12 13 14 15 16 50 60 70 80 90 100 110 120 130 140 150 155 20 40 60 80 100 20 200 400 600 800 1000 1200 1400 1600
Total sum of squares CONISS
20 40 60 80 100 20 1000 2000 3000 4000
Total sum of squares CONISS 6 20 40 60 80 100 20 20 200 600 1000 CONISS 1 2 3 4 5 6 7 0 10 20 30 40 50 60 70 80 90 100 110 120 130 140 150 160 170 180 0 500 1000 1500 2000 2500 3000 3500 4000 Depth (cm) 0 10 20 30 40 50 60 70 80 90 100 110 120 130 140 150 160 170 180 190 200 210 220 230 240 250 260 270 280 290 300 0 500 1000 1500 2000 2500 3000 3500 4000 4500 5000 5500 6000 6500 5 10 20 30 40 50 60 70 80 90 100 110 120 0 500 1000 1500 2000 3500 4000 4500 5000 5500 6000 6500 7000 0 10 20 30 40 50 60 70 80 90 100 110 120 130 140 0 500 1000 1500 2000 2500 3000 3500 4000 4500 0 10 20 30 40 50 60 70 75 0 500 1000 1500 2000 2500 3000
Depth (cm) Trees and ShrubsOther herb s PoaceaeCastane a Juglan s Anthropochore s Apophytes (SI ) Other Apophyte s Sordaria sp . Cercophora sp . AIP Fagus
Trees and Shrubs Fagu
s
Age (cal. yr BP)
Age (cal. yr BP) Other herb s Poacea e
CastaneaJuglansAnthropochoresApophytes (SI )
Other ApophytesSporormiella sp . Sordaria sp . Cercophora sp . AIP
Depth (cm)Trees and ShrubsFagu s
Age (cal. yr BP) Other herbsPoacea e
CastaneaJuglansAnthropochoresApophytes (SI )
Other ApophytesSporormiella sp . Sordaria sp . Cercophora sp . AIP
Depth (cm)Trees and ShrubsFagus
Age (cal. yr BP) Other herb s Poacea e
CastaneaJuglansAnthropochoresApophytes (SI )
Other ApophytesSporormiella sp . Sordaria sp . Cercophora sp . AIP Depth (cm) Trees and ShrubsFagus
Age (cal. yr BP) Other herbsPoaceaeCastaneaJuglan s AnthropochoresApophytes (SI
) Other Apophyte s Sporormiella sp . Sordaria sp . Cercophora sp . AIP
Depth (cm) Trees and ShrubsOther herb s Poacea e AnthropochoresApophytes (SI
) Other Apophyte s Sordaria sp . Cercophora sp . AIP Fagu s Age (cal. yr BP)
(b)
Figure 3. Pollen diagrams with selected taxa (pollen and coprophilous fungi) and cumulative curves related to human impact on vegetation.
‘Anthropochores’ cumulative curve contains herbaceous direct indicators; ‘apophytes (SI)’ cumulative curve contains strong indicators displayed in Table 2 and ‘other apophytes’ cumulative curve contains other apophytes displayed in Table 2. Hollow curves for pollen and grey curves for fungal spores are exaggerated 6×. (a) Three sequences from the southern mountain (SM) and one sequence from the southern slope (SL). As the study of Port-des-Lamberts was performed some years before the others, NPPs have not been considerate there. The values of AIP have been calculated according to pollen taxa only. (b) Six sequences from the northern hills (NH).
GM: Grand-Montarnu; PL: Port-des-Lamberts; SY: Sources de l’Yonne; P: Poil; VB: Verny-des-Brûlons; EB: Etang Bouquin; LV: Le Vernay; N: Nataloup; M: Montbé; CG: Champ Gazon; AIP: anthropogenic impact phase.
impact is moderate, but a clear decrease in the Fagus curve is registered at Port-des-Lamberts (PL-transition AIP-3 to AIP-4).
During the early Iron Age (3500–2400 cal. BP), pollen and fungal human indicators are present but scarce, with a high AP/T ratio and low percentages of apophytes and anthropochores. This is obvious in the SM at Grand-Montarnu, Port-des-Lamberts (GM: middle part of AIP-8 and PL: second half AIP-4 and AIP-5) and in the sequence of Sources de l’Yonne that begin at around 2600 cal. BP (SY-1), and in the NH at Champ Gazon where anthropochores disappear anew (CG-12). The same situation characterizes Nataloup, except a punctual but strong fall of Fagus percentages around 2500 cal. BP (N: end of AIP-3). In Montbé, at the same time, a more important and long-lasting impact is high-lighted by a Fagus curve below 50% and increasing percentages of anthropochores, apophytes and Sordaria spores (M-4). During the second Iron Age (2400–1900 cal. BP), a concordant and strong anthropogenic impact can be observed for the first time throughout all the diagrams (PL: first half of AIP-6 and SY-2 and SY-3, GM: second half of AIP-8, VB: second half of AIP-1, N: end of AIP-4, CG: transition AIP-13/AIP-14, M-6 and N: first
half of AIP-5). This is especially obvious in the SM, in the two peat deposit located in the vicinity of the Yonne Springs, Port-des-Lamberts and Sources de l’Yonne (PL-6 and SY-3). This anthro-pogenic impact combines different pollen and fungal agro-pastoral indicators and woodland openness, and increases until the begin-ning of the following period. Castanea appears for the first time.
Roman period (c. 2000–1500 cal. BP to c. 50 cal.
bcto 500 cal.
ad)
(Figure 3: Grand-Montarnu: AIP-9, Port-des-Lamberts: AIP-6 and AIP-7, Sources de l’Yonne: AIP-4, Champ Gazon: AIP-14 and AIP-15, Nataloup: AIP-4, Verny-des-Brûlons: AIP-1, Montbé: AIP-1 to AIP-6 and Etang Bouquin: AIP-1)
Roman time is characterized by contrasting situations through-out the Morvan Massif. In the SM, the Roman impact grows slightly compared to the late Iron Age on the sequence of Grand-Montarnu where the AP curve clearly decreases (GM: upper part of AIP-8 and AIP-9), and in Port-des-Lamberts (PL: upper part of AIP-6 and beginning of AIP-7) where crop indicators increase.
Table 4. Pollen and NPP inferred degree of human impact for each AIP in the 10 diagrams.
CG - AIP 1 2 3 4 5 6 7 8 9 10 11 12 13 14 15 16 Open. 0 2 1 1 0 1 1 0 1 0 1 1 1 1 Direct I. 0 0 0 2 0 2 2 2 2 0 0 2 2 4 Indirect I. 1 1 1 1 2 2 1 1 1 1 1 2 2 2 Total 1 3 2 4 2 5 4 3 0 2 1 3 0 0 1 1 4 1 2 5 5 7 1 2 3 4 5 6 7 8 Open. 0 1 1 2 2 2 2 1 Direct I. 2 2 2 2 4 4 4 2 Indirect 1 1 2 1 2 1 2 1 Total 3 4 5 5 8 7 8 4 V - AIP 1 2 3 4 5 6 7 8 9 10 11 Open. 0 0 0 1 0 0 0 1 0 1 0 Direct I. 0 0 2 0 2 2 2 2 0 1 1 Indirect I. 0 1 1 2 1 1 2 2 1 2 1 Total 0 1 3 3 3 3 4 5 1 4 2 1 2 3 4 5 6 7 Open. 1 2 0 1 2 2 0 Direct I. 2 2 2 2 2 4 2 Indirect I. 1 2 1 2 2 1 1 Total 4 6 3 5 6 7 3 VB - AIP 1 2 3 4 5 6 7 8 9 Open. 0 0 1 1 2 3 3 2 1 Direct I. 2 0 2 2 2 2 4 4 4 Indirect I. 1 1 1 1 1 2 1 1 2 Total 3 1 4 4 5 7 8 7 7 N - AIP 1 2 3 4 5 6 7 8 9 10 Open. 1 1 0 1 1 1 2 2 2 3 Direct I. 1 1 0 2 0 2 2 2 4 2 Indirect I. 1 1 2 2 2 1 2 1 2 2 Total 3 3 2 5 3 4 6 5 8 7 M - AIP 1 2 3 4 5 6 7 8 9 10 11 12 Open. 0 1 1 1 0 1 1 0 2 1 2 0 Direct I. 0 2 2 0 0 2 2 2 2 2 4 2 Indirect I. 0 1 1 1 1 2 1 1 0 1 2 1 Total 0 4 4 2 1 5 4 3 4 4 8 3 GM - AIP PL - AIP 1 2 3 4 5 6 7 8 9 10 11 Open. 1 1 2 1 1 1 0 1 2 2 2 Direct I. 0 2 4 0 4 4 4 4 4 4 4 Indirect I. 1 1 2 2 2 1 2 2 2 2 2 Total 2 4 8 3 7 6 6 7 8 8 8 SY - AIP 1 2 3 4 5 6 7 8 9 10 11 Open. 0 1 1 0 1 2 2 2 1 2 0 Direct I. 2 2 2 2 2 2 4 2 4 4 2 Indirect I. 1 1 1 1 1 2 2 1 2 2 1 Total 3 4 4 3 4 6 8 5 7 8 3 1 2 3 4 5 6 7 8 9 Open. 2 2 2 2 2 2 2 2 2 Direct I. 2 4 4 4 8 8 8 4 4 Indirect I. 1 1 2 2 2 2 2 2 2 Total 5 7 8 8 12 12 12 8 8 P - AIP
SL
SM
NH
EB - AIPValues attributed to Direct Anthropogenic Indicators: 0– Absent; 2 – Discrete; 4 – Present; 8 – Abundant Values attributed to Indirect Anthropogenic Indicators: 0- Absent; 1 – Discrete; 2 – Present; 3 – Abundant
Values attributed to openness, according to the AP/NAP ratio: 0- None; 1 – Slight; 2 – Important; 3 – Very important
On the contrary, in the Sources de l’Yonne (SY-4), crop indicators totally disappear and grazing indicators remain low. Beech pollen percentages remain stable even if the AP pollen percentages increase (due to Salix – willow, Corylus – hazelnut and Quercus – oak, which are not represented on the anthropogenic synthetic diagrams, but can be found in Jouffroy-Bapicot (2010)).
In the NH, the Roman period is characterized by an anthro-pogenic impact that is comparable to those of the late Iron Age, or that increases (EB-1, VB-2, N-4, CG-14, M-7). Each dia-gram shows a decrease in AP mainly driven by the decrease of Fagus.
The perception of human activities and occupation is also contrasted at the end of the period, during the late Antiquity (3rd and 4th centuries ad). For example, in the NH, a
decreas-ing trend in crop indicators is observed at Nataloup (N-5), despite the continuous decrease of the AP curve. On the con-trary, at Champ Gazon (CG-first sample of AIP 5), the Fagus rise again, whereas crop and grazing indicators persist. During this period, and to a lesser extent during the whole Roman period, the detailed timing of vegetation changes must be con-sidered with caution because the time resolutions of the avail-able sequences are unequal, and are in some case very low (e.g. VB-2).
The Middle Ages (c. 1500–500 cal. BP to c. 500–
1500 cal.
ad)
(Figure 3 – Grand-Montarnu: AIP-10, Port-des-Lamberts: AIP-7 to 9, Sources de l’Yonne: 5 to 7, Poil: 1 to AIP-6, Champ Gazon: AIP-15 and AIP-1AIP-6, Nataloup: AIP-5 to AIP-7, Verny-des-Brûlons: AIP-3 and AIP-4, Montbé: AIP-7 to AIP-9 and Etang Bouquin: AIP-2)
Almost all the sequences from the Morvan Massif record the impact of human settlement during the first part of the Mediaeval period (1500–1000 cal. BP). In the SM, the transition between the late Antiquity and the early Middle Ages is related to an increasing presence of anthropochores and apophytes pollen (PL-7 and SY-5). Slightly later, an increase of coprophilous fungi is also recorded at SY and correlates with a decrease of AP below 50%. In the NH, agro-pastoral indicators rise and the openness of wood-land occurs later: around 1200 cal. BP at Champ Gazon (CG: upper part of AIP-15), Nataloup (N-6) and Montbé (M: transition AIP-8/AIP-9). On the contrary, the AP/T percentages remain steady at Etang Bouquin (EB-4) and increase at Verny-des-Brûlons (VB-4). Then, during the second part of the Middle Ages (classic and late Middle Ages 950–500 cal. BP), the presence of human indicators is steady or increasing in the NH. The rise of the AP values in the peat deposit from the SM (GM-10, PL-8 and SY-6) is due to Betula percentages increase (Jouffroy-Bapicot, 2010).
The onset of peat accumulation begins around 1500 cal. BP on the southern slope of the massif at the little sedge-fen of Poil. Pol-len analyses give a detailed evolution of vegetation during the Middle Ages (P: AIP-1 to AIP-3), showing an increasing impact of agro-pastoral activities. Percentages of Fagus pollen are much lower here than in other sequences. Pollen and fungal remains indicate agro-pastoral pressure, and the percentages of crop pol-len reach 8% at the end of the AIP P3. While only some occur-rences of Castanea pollen appear on the diagrams from the Morvan Massif since the 1st century ad, the presence of this taxa
at Poil is continuous, with low but increasing percentages. From c. the 11th to 15th century, agro-pastoral indicators reach a maxi-mum by combining anthropochores pollen grains and a large amount of coprophilous fungi, particularly Sporormiella and Sor-daria. The percentages are high, with a maximum of 40% of the TLP sum in AIP P-5.
Modern times (c. 500 cal. BP to present to c. 1500
cal.
adto present)
(Figure 3 – Grand-Montarnu: AIP 11 and AIP-12, Port-des-Lamberts: 9 to 12, Sources de l’Yonne: 7 to AIP-11, Poil: AIP-7 to AIP-9, Champ Gazon: AIP-16, Nataloup: AIP-8 and AIP-9, Verny-des-Brûlons: AIP-4 to AIP-7; Montbé: AIP-9 and AIP-10 and Etang Bouquin: AIP-3 to AIP-8)
As mentioned above, even if this period is unevenly docu-mented by the pollen spectra (three samples during this timespan at Champ Gazon versus 16 samples at Poil), a decreasing trend of arborean pollen is noted at the scale of the massif. A gradual and permanent decline in the forest cover begins during the 16th cen-tury and persists until the 19th cencen-tury. The AP curves drop below 50% of the TLP sum almost everywhere on the massif. The decrease is especially strong in the SM (GM-11, PL-10, SY-8) and in the extreme northern part of the massif (VB-5, EB-4). It is less important elsewhere in the NH, at Nataloup and Montbé (N-8, M-9), and moreover at Champ Gazon, where the percentages of arborean pollen, particularly of Fagus pollen, remain high, evoking a wooded zone persisting around the peat deposit (CG-16). The agro-pastoral indicators remain stable or show a moderate increase (GM-11, CG-14). Cultivated trees, Juglans and especially Castanea, increase everywhere. The per-centages of chestnut tree remain moderate in SM as in NH, but they reach a maximum during the 16th century in the SL, with more than 40% of the TLP sum (P-7). Later, the curve decreases regularly, from the end of the 16th century to the present-day. In the Morvan Massif, from north to south, the anthropogenic impact reaches maximum values during the 17th and 18th centu-ries, especially due to the dramatic decrease in Fagus. The upper parts of the diagrams show an overall decrease in crop indicators, and the arborean pollen increases anew. Some sites still have fun-gal and pollen indicators of pastoralism: Nataloup and Montbé in the NH (N-9 and M-10) and Sources de l’Yonne in the SM (SY-11). These peat deposits and their close surroundings are cur-rently used for cattle grazing. Overall, arborean pollen increases again with percentages of Pinus and Picea that are higher than ever during the studied period.
Discussion
Discriminating local versus regional impacts
The comparison of the 10 diagrams and of the time series com-piled in Figure 4 makes it possible to observe the spatio-tempo-ral variability of human impact at the regional scale. Some events, recorded at one single site, are absent from others located at only a few kilometres. For example, it is obvious in the NH during late Bronze Age (Figures 3 and 4). This pinpointed the very local palaeoecological information provided by each small peat deposit (Sugita, 1998). However, some trends at the scale of the massif, or at the SM versus NH scale, are notable and will be detailed below. The sequence located on the southern slope (Poil) has a more marginal situation than the others. The magni-tude of human impact during historic times is obviously higher than on the rest of the massif, the beech/oak forest is not notice-able and land uses seem different. This singular pollen diagram evidences the homogeneity of the others. It is worth mentioning that on the Morvan Massif, the woodland remains important throughout time, characterized by a beech/oak forest and a mod-erate agro-pastoral impact.
One limit of this approach is the chronological control. Despite the number of radiocarbon dating, the compaction of some peat cores does not allow us to detail the reconstruction. Because of the discrepancy of time resolution between each sequence, some decennial or multidecennial events recorded by one core might
not appear in others. However, some trends are clear and allow the identification of key phases in the vegetation history of the massif that may be related to human pressure and that can be com-pared to major Holocene climate dynamics.
The main features of the vegetation history
Signs of human impact appear from the beginning of the early Neolithic. These impacts are moderate, with values from 3 to 4 (Figure 4). They are sparse, short-lived and generally without sig-nificant openings in the woodland. The palaeoecological data illustrate a widespread but moderate and scattered agro-pastoral impact during the middle Neolithic, followed by a transition towards a concentration of human impact around one site in the late Neolithic, the bog of Champ Gazon. The only well-known
archaeological site from the late Neolithic and the early Bronze Age in the Morvan Massif is located 3 km from the peat deposit (Martineau et al., 2011). This observation is consistent with a spa-tial analysis of archaeological data at the Burgundy scale, which concludes in a territorial concentration during the late Neolithic (Pillot et al., 2013).
The presence of pastoral activities in the vicinity of the peat deposits during Prehistory remains unclear. Ecological changes at the peatland scale are obvious (e.g. at Champ Gazon), but the role of human society cannot be clearly associated because of the lack of robust local indicators of grazing, namely, the ascospores of Sporormiella (Baker et al., 2013). In the Morvan Massif, the gen-era Sordaria and Cercophora are the most common coprophilous fungi, and they coincide with, or lag slightly behind, the first human disturbances recorded by pollen analysis (Jouffroy-Bapicot, 2010). But these fungi are associated with decaying
Early Bronze A. Late Neolithic Middle Neolithic Early
Neolithic Mid.B. A. Romanperiod
Classic & Late M. Ages Early M. Ages Modern Late Bronze A. 50 450 850 1350 1650 3200 2300 5000 4500 450 1000 1492 Early Iron A. Iron A.Late
P SY 0 2 4 6 8 GM 0 2 4 6 8 Hiatus PL 0 2 4 6 8
NH
SM
SL
VB 0 2 4 6 8 EB 0 2 4 6 8 M 0 2 4 6 8 0 2 4 6 8 CG N 0 2 4 6 8 V 0 2 4 6 8 Hiatus Little Ice Age Medieval Optimum Roman Warm Period HoloceneOptimum Neoglacialonset
Extra-local dynamic Local dynamic
Anthropogenic Impact Phases chronological uncertainty margin according to the min/max interval 95% main curve according to
the best date of the calibration
2000 1500 1000 500 0 2500 3000 3500 4000 4500 5000 5500 6000 6500 7000 7500 2000 1500 1000 500 0 2500 3000 3500 4000 4500 5000 5500 6000 6500 7000
cal BP
cal BC/AD
cal BP
BC/AD 500 1000 1500 2000 500 1000 1500 2000 2500 3000 3500 4000 4500 5000 Main climatic variations Chrono-cultural phases 0 2 4 6 8 10 12 14Figure 4. Human impact on the vegetation of the Morvan Massif during 7000 years. Chronological representation of the AIP quantifications
from the 10 pollen diagrams. The main climatic variations of the mid–late Holocene are depicted in the following: Büntgen et al. (2011), Joerin et al. (2006, 2008) and Magny (2004). In black: colder and wetter phases.
NH: northern hills; SM: southern mountains; SL: southern slope; VB: Verny-des-Brûlons; EB: Etang Bouquin; LV: Le Vernay; N: Nataloup; M: Montbé; CG: Champ Gazon; GM: Grand-Montarnu; PL: Port-des-Lamberts; SY: Sources de l’Yonne; P: Poil.
wood as well as dung. In recent studies performed in peat deposits from different geographical areas, Cercophora and Sordaria are mentioned during the initial phases of anthropization, for exam-ple, in Greenland (Schofield and Edwards, 2011) or in the north of Spain (Ejarque et al., 2010; Lopez-Merino et al., 2010; Mighall et al., 2006). Different interpretations are suggested by the authors: wild herbivores, domestic livestock, decaying wood and/or leaves on the substrate. In testing modern samples in the Morvan, a large amount of these genera have been found (1) in the dung of high-land cattle grazing at the present time in peaty meadows, (2) in moss pollsters collected in the grazing area (Jouffroy-Bapicot, 2010) and (3) in the upper part of the studied sequences where cattle are grazing nowadays. Nevertheless, in modern samples, these genera are always associated with Sporormiella. Even if fungal associations dominated by Cercophora and/or Sordaria seem evenly linked to human disturbances, further studies are needed to better understand their significance, and more gener-ally, the significance of assemblages of coprophilous fungi asco-spores without Sporormiella, and to assess the extent to which they could be related to grazing pressure.
Studies combining palynology and geochemical analyses on 3 of the 10 sequences from the Morvan Massif have underlined the attractive role of mining resources during the Metal Ages (Jouffroy-Bapicot et al., 2008; Monna et al., 2004). Atmo-spheric metallic micro-pollutants have been found as early as the early Bronze Age/middle Bronze Age or late Bronze Age at different places in the SM (c. 1600–900 cal. bc). During the
Bronze Age, these activities led to localized and moderate impacts on woodland, and agro-pastoral indicators remain moderate on the whole.
Later, during the early Iron Age, a period poorly documented by archaeology, the presence of human activities is highlighted by geochemical clues of metallurgical activities in the vicinity of Grand-Montarnu, and pollen and fungal agro-pastoral indicators throughout the massif. Anthropogenic impact as well as metallic pollutions increase during the late Iron Age, and reach a maxi-mum during the two last centuries bc. This period corresponds to
the Aeduan period and the occupation of Bibracte, where metal working is well-known (Guillaumet and Dhennequin, 2008). In addition to archaeological knowledge, palaeoecological studies highlight both the regional scale of this human pressure dynamic, as shown in Figure 4, and the presence of agro-pastoral activities, even in the highest part of the massif. Recent archaeological sur-veys in the close vicinity of the Yonne’s springs resulted in the discovery of a large settlement (80 ha), probably connected to the oppidum of Bibracte, and characterized by a short occupation between 50 and 20 bc (Haupt et al., 2007). The palaeoecological
data show that the construction of the agglomeration took place in a previously wide open area, related to agro-pastoral activities.
Palaeoecological data suggest that the Roman conquest led to a reorganization of land uses. On the whole, agro-pastoral pres-sure remains moderate in the massif, while a decrease in wood-land pollen occurred during at least the 3 first centuries ad, and
could be more sustainable around some sites (e.g. Nataloup in the NH and Port-des-Lamberts in the SM), until the late Antiquity. Beech is then the main species affected by woodland exploitation. In the SM, after the abandonment of both the oppidum of Bibracte and the agglomeration around the Yonne’s springs, archaeology has attested to a religious presence in the area, but nearby agro-pastoral activities are no longer registered by pollen and NPPs.
Considering the lack of archaeological data concerning the early Middle Ages, human impact, as early as the 5th century ad
in the SM, is surprisingly strong during this period. The early Middle Ages seem to be a new phase of agro-pastoral expansion at the scale of the massif. This period is known for cold and high moisture climate, which may offer poor conditions for agricul-ture, and for socio-economic instability induced by the migration
of Germanic peoples (Büntgen et al., 2011). In the Jura Moun-tain, for example, this period clearly corresponds to a rural aban-donment and forest return (Gauthier, 2004; Gauthier and Richard, 2007). The Morvan, as well as other places on the edge of the French Massif Central (Miras, 2004), seems to be less affected, perhaps because it is located further from the main migration roads, and/or because Atlantic climatic influences, combined with lower altitudes, attenuated the cooling effect compared to the Jura and Alps mountains. Human pressure during the follow-ing Mediaeval period (11th to 15th centuries) appears in the con-tinuation of the early Middle Ages, evoking an early formation of agricultural territories in the Morvan. From the Middle Ages on, major monastic centres are located in north Morvan, namely, Vézelay and the abbey of la Pierre-qui-Vire. Nevertheless, the lack of recent published data about this topic did not permit to consider their role in the human land use in the NH. Deposits of atmospheric micro-pollutants, recorded in the southern and the northern part of the massif, may be due to a new mining and metal working phase operated on a regional scale. However, the influence of a supra-regional pollution must be taken into account for this period as well (Jouffroy-Bapicot et al., 2008).
The palynological data indicate the cultivation of chestnut trees on the southern slope probably since the early Mediaeval period. Later, chestnut production seems to have an important part in Mediaeval and modern land use in south Morvan. The cul-tivation of chestnut for food supply was well-known in the Mor-van during the 19th century, and it is known that the thin and acidic soils of the Morvan are, in general, not suitable for cereal cultivation. The pollen data indicate that in this part of the Mor-van, as elsewhere in Western Europe according to historical (Pitte, 1986) and palynological (Conedera et al., 2004) data, the cultiva-tion of chestnut flourished from the 11th to the 16th century. The high range of Castanea percentages (from 10% to 40%), during at least four centuries, attests to the cultivation of chestnut trees in orchards, probably for the production of staple foods. Crop culti-vation and/or breeding were also locally important during this period. In addition to the high percentages of cultivated plants, the palaeoecological analysis evidences a large amount of coprophi-lous fungi. The quantities are much higher than those found in other samples, even those of the same sequence. This might not be due to a variation of concentration because the age–depth model suggests a regular accumulation rate. Soil amendment in the watershed could also explain the quantity of dung-related fun-gal spores, especially when the proximity of cultivated fields is shown by taxa such as Centaurea cyanus (Jouffroy-Bapicot, 2010), a weed which is a strong local indicator of cultivation (Brun, 2011).
At the end of the 16th century, the development of the timber floating industry in the Morvan Massif and its flood transport to Paris sustainably promoted woodland at the expense of agricul-tural land (Poux et al., 2011). It is also worth mentioning the activity was a key phase in the formation of the Morvan land-scape. The dramatic decrease in beech observed throughout the pollen records does not necessarily attest to a completely defor-ested landscape but rather depredated woodland. Beech trees, coppiced to produce firewood for Paris may have had a very low pollen production. The long-term exploitation of the beech forest drove palaeoecological changes from the 18th to the early 20th century, but it does not seem to have been homogenous at the regional scale. It appears stronger in the SM than in the NH, except in the vicinity of the ponds used for floating (EB and VB). These two sites had a very similar palaeoecological history for at least the last five centuries, probably related to their role in the floating process.
In the upper part of the diagrams, pollen spectra from the past 70 years show a decrease in human pressure on landscape, which is, at least in part, in concordance with the historical trend
of depopulation of the Morvan. A rural exodus began in the mid-20th century. Modern pollen spectra illustrate the current wood-land extensively replanted after the collapse of the firewood activity around 1900. The woodland which covers roughly one half of the massif at present is mainly an artificial forest. Trees planted are mainly coniferous trees, indigenous but rare species such as spruce, or introduced species, mainly Douglas-fir and larch. All of them have very low pollen productivity and disper-sion. Moreover, these species are often young cutting, that is, before flowering, such as Christmas trees. This current situation demonstrates the problem of perceiving some type of land use based only on pollen analysis, such as forest management.
Climate drivers as favouring or limiting factors
The comparison of anthropogenic pressure with the main phases of climate changes, resumed from independent proxies such as lake-level fluctuations (Magny, 2004), tree-ring series (Büntgen et al., 2011) or glacier fluctuations (Joerin et al., 2006, 2008) in Figure 4, emphasizes the extent to which climate drivers acted as favouring or limiting factors in human history. Pre- and Protohis-toric agro-pastoral societies are potentially sensitive to climate change. In the Morvan, the decrease of anthropogenic indicators during the middle Neolithic in the SM coincides with the Neogla-cial onset. However, the same trend is not obvious in the NH. Moreover, just one core provides information here, with a low time resolution, and it is difficult to make a direct link with the cooler and moister climate. The decrease in human pressure dur-ing the middle Bronze Age, a cool and moist phase corresponddur-ing to an abandonment of lacustrine habitats in the Jura and the Alps (Magny, 2004; Magny et al., 2007), is more obvious at the scale of the Morvan Massif. Nevertheless, the absence of a robust archaeological data set implies a cautious interpretation in terms of the settlement of the whole massif: the decrease in anthropo-genic indicators in the diagrams may also reflect a decrease in the attractiveness of the area surrounding the wetlands rather than a decline in human pressure at the regional scale.
The increasing human impact during the late Iron Age and the Roman period in the Morvan is in keeping with the middle Euro-pean trend which coincides with a wetter and warmer climate (Büntgen et al., 2011). Moreover, sociocultural conditions may also be of primary importance at this time. For example, it has been shown that the attractiveness of the Morvan is also due to its mineral resources. This activity is less impacted by climate driv-ers than agriculture.
The impact of the ‘Little Ice Age’ on the Morvan Massif is not clear, probably mainly because of the specific land use prevalent on the massif at that time. The exploitation of firewood relegates agro-pastoral activities to a marginal activity. Moreover, the tim-ber floating industry in the Morvan strongly depended on socio-economic drivers: it began because of the depredation of woodland near Paris, and the end of the activity is related to the preference for coal as heating fuel.
Finally, it is worth mentioning that the period during which the cultivation of chestnut tress flourished on the southern slope of the massif coincided with the Mediaeval Climate Optimum. Favourable climate conditions may have facilitated this cultiva-tion, which was at the edge of the known chestnut production area during the late Middle Ages and modern times (Conedera et al., 2004; Pitte, 1986).
Conclusion
The palaeoecological investigations performed on 10 cores from the Morvan Massif add to our knowledge of human history in this middle mountain area. They reveal a clear human presence during
periods that were formerly poorly documented, such as the onset of the Neolithic period, the Bronze Age, the early Iron Age and the early Middle Ages. They also provide new data about better known periods such as the widespread occupation of the massif in the late Iron Age; the importance of chestnut cultivation, probably in orchards, on the southern slope of the massif from the 11th to the 16th century; or the impact of modern firewood exploitation on the forest. In this kind of environment, palaeoecological stud-ies offer the opportunity to obtain information about human his-tory when archaeological and historical data are scare and/or difficult to obtain. The quantification of human impact allowed a site-by-site comparison, and the identification of regional and intra-regional trends, which is not possible or more uncertain when palaeoecological information comes from a single core. The human land-use pattern during the last seven millennia is typical of middle mountain areas. Acidic and thin soils are not suitable to the development of widespread agriculture, so that periods such as the late Neolithic, the Roman period and the 20th century are marginal. In contrast, the major phases are related to the exploita-tion of natural resources, such as minerals during the Metal Ages or wood during the modern times.
Acknowledgements
This work was carried out as part of the programme ‘Envi-ronnement du Mont-Beuvray’ of the European archaeological Centre of Mont-Beuvray, Bibracte (Burgundy, France). We thank all the persons involved in this programme, especially B. Forel and J-P. Guillaumet, and the ‘Bibracte team’, especially V. Guich-ard (General Director) and P. Paris (Archaeologist, assistant to the scientific director). We gratefully thank the two anonymous reviewers for their valuable comments and suggestions on the manuscript.
Funding
This research was also partly supported by the ACI Tepaneo pro-gramme of the CNRS, co-headed by R. Martineau, B. Vannière and M. Gabillot.
References
Baker AG, Bhagwat SA and Willis KJ (2013) Do dung fungal spores make a good proxy for past distribution of large herbivores? Quaternary Science
Reviews 62: 21–31.
Bardet O, Fédoroff E, Causse G et al. (2008) La flore sauvage de Bourgogne. Mèze/Paris: BIOTOPE/Muséum national d’Histoire naturelle.
Behre K-E (1981) The interpretation of anthropogenic indicators in pollen dia-grams. Pollen et Spores 23: 225–245.
Benoit P, Berthier K, Boët P et al. (2004) Les aménagements hydrauliques liés au flottage du bois, leur impact sur le milieu fluvial (XVIe-XVIIIe siècles). In: Burnouf J and Leveau P (eds) Fleuves et marais, une
his-toire au croisement de la nature et de la culture. Paris: CTHS, pp.
311–320.
Berglund BE (2003) Human impact and climate changes – Synchronous events and a causal link? Quaternary International 105: 7–12.
Beug H-J (2004) Leitfaden der Pollenbestimmung für Mitteleuropa und
angrenzende Gebiet. München: Pfeil.
Blaauw M (2010) Methods and code for ‘classical’ age-modelling of radiocar-bon sequences. Quaternary Geochronology 5: 512–518.
Brun C (2011) Anthropogenic indicators in pollen diagrams in eastern France: A critical review. Vegetation History and Archaeobotany 20: 135–142. Brun C, Dessaint F, Richard H et al. (2007) Arable-weed flora and its pollen
representation: A case study from eastern part of France. Review of
Pal-aeobotany and Palynology 146: 29–50.
Büntgen U, Tegel W, Nicolussi K et al. (2011) 2500 years of European climate variability and human susceptibility. Science 331: 578–582.
Cauuet B and Tamas C-G (2008) Les exploitations minières. In: Dhennequin L, Guillaumet J-P and Szabo M (eds) L’oppidum de Bibracte (Mont-Beuvray,
France). Bilan de 10 années de recherches (1996–2005). Budapest:
Aka-démiai Kiado, pp. 11–12.
Charman D (2002) Peatlands and Environmental Change. Chichester: John Wiley & Sons.