HAL Id: hal-00318099
https://hal.archives-ouvertes.fr/hal-00318099
Submitted on 3 Jul 2006
HAL is a multi-disciplinary open access
archive for the deposit and dissemination of
sci-entific research documents, whether they are
pub-lished or not. The documents may come from
teaching and research institutions in France or
abroad, or from public or private research centers.
L’archive ouverte pluridisciplinaire HAL, est
destinée au dépôt et à la diffusion de documents
scientifiques de niveau recherche, publiés ou non,
émanant des établissements d’enseignement et de
recherche français ou étrangers, des laboratoires
publics ou privés.
The role of post-sunset vertical drifts at the equator in
predicting the onset of VHF scintillations during high
and low sunspot activity years
S. Tulasi Ram, P. V. S. Rama Rao, K. Niranjan, D. S. V. V. D. Prasad, R.
Sridharan, C. V. Devasia, S. Ravindran
To cite this version:
S. Tulasi Ram, P. V. S. Rama Rao, K. Niranjan, D. S. V. V. D. Prasad, R. Sridharan, et al.. The
role of post-sunset vertical drifts at the equator in predicting the onset of VHF scintillations during
high and low sunspot activity years. Annales Geophysicae, European Geosciences Union, 2006, 24
(6), pp.1609-1616. �hal-00318099�
www.ann-geophys.net/24/1609/2006/ © European Geosciences Union 2006
Annales
Geophysicae
The role of post-sunset vertical drifts at the equator in predicting the
onset of VHF scintillations during high and low sunspot activity
years
S. Tulasi Ram1, P. V. S. Rama Rao1, K. Niranjan1, D. S. V. V. D. Prasad1, R. Sridharan2, C. V. Devasia2, and Sudha Ravindran2
1Space Physics Laboratories, Department of Physics, Andhra University, Visakhapatnam, India 2Space Physics Laboratory, VSSC, Trivandrum, India
Received: 28 December 2005 – Revised: 27 April 2006 – Accepted: 17 May 2006 – Published: 3 July 2006
Abstract. The day-to-day variability in the occurrence of
ionospheric scintillations, which are of serious concern in the trans-ionospheric communications, makes their predic-tion still a challenging problem. This paper reports on a systematic study in quantitatively identifying the precursors responsible, such as pre-reversal E×B drift velocity, geo-magnetic activity index (Kp) and the Equatorial Ionization
Anomaly (EIA) gradient, for the onset of VHF scintillations over a low-latitude station, Waltair (20◦N dip), during high (2001) and low (2004) sunspot activity years. The percent-age of occurrences of VHF scintillations over Waltair show a good correlation with the monthly mean post-sunset verti-cal drift velocities at the equator, during both the high and low sunspot activity years. During the days on which intense (>10 dB) scintillations occur, the ionization anomaly gradi-ent (dN/dL), measured from ionosonde data of an equatorial (Trivandrum, 0.9◦N dip) and an off-equatorial station (Wal-tair, 20◦N dip) shows an enhancement in the gradient prior to
the onset of the scintillations. However, this enhancement is not seen on days when the scintillations are weak (<10 dB) or absent. The day-to-day post sunset enhancement in the
E×B drift is found to decrease with increasing Kp-index and this decrease is more prominent in the equinoxes, less in winter and insignificant in the summer months. On a day-to-day basis, it is found that the value of the upward drift velocity at the equator should be ≥30 m/s for the onset of strong scintillations over Waltair for magnetically quiet days with average Kp≤2 (6 h prior to the local sunset) during the
high sunspot year, 2001. This threshold value of the upward drift reduces to 20 m/s with the decrease in the sunspot ac-tivity during 2004. Further, these conditions for the onset of intense scintillations is well defined in equinoxes, less in winter and least in the summer solstices.
Correspondence to: P. V. S. Rama Rao ([email protected])
Keywords. Ionosphere (Electric fields and currents;
Equa-torial ionosphere; Ionospheric irregularities)
1 Introduction
The equatorial and low-latitude ionosphere is the region where the most significant post-sunset ionospheric dynam-ics play a great role in the generation of irregularities caus-ing scintillations on trans-ionospheric radio communication signals. These processes are known by the generic name of Equatorial Spread-F (ESF). The processes responsible for the generation, growth and dynamics of ESF irregularities have been widely reported in several earlier studies carried out with different experimental techniques (Calvert and Co-hen, 1961; Woodman and LaHoz, 1976; Aarons et al., 1980). Measurement of scintillations is the simplest, most efficient and inexpensive diagnostic tool for probing the characteris-tics of the ESF irregularities, which are of serious concern in recent times under space weather and related studies.
Several earlier studies (Woodman and LaHoz, 1976; Yeh and Liu, 1982; Basu and Basu, 1985) on the general mor-phological features of scintillations revealed that the occur-rence of scintillations is controlled by local time, season, so-lar cycle, latitude, longitude and geo-magnetic activity. But the day-to-day randomness in the occurrence of scintillations makes their prediction still a challenging problem. However, some conditions have been identified to be responsible for the generation of ESF irregularities. These are: (i) a sharp gradi-ent at the bottom side of the F-layer, anti-parallel to the grav-ity acceleration vector (Kelley, 1989); (ii) the pre-reversal enhancement (PRE) in upward E×B drift and associated uplifting of the F-layer (Rishbeth, 1978; Fejer et al., 1999; Whalen, 2002); (iii) a simultaneous decay of the E-region conductivity at both ends of the field line (Tsunoda, 1985;
1610 S. Tulasi Ram et al.: The role of post-sunset vertical drifts at the equator
Figure. 1
Fig. 1: The correspondence between the monthly mean PRE ExB peak drift velocities (solid line) and percentage occurrence of VHF scintillations (vertical bars) during a high sunspot year 2001.
14 Fig. 1. The correspondence between the monthly mean PRE E×B
drift velocities (solid line) and percentage occurrence of VHF scin-tillations (vertical bars) during a high sunspot year 2001.
Stephen et al., 2002); and (iv) the trans-equatorial compo-nent of the thermospheric winds and the associated symme-try in the Equatorial Ionization Anomaly (EIA) (Maruyamma and Matuura, 1984; Maruyama, 1988; Mendillo et al., 1992, 2001).
Recent investigations by Basu et al. (1996), Fejer et al. (1999), Fagundes et al. (1999), Anderson et al. (2004) led to the question of whether the post-sunset enhancement in the upward E×B drift over the equator is the necessary and sufficient condition, or simply the necessary condition for creating favorable conditions for the generation of ESF. Fejer et al. (1999) have reported that when the drift velocities are large enough, the necessary seeding mechanism for the generation of strong Spread-F always appears to be present. Fagundes et al. (1999), from their 5-day experimental cam-paign, reported that, on one of the nights with a strong up-ward drift of the F-layer associated with the presence of a gravity wave at mesospheric altitudes resulted in strong plasma bubble irregularities. On another night when the up-ward drift was even stronger without any gravity wave ac-tivity, the bubble irregularities were much weaker. Further, Anderson et al. (2004) have reported that there appears to be a threshold value of E×B drifts (≈20 m/s) for the occur-rence of UHF scintillations with S4 >0.5. Fejer et al. (1999), Whalen et al. (2002), and Lee et al. (2005) have shown that the pre-reversal enhancement in the E×B drift velocities are reduced with increasing magnetic activity, as measured by a 6-hour average Kp-index, thereby reducing the occurrence
and/or intensity of the scintillations. They have also shown that the diminution in the vertical drifts with increasing Kp
is significant during the equinoxes and winter months, but is insignificant during the summer months.
This paper reports on the results of a systematic study carried out on the role of the pre-reversal enhancement in the upward E×B drift and the geo-magnetic activity
in-Figure. 2
Fig. 2: The correspondence between the monthly mean PRE ExB peak drift velocities (solid line) and percentage occurrence of VHF scintillations (vertical bars) during a low sunspot year 2004.
15 Fig. 2. The correspondence between the monthly mean PRE E×B
drift velocities (solid line) and percentage occurrence of VHF scin-tillations (vertical bars) during a low sunspot year 2004.
dex (Kp) for the development/inhibition of ESF
irregulari-ties and quantitatively describes the precursors for the oc-currence/absence of scintillations on a night-by-night basis during the high and low sunspot years of 2001 and 2004, re-spectively.
2 Observations and approach
Two digital ionospheric sounders have been operated simul-taneously, one at an equatorial station Trivandrum (8.47◦N, 76.91◦E, 0.9◦N dip) and another at an off-equatorial sta-tion Waltair (17.7◦N, 83.3◦E, 20◦N dip), and the iono-grams are recorded at 15-min intervals during the relatively high and low sunspot years, 2001 and 2004, respectively. During the same periods, amplitude scintillations at VHF (244 MHz) have also been recorded from a geostationary satellite FLEETSAT (73◦E) at Waltair.
The pre-reversal enhancement (PRE) in the upward E×B drift is derived by measuring the height of the 4 -MHz re-turn signal and measuring the height rise in a given time in-terval at the magnetic equator (Anderson et al., 2004). In the present study, the height of the 4 -MHz return signal can be taken as the true height (since the difference between the true height and the virtual height is very small at this low frequency), which corresponds to the altitudes where the electron density is approximately 2×10⁵el/cm3. The virtual height of the 4-MHz return signal (h’F) on the ionograms of the equatorial station Trivandrum is scaled at 15-min in-tervals, and the computed dh’F/dt during the post-sunset hours is considered as the pre-reversal enhancement in an up-ward E×B drift (herein after is called as PRE E×B drift). The principal causes for the height rise after sunset are: (i) the rapid post-sunset enhancement of the zonal electric field which leads to large vertical plasma drift (E×B) velocities,
thereby lifting the F-layer to a greater altitudes, (ii) the decay of the bottom side ionization due to chemical recombination in the absence of production by solar ionizing radiations af-ter sunset and (iii) the presence of equatorward meridional neutral wind which transports the ionization along the field lines, thereby lifting the F-layer to higher altitudes. At the magnetic equator, the effect of the meridional wind is unim-portant because the geo-magnetic field lines are horizontal. The height rise due to chemical losses is of the order of 5 m/s, and is negligible when compared to large vertical drift veloc-ities due to the pre-reversal enhancement (PRE) in the zonal electric field (Krishna Murthy et al., 1990; Basu et al., 1996; Anderson et al., 2004). Hence, the method adopted in com-puting the PRE E×B drift used in the present study is justi-fied.
3 Results
3.1 PRE E×B drifts and the occurrence of VHF scintilla-tions
With a view to examining the seasonal variation of post-sunset vertical drift of the equatorial F-region and its control over the occurrence of VHF scintillations, the PRE E×B drift velocities are derived from the ionosonde data recorded at Trivandrum (0.9◦N dip). The monthly mean peak drift ve-locity is computed by taking the maximum dh’F/dt between local sunset (18:00 h local time) and the onset time of the Spread-F on each day, and is averaged for a month. The per-centage occurrence of VHF scintillations at Waltair (20◦N
dip) is computed as the ratio of the number of days on which post-sunset (18:00–22:00 h local time) scintillations occurred to the total number of days for which data is available. In Fig. 1, the monthly mean PRE peak E×B drift (solid line with error bars) is shown, as well as the percentage occur-rence of VHF scintillations (vertical bars) at Waltair for each month during a high sunspot year, 2001. During this year, the monthly mean sunspot number (Rz) varies from a
mini-mum of 80.6 during February 2001 to a maximini-mum of 150.7 during September 2001. The peak drift velocities are shown on the left-hand side of the y-axis and the percentage occur-rence of the scintillations is shown on the right-hand side of the y-axis.
From the figure, it is seen that the percentage occurrence of VHF scintillations shows a good correspondence with the monthly mean PRE peak E×B drift velocity and also ex-hibits a clear seasonal variation with prominent equinoctial maxima followed by winter and with a minimum in summer. The mean vertical drift velocity exhibits peak values during equinoctial months (March, April, September and October) and also during the month of November 2001. During the month of November 2001, the percentage occurrence of scin-tillations (93%), as well as the corresponding mean PRE
E×B peak drift velocity is maximum (48.27 m/s). On the
other hand, both the mean peak vertical drift velocity and the percentage occurrence of scintillations are greatly reduced during the month of May and the summer months of June, July and August, with minimum values of 15.47 m/s and 13%, respectively, during June 2001. These results are con-sistent with the results of Fejer et al. (1999), who reported that the largest and smallest vertical drift velocities do occur during equinoxes and June solstices, respectively.
Figure 2 shows the association of the mean PRE peak
E×B drift velocity with the percentage occurrence of VHF
scintillations during a low sunspot year, 2004. During this period, the monthly mean sunspot number (Rz) varies be-tween a minimum of 17.3 during December 2004 and a max-imum of 51.1 during July 2004. It is seen from this figure that both the mean vertical peak drift velocities, as well as the percentage occurrences of scintillations are reduced signifi-cantly as the sunspot number decreases from the years 2001 to 2004. However, the seasonal variation in both the vertical drifts and the percentage occurrences still show maxima dur-ing the equinoxes, less in winter and a minimum in the sum-mer months. The percentage occurrence of VHF scintilla-tions observed at Waltair also shows a good correspondence with the monthly mean PRE E×B peak drift measured at Trivandrum. Thus, Figs. 1 and 2 suggest that the PRE E×B peak drift at the equator is one of the most important parame-ters that control the scintillation activity at off-equatorial sta-tions like Waltair (20◦N dip), during both solar cycle epochs. It may be seen from Fig. 2 that although the monthly mean sunspot numbers (Rz) of the month of May (41.5) and the summer months of June (43.2), July (51.1) and Au-gust (40.9) are higher than those of the equinoctial months of April (39.3) and September (27.7), the percentage occur-rence of scintillations is much higher during equinoxes than during summer months, suggesting that the seasonal control on the occurrence of scintillations is more dominant than the sunspot number control during this low sunspot activity year, 2004.
3.2 The PRE E×B drift and the Equatorial Ionization Anomaly gradient
To examine the effect of post-sunset vertical (E×B) drift on the strength of the Equatorial Ionization Anomaly (EIA) and its impact on the occurrence and the intensity of scin-tillations, we have measured the anomaly gradient (dN/dL) from the ionosonde data of Trivandrum (TVM) and Wal-tair (WLT). The peak electron density of the F-layer (NmF2) at 15-min intervals has been computed from the foF2 data of both stations and the gradient (dN/dL), which is defined as (NmF2 at WLT – NmF2 at TVM) / (Geog.lat of WLT – Geog.lat of TVM), is evaluated for each 15-min interval. While computing the dN/dL, the local time difference, due to the longitudinal difference in the locations of the two sta-tions, is corrected to Indian Standard Time (IST).
1612 S. Tulasi Ram et al.: The role of post-sunset vertical drifts at the equator
Figure. 3
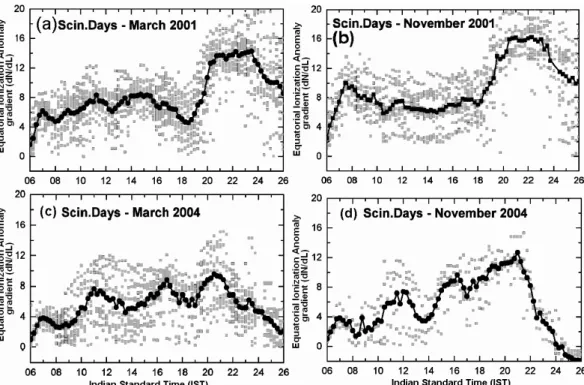
Fig. 3: The diurnal variations of the Equatorial Ionization Anomaly gradients (dN/dL) for the days on which strong (≥ 10 dB) scintillations have occurred during (a) March 2001, (b) November 2001, (c) March 2004 and (d) November 2004.
16
Fig. 3. The diurnal variations of the Equatorial Ionization Anomaly gradients (dN/dL) for the days on which strong (≥ 10 dB) scintillations
have occurred during (a) March 2001, (b) November 2001, (c) March 2004 and (d) November 2004.
Figure. 4
Fig. 4: The diurnal variations of the Equatorial Ionization Anomaly gradients (dN/dL) for the days on which scintillations are weak (< 10 dB) or absent during (a) March 2001, (b) November 2001, (c) March 2004 and (d) November 2004.
17
Fig. 4. The diurnal variations of the Equatorial Ionization Anomaly gradients (dN/dL) for the days on which scintillations are weak (<
10 dB) or absent during (a) March 2001, (b) November 2001, (c) March 2004 and (d) November 2004.
S. Tulasi Ram et al.: The role of post-sunset vertical drifts at the equator 1613 Figure 3 presents the diurnal variation of the anomaly
gra-dient for the days on which strong (≥10 dB) scintillations have occurred. Figures 3a and b correspond to the March and November months of the high sunspot year (2001), and Figs. 3c and d correspond to the March and Novem-ber months of the low sunspot year (2004), respectively. The gray points represent the actual data and the black line with dots indicates the average curve. It can be clearly seen from the figure that the anomaly gradients (dN/dL) show significant enhancements that start around post-sunset hours (18:00 IST) and increases rapidly from 18:00 to 21:00 IST. The rate of change of dN/dL, as well as the magnitudes of the anomaly gradients is significantly higher during the high sunspot periods than during the low sunspot periods. This is due to the larger post-sunset vertical drifts observed dur-ing the high sunspot year 2001 than durdur-ing the low sunspot year 2004, as may be seen from Figs. 1 and 2. Also, it is noticed from Fig. 3 that the post-sunset enhancement in the anomaly gradient (dN/dL) is higher in November 2001 (Fig. 3b) than during March 2001 (Fig. 3a), which is ev-idently due to larger PRE E×B drift velocities observed during November than during March (Fig. 1). The rapid enhancements in the anomaly gradients during the period 18:00–21:00 IST suggests that the large PRE E×B drifts at the equator causes a rapid uplifting of equatorial F-region, thereby resurging the equatorial fountain effect.
Figure 4 shows the diurnal variation of the anomaly gra-dient (dN/dL) for the days on which scintillations are weak (<10 dB) or absent. Figures 4a and b correspond to the March and November months of high sunspot year (2001), and Figs. 4c and d correspond to the March and November months of low sunspot year (2004), respectively. The post-sunset enhancements in the anomaly gradient are not seen in this figure, indicating that the PRE E×B drift velocities are not high enough to lift the equatorial F-layer to higher altitudes, depriving an energizing of the equatorial fountain. Thus, Figs. 3 and 4 clearly show the control of the PRE E×B drift velocities over the equator on the Equatorial Ionization Anomaly and the subsequent occurrence of VHF scintilla-tions at the off-equatorial station.
3.3 PRE E×B drift velocity, geo-magnetic index (Kp) and
the occurrence of VHF scintillations
The results shown in Figs. 1 to 4 clearly indicate that the PRE E×B drift is the most important parameter that con-trols the scintillation activity. To examine the day-to-day randomness in the occurrence of scintillations, a quantita-tive study is made in describing the role of PRE E×B drift and the geo-magnetic activity index (Kp) on the occurrence
or inhibition of scintillations. Figure 5 presents the PRE
E×B peak drift velocities measured over the equator on
each day during the high sunspot year, 2001, as a function of the corresponding geomagnetic activity index (Kp).
Fig-ure 5a corresponds to the equinoctial months (March, April,
Figure. 5
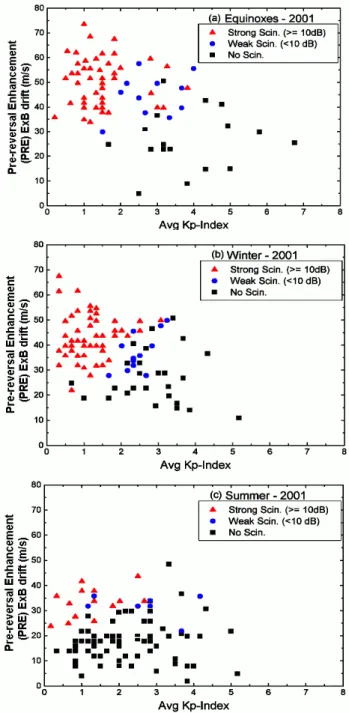
Fig. 5 : The Pre-reversal enhancement (PRE) ExB drift velocities as a function of the 6-hour average Kp, observed for each day during (a) equinoxes, (b) winter and (c) summer solstice months of high sunspot activity year, 2001.
18
Fig. 5. The Pre-Reversal Enhancement (PRE) E×B drift
veloci-ties as a function of the 6-hour average Kp, observed for each day
during (a) equinoxes, (b) winter and (c) summer solstice months of high sunspot activity year, 2001.
September and October), Fig. 5b corresponds to November and to the winter months (January, February and December) and Fig. 5c corresponds to May and to the summer months (June, July and August). The Kp-index shown on the
x-axis is the 6-h mean Kp-index value prior to the local sunset
(06:00–12:00 UT, which corresponds to 12:30–17:30 IST). The triangles indicate the PRE E×B peak drift velocities for the days on which strong (≥10 dB) post-sunset scintillations
1614 S. Tulasi Ram et al.: The role of post-sunset vertical drifts at the equator
Figure. 6
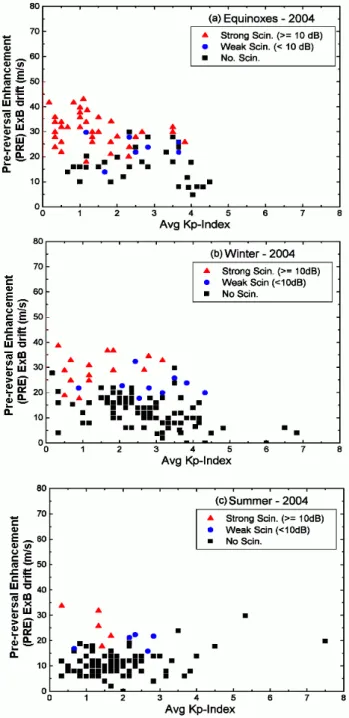
Fig. 6 : The Pre-reversal enhancement (PRE) ExB velocities drift as a function of the 6-hour average Kp, observed for each day during (a) equinoxes, (b) winter and (c) summer solstice months of low sunspot activity year, 2004.
19
Fig. 6. The Pre-Reversal Enhancement (PRE) E×B velocities’
drift as a function of the 6-hour average Kp, observed for each day
during (a) equinoxes, (b) winter and (c) summer solstice months of low sunspot activity year, 2004.
have occurred. The circles represent the weak (<10 dB) scin-tillation days and the squares represent the days on which there is no scintillation occurrence. From these plots, it can be seen that, for the magnetically quiet days (average Kp≤2),
strong post-sunset scintillations are found to occur whenever the PRE E×B peak drift is ≥ 30 m/s. Also, during the days on which the PRE E×B drift is greater than 30 m/s but the
average Kp lies between 2 and 4, there is an equal
proba-bility in the occurrence of strong, weak or no scintillation events to occur even when the vertical drift velocity exceeds the threshold value of 30 m/s. However, when the PRE E×B drift is less than 30 m/s and/or the average Kpis greater than
4, scintillation is very rarely observed.
In Figs. 5a and b, during equinoctial and winter months, respectively, it is also observed that the vertical E×B drift velocities decrease with increasing Kp and this feature is
more pronounced during the equinoctial months (Fig. 5a). However, this decrease in drift with increasing Kpis not seen
during the summer months (Fig. 5c).
Similarly, Fig. 6 shows the drift velocities for each of the days as a function of an average Kp-index during the low
sunspot year 2004. From the plots of this figure (a, b and c), it is noticed that there also exists a threshold value of 20 m/s of the PRE E×B peak drift velocity which causes strong (≥ 10 dB) scintillations during the magnetically quiet days (average Kp≤2). But for the days on which the average Kp-index is between 2 and 4, the strong, weak or no
scin-tillation events are distributed with nearly equal probability, even though the PRE E×B peak drift velocity exceeds the threshold value of 20 m/s. It is interesting to note here that the threshold PRE E×B drift for the generation of irregular-ities decreases from 30 m/s during the high sunspot activity year 2001 to 20 m/s during the low sunspot year 2004.
Also during the low sunspot year, it is seen that the post-sunset upward drift velocities decrease with increas-ing magnetic activity (Kp-index), more significantly during
equinoxes (Fig. 6a) followed by the winter months (Fig. 6b). However, during the summer months, this decrease of drift velocities with an increasing Kp-index is not visible.
In this study a total of 259 days with simultaneous data of PRE E×B drift measured from Trivandrum and VHF scin-tillations recorded at Waltair was considered during the high sunspot year, 2001. Out of these 259 days, on 114 nights (53 during equinoxes, 47 during winter and 14 during summer months), strong ( ≥10 dB) post-sunset scintillations were ob-served. During the equinoctial months (Fig. 5a), all 53 strong scintillations events occurred only when the PRE E×B peak drift velocity exceeded 30 m/s. However, 2 scintillation events (out of 47 nights) during winter (Fig. 5b) and 4 scin-tillation events (out of 14 nights) during summer (Fig. 5c) occurred even though the PRE E×B peak drift velocity was less than 30 m/s. Thus, these results indicate that the nec-essary condition for the onset of strong post-sunset scintilla-tions during the high sunspot year 2001 is well defined during equinoxes, less in winter and least in the summer months.
During the low sunspot year of 2004, only on 57 nights (37 in equinoxes, 15 in winter and 5 in summer), strong (≥ 10 dB) post-sunset scintillations occurred out of the avail-able 268 days of observations. Out of the 37 nights of strong scintillation activity during the equinoctial months (Fig. 6a), 36 scintillation events occurred when the PRE
E×B peak drift velocity exceeded 20 m/s, and only on one
night strong scintillation activity was observed even though the PRE E×B drift was less than 20 m/s. During the win-ter months (Fig. 6b), 2 scintillation events (out of 15 nights) occurred even though the PRE E×B peak drift velocity was less than 20 m/s. These numbers indicate that the necessary condition for the occurrence of intense post-sunset scintilla-tions during the low sunspot year 2004 is also better defined during equinoctial months than during the winter months.
4 Discussion
During the post-sunset hours, the E-region ionization is quickly eroded due to the recombination of electrons and ions in the absence of photoionization by solar ionizing radi-ations from the Sun, resulting in a steep upward directed ion-ization density gradient at the bottom side of F-layer (Farley et al., 1970; Hysell et al., 1990), which becomes anti-parallel to the gravity (Kelley, 1989). Further, the rapid post-sunset enhancement in the zonal electric field leads to large verti-cal E×B drifts, thereby lifting the F-layer to altitudes where the recombination effects are negligible and collisions are rare, resulting in a condition conducive to the development of plasma irregularities. Through the Generalized Rayleigh-Taylor Instability (GRT) mechanism, the bubbles with de-pleted plasma density are uplifted, being able to reach alti-tudes of the order of 1000 km. During this time, small-scale irregularities grow on large-scale gradients in plasma bub-bles through secondary instabilities. As the plasma-depleted bubble rises from the bottom side of the F-layer, they are elongated along the field lines to off-equatorial latitudes and extend up to a north-south dimension of the order of 2000 km (Aarons et al., 1980).
Further, the large post-sunset vertical drifts cause the resurgence of the equatorial fountain effect by depleting the ionization near the magnetic equator, and simultaneously in-creasing the ionization at off-equatorial latitudes. Thus, the ambient ionization near off-equatorial stations like Waltair (20◦N dip) becomes higher than that at the equatorial sta-tions like Trivandrum, giving rise to large ionization anomaly gradients (dN/dL) during the post-sunset hours, as may be seen from Figs. 3 and 4. The equatorial irregularities, as they rise to sufficiently high altitudes will map along highly conductive magnetic field lines to the equatorial anomaly ionosphere, preserving the relative electron density fluctua-tion 1N/N along the flux tubes (Aarons et al., 1981). High ambient ionization density (N) in the post-sunset anomaly ionosphere cause intense scintillations at off-equatorial sta-tions like Waltair which are closer to the equatorial ionization anomaly crest region, because the magnitude of the scintil-lation is proportional to the product (1N/N)×N integrated through the ionosphere (Aarons et al., 1981; DasGupta et al., 1981; Rino and Liu, 1982; Wernik et al., 1983). Fig-ures 3 and 4 confirm that the significant enhancement in the anomaly gradient is accompanied by the intense (≥10 dB) scintillation activity observed over Waltair. Valladares et
al. (2004), from a chain of GPS receiver networks in the American sector, have also reported that the anomaly peak-to-trough ratios show larger values around the post-sunset hours during the days of intense scintillation activity.
In our detailed study to determine any possible quanti-tative relationship that exists between the pre-reversal en-hancement in the vertical E×B drift at the equator (Trivan-drum) and its role in the occurrence of VHF scintillations at an off-equatorial station (Waltair), we have analyzed a to-tal of 259 nights of data during the high sunspot activity year, 2001 and 268 nights of data during the relatively low sunspot year, 2004. The percentage of occurrences of VHF scintilla-tions show a good correspondence with the monthly mean PRE E×B vertical drift velocities at the equator, and both the parameters show a clear seasonal behavior with equinoc-tial maxima followed by winter and a summer minima dur-ing both high and low sunspot activity years. Our study further confirms the existence of a threshold value of PRE
E×B upward peak drift velocity of 30 m/s (Fig. 5) during a
high sunspot year (2001) for the strong scintillations to oc-cur, as reported by earlier studies from western sector (Fe-jer et al.,1999; Anderson et al., 2004). Also, it is observed that this threshold value decreases to 20 m/s (Fig. 6) during the low sunspot year, 2004. Fejer et al. (1999), from Jica-marca radar observations of 200 events during evening and nighttime periods from April 1968 to March 1992, have re-ported that the threshold drift velocity for the generation of strong early night irregularities varies linearly with solar flux. Basu et al. (1996), from their campaign observations during 25 September to 7 October of 1994 in the South American sector, have reported that the pre-reversal enhancement in upward drift, even though only 20 m/s during solar minimum period, is a necessary condition for the development of scin-tillation activity. Hence, the results from the present study are consistent with most of the results reported earlier.
Fejer et al. (1999) have shown that during the periods of extended magnetic activity, the disturbance dynamo elec-tric fields driven by the enhanced energy deposition into the high-latitude ionosphere generally causes large reductions in the amplitude of the pre-reversal enhancements, thereby in-hibiting the generation of Spread-F more prominently dur-ing equinoctial solar maximum periods. Whalen (2002) have also shown that each level of decreasing Spread-F, resulting from the decrease of maximum pre-reversal eastward electric fields by the geomagnetic activity represented by Kp
aver-aged over 6 h, is greatest in the equinoctial months, less in the December solstice months, and zero in the June solstice months during the solar maximum periods. Hence, the re-sults obtained from our studies presented in Figs. 5 and 6 are in good agreement with the results reported earlier by Fejer et al. (1999) and Whalen (2002). Further, the present results also show that the influence of the 6-h average Kp-index
pre-ceding the sunset on the maximum PRE E×B drift veloc-ity and thereby on the suppression of ESF irregularities is significant even during the relatively low sunspot year 2004.
1616 S. Tulasi Ram et al.: The role of post-sunset vertical drifts at the equator
Acknowledgements. This work has been carried out under the De-partment of Science and Technology (DST), Govt. of India spon-sored Project No. SR/S4/AS: 226/03. S. Tulasi Ram wishes to ex-press his sincere thanks to Earth System Science (ESS) division of DST for providing him with a JRF in the project to carry out this work.
Topical Editor M. Pinnock thanks E. Costa and S. Basu for their help in evaluating this paper.
References
Aarons, J., Mullen, J. P., Whitney, H. E., and Mackenzie, E. M.: The dynamics of Equatorial Irregularity Patch Formation, Motion and Decay, J. Geophys. Res., 85, 139–149, 1980.
Aarons, J., Whitney, H. E., MacKenzie, E., and Basu, S.: Mi-crowave equatorial scintillation intensity during solar maximum, Radio. Sci., 16, 939–945, 1981.
Anderson, D. N., Reinisch, B., Valladares, C., Chau, J., Veliz, O.: Forecasting the occurrence of ionospheric scintillation activity in the equatorial ionosphere on a day-to-day basis, J. Atmos. Terr. Phys., 66, 1567–1572, 2004.
Basu, S., Kudeki, E., Bsau, Su., et al.: Scintillations, Plasma drifts, and neutral winds in the equatorial ionosphere after sunset, J. Geophys. Res., 101, 26 795–26 809, 1996.
Basu, Su. and Basu, S.: Equatorial scintillations: advances since ISEA-6, J. Atmos. Terr. Phys., 47(8), 753–768, 1985.
Calvert, W. and Cohen, R.: The interpretation and synthesis of cer-tain Spread-F configurations appearing on equatorial ionograms, J. Geophys. Res., 66, 3125–3140, 1961.
DasGupta, A., Maitra, A., and Basu, S.: Occurrence of nighttime VHF scintillations near the equatorial anomaly crest in the Indian sector, Radio. Sci., 16, 1455–1458, 1981.
Fagundes, P. R., Sahai, Y., Batista, I. S., Abdu, M. A., Bittencourt, J. A., and Takahashi, H.: Observations of day-to-day variability in precursor signatures of equatorial F-region plasma depletions, Ann. Geophys., 17, 1053–1063, 1999.
Farley, D. T., Balsley, B. B., Woodman, R. F., and McClure, J. P.: Equatorial Spread F: Implications of VHF radar observations, J. Geophys. Res., 75, 7199–7216, 1970.
Fejer, B. G., Scherliess, L., and de Paula, E. R.: Effects of the verti-cal plasma drift velocity on the generation and evolution of equa-torial Spread-F, J. Geophys. Res., 104(A9), 19 859–19 869, 1999. Hysell, D. L., Kelley, M. C., Swartz, W. E., and Woodman, R. F.: Seeding and Layering of Equatorial Spread F by Gravity Waves, J.Geophys.Res.,95, 17 253–17 260, 1990.
Kelley, M. C. and Maruyama, T.: A diagnostic method for equato-rial spread F, 2, The effect of magnetic activity, J. Geophys. Res., 97, 1271–1277, 1992.
Kelley, M. C.: The Earth’s Ionosphere, Academic Press,San Diego, 75–125, 1989.
Krishna Murthy, B. V., Hari, S. S., and Somayajulu, V. V.: Nighttime equatorial thermospheric meridional winds from iono-spheric h’F data, J. Geophys. Res.,95(A4), 4307–4310, 1990.
Lee, C. C., Liu, J. Y., Reinisch, B. W., Chen, W. S., and Chu, F. D.: The effects of the pre-reversal drift, the EIA asymmetry, and magnetic activity on the equatorial spread F during solar maxi-mum, Ann. Geophys., 23, 745–751, 2005.
Maruyama, T.: A diagnostic model for equatorial Spread F, Model description and applications to electric field and neutral wind ef-fects, J. Geophys. Res., 93, 14 611–14 622, 1988.
Maruyama, T. and Matuura, N.: Longitudinal variability of annual changes in activity of equatorial Spread F and plasma depletions, J. Geophys. Res.,89, 10 903–10 912, 1984.
Mendillo, M., Baumgardner, J., Pi, X., and Sultan, P. J.: Onset con-ditions for equatorial Spread F, J. Geophys. Res., 97, 13 865– 13 876, 1992.
Mendillo, M., Meriwether, J., and Miodni, M.: Testing the ther-mospheric neutral wind suppression mechanism for day-to-day variability of equatorial Spread F, J. Geophys. Res., 106, 3655– 3663, 2001.
Ossakow, S. L., Zalesak, S. T., McDonald, B. E., and Chaturvedi, P. K.: Nonlinear equatorial spread F: Dependence on altitude of the F peak and bottomside background electron density gradient length, J. Geophys. Res., 84, 17–29, 1979.
Raghavarao, R., Sridharan, R., Sastri, J. H., Agashe, V. V., Rao, B. C. N., Rao, P. B., and Somayajulu, V. V.: The Equatorial Iono-sphere, Wits Handbook, 1, 48–92, 1988.
Rastogi, R. G. and Aarons, J.: Nighttime ionospheric radio scintil-lations and vertical drifts at the magnetic equator, J. Atmos. Terr. Phys., 42, 583–591, 1980.
Rino, C. L. and Liu, C. H.: Intensity scintillation parameters for characterizing transionospheric radio signals, Radio. Sci., 17, 279–284, 1982.
Rishbeth, H., Ganguly, S., and Walker, J. C. C.: Field-aligned and field perpendicular velocities in the ionospheric F2-layer, J. At-mos. Terr. Phys.,40, 767–784, 1978.
Stephen, A. W., Colerico, M., Mandillo, M., Reinisch, B. W., and Anderson, D.: Suppression of equatorial Spread F by sporadic E, J. Geophys. Res., 102, 24 037–24 046, 1997.
Stephen, A. W., Colerico, M., Mandillo, M., Reinisch, B. W., and Anderson, D.: Suppression of equatorial Spread F by sporadic E, J. Geophys. Res. 107(A2), doi:10.1029/2001JA000162, 2002. Tsunoda, R. T.: Control of the seasonal and longitudinal
occur-rence of equatorial scintillations by the longitudinal gradient in integrated F region Pedersen conductivity, J. Geophys. Res., 90, 447–456, 1985.
Valladares, C. E., Sheehan R., and Villalobos, J.: A latitudinal net-work of GPS receivers dedicated to studies of equatorial spread F, Radio Sci., 39, RS1S23, doi:10.1029/2002RS002853, 2004. Werknik, A. W., Franke, S., Liu, C. H., and Fang, D. J.:
Night-time VHF and GHz scintillations in the East-Asian sector of the equatorial anomaly, Geophys. Res. Lett., 10, 155–158,1983. Whalen, J. A.: Dependence of equatorial bubbles and bottomside
Spread F on season, magnetic activity, and ExB drift veloc-ity during solar maximum, J. Geophys. Res.,107 (A2), 1024, doi:10.1029/2001JA000039, 2002.
Woodman, R. F. and LaHoz, C.: Radar observations of F-region equatorial irregularities, J. Geophys. Res., 81, 5447–5466, 1976. Yeh, K. C. and Liu, C. H.: Radio wave scintillations in the
iono-sphere, Proc. IEEE, 70, 324–360, 1982.