HAL Id: hal-00297667
https://hal.archives-ouvertes.fr/hal-00297667
Submitted on 30 Jan 2008
HAL is a multi-disciplinary open access
archive for the deposit and dissemination of
sci-entific research documents, whether they are
pub-lished or not. The documents may come from
teaching and research institutions in France or
abroad, or from public or private research centers.
L’archive ouverte pluridisciplinaire HAL, est
destinée au dépôt et à la diffusion de documents
scientifiques de niveau recherche, publiés ou non,
émanant des établissements d’enseignement et de
recherche français ou étrangers, des laboratoires
publics ou privés.
of hydrological parameterization
A. M. R. Petrescu, J. van Huissteden, M. Jackowicz-Korczynski, A. Yurova,
T. R. Christensen, P. M. Crill, K. Bäckstrand, T. C. Maximov
To cite this version:
A. M. R. Petrescu, J. van Huissteden, M. Jackowicz-Korczynski, A. Yurova, T. R. Christensen, et
al.. Modelling CH4 emissions from arctic wetlands: effects of hydrological parameterization.
Biogeo-sciences, European Geosciences Union, 2008, 5 (1), pp.111-121. �hal-00297667�
A. M. R. Petrescu , J. van Huissteden , M. Jackowicz-Korczynski , A. Yurova , T. R. Christensen , P. M. Crill , K. B¨ackstrand3, and T. C. Maximov4
1Vrije Univ., Faculty of Earth and Life Sciences, Department of Hydrology and Geo-Environmental Sciences, De Boelelaan
1085, 1081 HV, Amsterdam, The Netherlands
2Lund Univ., Department of Physical Geography and Ecosystems Analysis, S¨olvegatan 12, 22362 Lund, Sweden
3Stockholm Univ., Department of Geology and Geochemistry, Svante Arrhenius v¨ag 8 C, Frescati, 10691 Stockholm, Sweden 4Russian Academy of Sciences, Siberian Division, Institute of Biological Problems of Cryolithozone, 41, Lenin Prospekt.,
Yakutsk, Sakha Republic, 677980, Russia
Received: 24 August 2007 – Published in Biogeosciences Discuss.: 12 September 2007 Revised: 29 November 2007 – Accepted: 20 December 2007 – Published: 30 January 2008
Abstract. This study compares the CH4 fluxes from two
arctic wetland sites of different annual temperatures during 2004 to 2006. The PEATLAND-VU model was used to simulate the emissions. The CH4module of
PEATLAND-VU is based on the Walter-Heimann model. The first site is located in northeast Siberia, Indigirka lowlands, Kytalyk reserve (70◦N, 147◦E) in a continuous permafrost region with mean annual temperatures of −14.3◦C. The other site is Stordalen mire in the eastern part of Lake Tornetr¨ask (68◦N, 19◦E) ten kilometres east of Abisko, northern Sweden. It is located in a discontinuous permafrost region. Stordalen has a sub arctic climate with a mean annual temperature of
−0.7◦C. Model input consisted of observed temperature, pre-cipitation and snow cover data.
In all cases, modelled CH4emissions show a direct
cor-relation between variations in water table and soil tempera-ture variations. The differences in CH4emissions between
the two sites are caused by different climate, hydrology, soil physical properties, vegetation type and NPP.
For Kytalyk the simulated CH4fluxes show similar trends
during the growing season, having average values for 2004 to 2006 between 1.29–2.09 mg CH4m−2hr−1. At Stordalen
the simulated fluxes show a slightly lower average value for the same years (3.52 mg CH4m−2hr−1) than the observed
4.7 mg CH4m−2hr−1. The effect of the longer growing
sea-son at Stordalen is simulated correctly.
Our study shows that modelling of arctic CH4 fluxes is
improved by adding a relatively simple hydrological model that simulates the water table position from generic weather data. Our results support the generalization in literature that Correspondence to: A. M. R. Petrescu
CH4 fluxes in northern wetland are regulated more tightly
by water table than temperature. Furthermore, parameter un-certainty at site level in wetland CH4 process models is an
important factor in large scale modelling of CH4fluxes.
1 Introduction
Together with water vapour and carbon dioxide (CO2),
methane (CH4) is an important contributor to the
warm-ing of the atmosphere. The atmospheric mixwarm-ing ratios of so called greenhouse gases, CO2, and nitrous oxide (N2O)
have increased about 31%, and 17%, respectively above pre-industrial values whereas CH4 has increased 151%±25%,
(IPCC, 2001).
The CH4 abundance in 2005 of about 1774 ppb is more
than double its pre-industrial value.Increases in atmospheric CH4 concentrations since pre-industrial times have
con-tributed a radiative forcing of +0.48±0.05 Wm−2. Current atmospheric CH4levels are due to continuing anthropogenic
emissions of CH4, which are greater than natural emissions.
Emissions from individual sources of CH4 are not as well
quantified as the total emissions but are mostly biogenic and include emissions from wetlands, ruminant animals, rice agriculture and biomass burning, with smaller contributions from industrial sources including fossil fuel-related emis-sions (Solomon et al., 2007).
About 60% of global CH4emissions come from
human-influenced sources and the rest are from natural sources (IPCC, 2001). Natural sources include wetlands, termites, oceans, and hydrates. Natural sources are dominated by wet-lands. Where soils are waterlogged and oxygen is absent,
methanogenic micro-organisms produce large amounts of CH4as they respire organic matter to CO2to derive energy.
Wetland CH4emissions are thought to comprise around 80
percent of the total natural CH4source. Total annual CH4
emissions from natural sources are estimated to be around 250 Tg (Reay, 2006).
In the past decade the overall annual rate of CH4growth
has decreased and become highly variable (Dlugokencky et al., 2003; Ciais et al., 2005). Ciais et al. (2005) attributes the decrease to a temporary reduction in anthropogenic emis-sions and the increased variability to wetland emission dis-tribution. The largest CH4 atmospheric mixing ratios are
north of 40◦N (Steele et al., 1987). This distribution co-incides with the concentration of wetlands in the northern hemisphere and suggests that wetlands in this area may make a significant contribution to the global CH4 budget (Moore
and Knowles, 1990; Aselmann and Crutzen, 1989; Crill et al., 1988; Matthews and Fung, 1987).
The magnitude of the CH4 emissions from wetlands is
controlled by the dynamic balance between CH4
produc-tion and oxidaproduc-tion rates in the peat profile and by transport mechanisms (Bubier and Moore, 1994). Measured emissions demonstrate high spatial and temporal variation (Moore et al., 1990; Whalen and Reeburg, 1992; Dise, 1993) linked to environmental factors such as variation in temperature and ground water level.
CH4 production and oxidation rates depend on substrate
availability and supply, temperature and activity of the CH4
-producing and CH4-oxidizing bacteria, affected by the
re-dox status in the soil matrix which in turn is linked to the soil moisture condition and hydrochemistry (Kettunen et al., 1999). Changes in both substrate availability and oxidation state during the growing season affect the population dynam-ics of methanogenic and methanotrophic bacteria (Svensson and Rosswall, 1984; Whiting and Chanton, 1993) and are reflected in the net CH4flux (Kettunen et al., 1999).
The water table in many wetlands show a seasonally re-lated variation, with low levels in midsummer when the evap-otranspiration is high and high levels in the rest of the sea-son when precipitation dominates. The amount of variation depends on the water sources of the wetland (precipitation, groundwater or surface water flow). Because of the presence of microtopography (hummocks, hollows and lawns, Bubier et al., 1993b) the topography of a wetland has a very high spatial variability which determines also spatial variability in CH4 fluxes. Bubier et al. (1993b) found that the CH4 flux
follows the trend: hollows > lawns > hummocks. The hol-lows have a much higher CH4 emission than the other
mi-crorelief features. The same holds for sedge lawns and wet parts of river floodplains (Van Huissteden et al., 2005). A characteristic of high latitude wetlands is the presence of the permafrost. Studies have shown that approximately 14% of the global carbon is stored in permafrost soils and sediments (Post et al., 1982). The frozen subsoil contributes to wa-terlogged soil conditions in permafrost wetlands. However,
observations have shown that permafrost degradation causes an increase of CH4fluxes by changes in local hydrology and
ecosystem balance. More widespread thaw across the dis-continuous permafrost region will be an important considera-tion to boreal C budgets with future climate change (Turetsky et al., 2002). Adequate modelling of these processes requires first of all correct modelling of the effects of water table on CH4fluxes. Models also should perform well in situations
where ground water table observations are not available. The purpose of this study is to quantify/study the effect of water table, temperature and different vegetation types at two high latitude wetland sites on CH4emission, by means of
field measurements and a modeling approach that combines the CH4flux process approach of Walter (2000) with the soil
physics as included in the model of Granberg et al. (1999). The study is based on site soil physical, vegetation and water level data. The CH4flux measurements at the sites have been
used to validate the model. Model runs have been made with both site water level observations and modelled water levels based on generic weather data, to compare the influence of modelled or observed water tables on model performance.
2 Material and methods
2.1 Site description
Kytalyk. The study area on which the research was based on is located in Northeastern Siberia, in the Kytalyk reserve, in the Indigirka lowlands near Chokhurdagh (70◦48′N,
147◦26′E, elevation 48 m). The research area consists of
three different morphological units: the river floodplain, the river terrace with tundra vegetation and the high plateaus (10–30 m) underlain by continuous permafrost. The area is characterized by silty soils with a peaty topsoil. The study site is located in river lowlands consisting of fluvial terraces of Late Pleistocene and Holocene age, and the recent flood-plain of a meandering river with extensive backswamps situ-ated behind natural levees. Next to the floodplain, a terrace (Holocene age) approximately 2 m above the present flood-plain is found, consisting of a drained thermokarst lake floor, with hummocky moist tundra in the dryer parts and a ma-ture network of low-centred ice wedge polygons in the lower parts. The next higher level in the landscape consists of so-called “ice complex” hills, which probably represent a higher Pleistocene terrace. The CH4flux measurements were
con-fined to the lower terrace and the river floodplain. The cli-mate is high arctic, with an annual average temperature mea-sured at the Chokhurdagh airport weather station of −14.3 degrees Celsius, the warmest month being July, the coldest January (data derived from NOAA website and summarized by Van Huissteden et al., 2006b). The source for the air temperature, precipitation and snow data were the local site measurements in summer, supplemented with data from the
Fig. 1. Location of the study site, Kytalyk Reserve, NE Siberia
(modified after Van Huissteden et al., 2006a).
Chokhurdagh airport weather station. Missing values were interpolated (Fig. 1).
At Kytalyk, the vegetation of the lower terrace/drained thaw lake consists mainly of ombrotrophic Sphagnum mire, alternating with interconnected depressions dominated by sedges and Eriophorum. On the dryer parts Betula nana, Salix and Eriophorum hummocks dominate. On the river floodplain vegetation varies from Carex/Eriophorum fen with grasses in wide backswamp areas, to Salix shrub on levees. The active layer ranges from 18 cm at dry, Sphagnum-covered sites on the terrace, to up to 53 cm in some parts of the floodplain. Thermokarst processes are active along the river bank and thermokarst lake banks. Stordalen. The Stordalen Mire (68◦21′N, 19◦02′E, elevation 360 m a.s.l.) is situated at about 10 km east of Abisko Sci-entific Research Station, Sweden ( ¨Oquist et al., 2001). This mire was part of the International Biological Programme, and has been studied since early 1970s. The site is about one kilo-meter from and ten kilo-meters above Lake Tornetr¨ask (Fig. 2).
The entire Stordalen mire is 25 ha large and is treeless. It is made up of four major habitats: (1) elevated, nutrient-deficient (ombrotrophic) areas with hummocks and small shallow depressions; (2) wet, nutrient-richer (minerotrophic) depressions; (3) pools and (4) brooks bringing water to and from the complex (Rooswall et al., 1975). With regard to the permafrost and the plant cover composition, the site is a typical northern peatland. The elevated parts are on per-mafrost and have tundra like vegetation (Rooswall et al., 1975). The climate is subarctic, with a mean annual temper-ature of −0.7◦C, the warmest month being July and coldest February. The annual precipitation at Abisko is the lowest in the northern part of Sweden, about 300 mm (records from 1913–2003).
This study focuses on a wet minerotrophic area of the mire, where the water table is situated in the vicinity of the soil surface and the vegetation is dominated by Eriophorum angustifolium. In the drier parts of the mire the
Eriopho-Fig. 2. Location of the study site, Stordalen mire, N Sweden (from
B¨ackstrand et al., 2008).
rum vaginatum and Carex rotundata dominates the Sphag-num spp. ( ¨Oquist and Svensson 2001).
2.2 Measurements 2.2.1 CH4
Kytalyk. During 2004–2006, the CH4fluxes were measured
in Kytalyk in short (few days) field campaigns during the summer period. The flux measurements were made using closed chambers, in a roving manner, in order to sample a wider variety of vegetation type and hydrologic conditions (Van Huissteden et al., 2005; van der Molen et al., 2007). Stordalen. In 2004 and 2005, CH4fluxes were measured
us-ing an automatic chamber system at Stordalen, described in B¨ackstrand et al. (2008). The automatic system also allowed for manual sampling. The manually sampled air was ana-lyzed for CH4and the resolved CH4fluxes were used in this
study. The chambers were placed on both wet and dry part of the mire but only the data from the chambers on the wet part were used. In 2006, the CH4 fluxes were measured using
the data from the eddy correlation (EC) tower (Christensen et al., 2004). The EC measurements of CH4exchange have
been conducted with the use of a cryo-cooled fast IR gas an-alyzer Tunable Diode Laser Trace Gas Detector (Aerodyne Res., Inc) coupled with a 3D sonic anemometer (R2, Gill in-struments Ltd, 3 m above peat surface).
2.2.2 Water table measurements and simulations
Kytalyk. The ground water table was determined after the flux measurements took place, from a hand auger hole. During the summer of 2004 daily values were recorded during four consecutive days (27–31 July) (Van Huissteden et al., 2005). For the year, 2005, measurements took place between 20 and 30 July. In 2006 the water table was measured from 15 to 18 August.
Stordalen. Water table position relative to ground level was measured manually 3–5 times per week at all sites
(B¨ackstrand et al., 2008). For the purpose of this study and to match with the CH4fluxes, only the data from the wet part
of the mire were used. 2.3 Model description
2.3.1 The PEATLAND-VU Model
PEATLAND-VU is a process-based model of CO2and CH4
emission from peat soils at various management scenarios. It includes a slightly modified version of the Walter (2000) soil profile scale CH4flux model (Van Huissteden et al., 2006a)
and a simplified soil physical model to simulate soil temper-atures and soil freezing/thawing.
It consists of four submodels: a soil physics submodel to calculate temperature, water saturation and ice content of the soil layers, a CO2submodel, a CH4submodel and an organic
production submodel (Van Huissteden et al., 2006a). The CH4submodel is based on Walter et al. (1996),
Wal-ter (2000) and Bogner et al. (2000). The model of WalWal-ter (2000) includes: (1) CH4production depending on substrate
availability; (2) CH4 oxidation within the aerated soil
top-soil and in plant roots and stems; (3) CH4transport by
diffu-sion above and below the water table; (4) transport by ebul-lition below the water table; and (5) transport through plants (Van Huissteden et al., 2006a). For this study we only used PEATLAND-VU to estimate CH4fluxes.
The model requires as input a soil profile description with organic matter content, dry bulk density and pF curves for each soil horizon, and time series for soil surface or air tem-perature, water table depth and snow cover for each model time step (1 day in this study). Output of the model is the surface CH4fluxes, including contributions from the
differ-ent transport pathways.
2.3.2 Input data and parameterization of the model The input data for PEATLAND-VU Model can be obtained from generic data, e.g. soil profiles and weather data sta-tions (Van Huissteden et al., 2006a). Some soil parameters, e.g. initial conditions for the amount of carbon stored in dif-ferent soil organic matter reservoirs (peat, labile and resis-tant organic matter reservoirs) and their decomposition rates are difficult to measure without more extensive soil organic mater analysis facilities and need estimation from literature (e.g. Rooswall et al., 1975). For the Kytalyk site there is no quantitative data available yet on soil organic matter content due to logistic reasons; therefore we use comparable organic matter content data from the Swedish site. The PEATLAND-VU model CH4simulations are not very sensitive to the exact
soil composition (Van Huissteden et al., 2006a). Parameters for the CH4model that need calibration are the CH4
produc-tion rate R0(Walter, 2000); in practice also the oxidation of
CH4during plant transport is also a poorly quantified
param-eter that may need calibration (Van Huissteden et al., 2006a).
Based on the input data, simulations were carried out and the output CH4 fluxes were compared with the measured ones
(only for the Kytalyk site: three values represented with er-ror bars). All input data (climate, soil parameters, vegetation type and ground water depth) were based on observations at the sites.
For 2004 to 2006, the Stordalen climatic data sets were provided by the Abisko Scientific Research Station. For Ky-talyk the data were obtained from Chokhurdagh weather sta-tion at the local airport. In addista-tion, air and soil tempera-ture data measured on the site for micrometeorological CO2
and H2O flux measurements were used (van der Molen et
al., 2007). Several parameters influence the simulations and were calibrated. The most important ones were: the CH4
production rate R0was set at the low end of the range
indi-cated by Walter (2000) (Van Huissteden et al., 2006a). 2.3.3 Water table simulations
The ground water table strongly influences the CH4fluxes.
Two runs were performed with two different water table files. The first was the measured water table and the second was simulated using equations based on the Mixed Mire Water and Heat Model (MMWH) of Granberg et al. (1999) as mod-ified by Yurova et al. (2007). The hydrology of the model is represented by a simple bucket approach describing the change in water content of a unit area (Granberg et al., 1999). The MMWH model was developed to reconstruct the water table position in the upper active layer of the boreal mixed mires. This approach is based on the steady state moisture distribution in the unsaturated zone, which is simulated by the van Genuchten functions (1980) simplified and parame-terized for the peat of different types by Weiss et al. (1998). The lateral flow is modelled dynamically, including the trans-missivity feedback: the increase in runoff associated with higher water table due to change in hydraulic conductivity (maximum at the surface and reduces strongly with depth). Calculated potential evapotranspiration is reduced when the water table drops below the peat surface, and this decrease is exponential with a water table depth. The depth of perma-nent saturation and peat composition and physical properties are the main site-specific model parameters.
3 Results
3.1 Annual climate variations
Stordalen. The variation in climate parameters for 2004– 2006 is shown in Fig. 3. The average value for air temper-ature was 1.07◦C, the coldest day being the 3 March 2006 (−29.36◦C) and warmest the 5 July 2005 (19.69◦C). The data were provided by the Abisko Scientific Research Sta-tion for the three years in study. Abisko is in the rain shadow of the Norwegian mountains and the precipitation received is among the lowest in Scandinavia (Johansson et al., 2006).
Fig. 3. Three years weather data records from the Stordalen Mire
(source: Abisko Scientific Research Station).
Fig. 4. Three years weather data records from the Kytalyk site
de-rived from Chokhurdagh airport weather station (source: NOAA-NCDC website http://lwf.ncdc.noaa.gov/oa/ncdc.html, augmented with local summer measurements).
The total amount of precipitation for the period 2004–2006 is only 612 mm. The gaps in data for the soil temperature at 3 cm depth were due to the malfunction of the instrument.
The winter precipitation is mainly snow. The mean snow depth on the Stordalen mire was during this period 0.18 m. This is different from Abisko, due to snowdrift effects in the open space of the Stordalen mire. The soil temperature records were measured at Stordalen mire.
Kytalyk. Figure 4 shows the three years record for climate parameters at the Siberian site. The mean temperature for the three years was −12.8◦C, the coldest day being 12 December 2004 and the warmest 4 July 2005.
Fig. 5. Water table depth from the wet part of the Stordalen Mire
for 2004–2006. Measured values in red and simulated in black.
3.2 Water table and active layer measurements
Stordalen. For this study the water levels from the fen portion of the mire were used, as presented in Fig. 5.
The active layer was measured at Stordalen mire at differ-ent sites, from 17.06–20.09.2004 and on the 22.09.2005 at 121 sites. The mean value for the year 2004 was 50.67 cm and for 2005 was 66.6 cm.
Kytalyk. The water table measurements (Table 2 and Fig. 6) were made during the field campaigns. We used the aver-age water table for the floodplain sites to interpolate between periods with modelled water table. In Table 2 the averaged values (7 point measurements in 2004, 21 in 2005 and 12 in 2006 from the floodplain wet area) are shown.
Using as input parameters the climate data, we modelled the water table with the MMWH model (Granberg et al., 1999, modified by Yurova et al., 2007). Figure 5 shows the simulation for Stordalen mire and Fig. 6 for Kytalyk site.
The deviations between data and model for the Stordalen simulations is within the maximum range of deviations of 10 cm as reported in Granberg et al. (1999). The reason is that the MMWH model tends to underestimate the higher water tables and overestimate the lower ones. Partly this may be caused by inaccuracies of the water table caused by verti-cal movements of the mire surface together with the varying water table (Fritz et al., 2007). In particular for 2006 the model underestimates the water table. The year 2006 had a low amount of precipitation; possibly the water table was maintained by groundwater input which is not included in the model.
The cause of the deviation between data and model for the Kytalyk simulations is the excessive drainage of the flood-plain caused by an abnormal low water level of the river wa-ter in 2005.
Table 1. Soil physical parameters per soil horizon as used in the PEATLAND-VU Model (Van Huissteden et al., 2006a; Rosswall and Heal,
1975).
Soil physical parameters per soil horizon Kytalyk Stordalen (estimated data) (measured data)
Number of horizons 3 4
Horizons depths with respect to surface (in meters) [0.1, 0.2, 2.0] [0.1, 0.2, 0.3, 2.0] C/N ratios for each soil layer [15, 15, 15] [48, 38, 31, 15] Dry bulk density for each horizon (kg m−3) [100, 130, 975] [88, 102, 519, 808] Percentage organic matter for each horizon [95.0, 80.0, 5.0] [90.0, 80.0, 70.0, 5.0] pH [6.0, 6.0, 7.0] [4.0, 4.0, 4.1, 4.0]
Table 2. Average water table depth and active layer thickness (cm
below ground) from the floodplain wet area in Kytalyk for the years 2004–2006.
Year Average water table Average active layer thickness (cm below surface) cm
2004 0.71 42.8
2005 2.8 42.5
2006 0.16 53.5
Fig. 6. Floodplain water table depth modelled with the MMWH
Model for Kytalyk site 2004–2006. Measured values in red and simulated in black.
3.3 CH4fluxes
The PEATLAND-VU model was run for the two sites and tuning eye was performed for the most sensitive parameters: the CH4production rate R0, Q10 and plant oxidation type.
For Kytalyk the values for R0 was set to 0.3 µMh−1 and
for Stordalen to 0.25 µMh−1for both WT approaches; the
Q10value for temperature correction CH4production (range
1.7–16 in Walter and Heimann, 2000) was set at a value
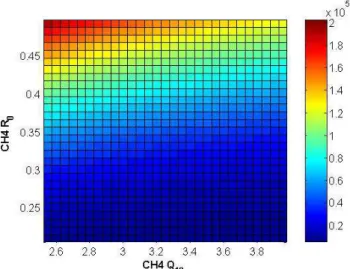
Fig. 7. Parameter estimation for the CH4production Q10 and R0 values of the model for Stordalen. The grid cells of the figure indi-cate the squared deviations of the model from the data.
of 4 for the Swedish site and 2 (simulations with observed WT) and 3 (simulations with simulated WT) for the Siberian site; and the CH4 plant oxidation fraction was set 0.6 for
the Siberian site and 0.7 for the Swedish site. For a better estimation of R0 and Q10 and to double check the tuning,
parameter estimation for Q10 and R0 test was carried out.
The best fit between the two parameters was Q10 value 4.4
and R0value 0.22, close to the used parameters (Fig. 7).
Stordalen. Using the measured water table depth from the fen part of the Stordalen Mire, the CH4flux trend is similar
to the simulated one. The range for the measured CH4is
be-tween 0 mg m−2hr−1and 18.07 mg m−2hr−1(average value of 4.7 mg m−2hr−1), while the simulated emissions vary
be-tween 0 mg m−2hr−1and 26.9 mg m−2hr−1, with an average
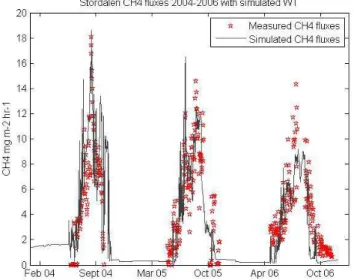
value for the three years of 3.52 mg m−2hr−1(Fig. 8). A second run, using the simulated water table from the changed version of Granberg et al., 1999, was performed with the PEATLAND-VU model. The CH4 fluxes show a
Fig. 8. Measured (red) and simulated (black) CH4emissions from the wet part of the Stordalen Mire for 2004–2006 with measured water table (see Fig. 5).
Fig. 9. Measured (red) and simulated (black) CH4emissions from the wet part of the Stordalen Mire for 2004–2006 with simulated water table (see Fig. 5).
very similar pattern for the years 2004 to 2006 (see Fig. 9). The measured CH4 emissions from the fen portion of the
mire, averaged a value of 4.7 mg m−2hr−1 (data from
two chambers for the 2004 and 2005 years and measured data with TDL from the EC tower for 2006) and range between 0 mg m−2hr−1 and 18.07 mg while the simulated fluxes range between 0 mg m−2hr−1and 18.54 mg m−2hr−1 with averaged value of 2.53 mg m−2hr−1. The CH4 flux
peak in both model and data was during the same month (September) and the period with active emission coincides with the growing season (April–October).
Fig. 10. Average measured value (red) and simulated (black) CH4 emissions for 2004–2006 at Kytalyk site using the floodplain mea-sured water table from Table 2.
Fig. 11. Average measured value (red) and simulated (black) CH4 emissions for 2004–2006 at Kytalyk site using the floodplain simu-lated water table from Fig. 6.
Kytalyk. For Kytalyk the measurements for the water table depth were done for four consecutive days in 2004, 10 days in 2005 and four day in 2006. Due to the very remote area it was not possible to perform yearly measurements, there-fore the water table input file used by PEATLAND-VU was constructed based on the available data and on the assump-tion that the minimum water depth is 5 cm below ground and does not exceeds 15 cm depth during winter time. The ac-tive layer was simulated with PEATLAND-VU based on the output temperature file constructed by the model using the air temperature as input. The soil physical submodel tends to overestimate the active layer depth. However, the measured active layer average value at the wet sites (0.45 cm) is within the range of the simulated ones (0.05–0.85 m).
The CH4 fluxes range between 0 mg m−2hr−1 and
20.8 mg m−2hr−1 with a three year average value of 1.29 mg m−2hr−1. For the 2005 and 2006 the averaged value matches with the simulations. The only exception is for the year 2004 when the measurement exceeds the simulation but it is with the error measurements (Fig. 10).
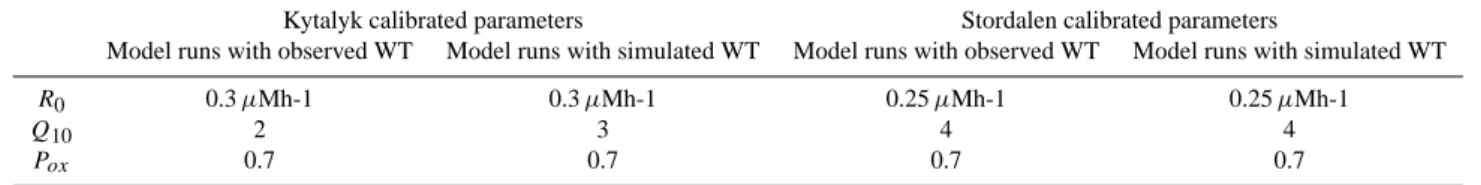
Table 3. List of calibrated parameters used in PEATLAND-VU runs for the two sites.
Kytalyk calibrated parameters Stordalen calibrated parameters
Model runs with observed WT Model runs with simulated WT Model runs with observed WT Model runs with simulated WT
R0 0.3 µMh-1 0.3 µMh-1 0.25 µMh-1 0.25 µMh-1
Q10 2 3 4 4
Pox 0.7 0.7 0.7 0.7
The results show a good match with the averaged point measurements when Peatland-VU was run with the sim-ulated water table (Fig. 11). The fluxes vary between 0 mg m−2hr−1 and 26 mg m−2hr−1, with a three year av-erage flux of 2.09 mg m−2hr−1. Similar to the simulations carried out with the measured water table, the active layer averaged value (0.45 cm) is within the range of the simulated one (0.05–0.85 m).
4 Discussion
Previous studies show that the CH4emissions are highly
in-fluenced by the water table variation (Van Huissteden et al., 2005). Therefore, for a better estimation of the total CH4
emission from arctic areas, it is necessary to have a very good estimation of the water table depth. Under global warming, permafrost areas are melting and disappearing, as it is the case of Stordalen mire (Christensen et al., 2004).
For the Swedish site, Stordalen, the CH4 emissions on a
decadal time scale are mainly influenced by the temperature changes in the past decades, which induced the melt of the permafrost. This results in an increase in the active layer depth and variation in the water table dynamics. Under wet-ter conditions, the vegetations shifts from shrub dominated, elevated, ombrotrophic conditions to wet graminoid domi-nated more nutrient rich or minerotrophic conditions (http: //www.geography.uc.edu/∼kenhinke/CALM). Such a trend is observed at Stordalen but less dramatic than other arc-tic mires, e.g. Katterjokk, where permafrost has disappeared altogether over the period 1998–2002 (Christensen et al., 2004). The vegetation composition has changed significantly with a decrease in the permafrost-dependent relatively dry el-evated mire vegetation types and a corresponding increase in the lower wet graminoid dominated vegetation. This change corresponds to changes in the underlying permafrost dis-tribution as the latter is determining the mire surface to-pography and hydrology, and hence the plant community structure (Christensen et al., 2004). Due to this change the CH4 emissions increased from 1.8–2.2 mg m−2hr−1(1970)
(Christensen et al., 2004) to 4.7 mg m−2hr−1(averaged mea-sured CH4flux 2004–2006).
The averaged simulated CH4 fluxes for Stordalen
range between 3.52 mg CH4m−2hr−1 (measured WT) and
2.53 mg CH4m−2hr−1(simulated WT), while for Siberia the
averaged simulated CH4 fluxes were much lower than the
Swedish ones: 1.29 mg CH4m−2hr−1(measured WT) and
2.09 mg CH4m−2hr−1(simulated WT).
The mean soil temperature at the Stordalen site, for the years 2004–2006 was +3.76◦C, the mean temperature for the three years of measurement at the Siberian site was −12.8◦C. The difference in CH4flux between the two sites reflects the
known sensitivity of methanogenesis to temperature and the longer growing season at the warmer Stordalen site (Walter, 2000). However CH4 formation also may occur at subzero
temperatures (Rivkina et al., 2000; Wagner et al., 2007) but winter emissions that may occur at negative temperatures are not included in the measurement data and the model.
The optimization of the CH4model input parameters (CH4
R0 production rate, Q10 value for temperature correction
CH4production) was done by optimizing the values until the
optimum match between data and model was found. For both sites the plant oxidation factor was set to a value of 0.7. This means that 70 percent of the CH4is oxidized during the plant
transport. For simulations at Stordalen mire a Q10value of
4 was used, while for Kytalyk the value was set to 2 and 3 for the two water table approaches (see Table 3), the range of it being 1.7–16 (Walter, 2000). Together with R0, the Q10
value influences the peak of the summer emissions relative to early spring and autumn. Since at Kytalyk no data through-out the growing season are available, tuning of the model parameter was focused on R0rather than Q10(see Fig. 7). In
general, the model is not very sensitive to small differences in the value of Q10. We conclude that the model is more
sen-sitive to the water table than to the temperature. This high sensitivity for water table position agrees well with statisti-cal analysis of CH4 flux data, soil temperatures and water
table data from Kytalyk (Van Huissteden et al., 2005). A good match was observed between the simulated and measured CH4 fluxes using the simulated WT. One of the
reasons might be a continuous water table file with con-stant fluctuations from summer to winter throughout the three years in study. Even if the simulated water table is underes-timated by Granberg’s model compared to the observations (Fig. 5), the CH4fluxes match with the measurements.
For the Kytalyk site, the simulated CH4 fluxes match in
both approaches with the averaged point measured CH4. The
fluxes are much lower than the ones from N Sweden and this may be due to: (1) shorter growing season (May–September)
CH4 (Busch and L¨osch, 1999). The CH4 fluxes are
re-lated to the vegetation since the latter provides substrate for methanogens through root exudation (King and Reeburg, 2002). A recent study at Stordalen shows that sites domi-nated by Eriophorum angustifloum have higher CH4 fluxes
than the ones with Eriophorum vaginatum or Carex rotun-data (Str¨om and Cristensen, 2007).
The variation within the CH4fluxes is strongly influenced
by the hydrological conditions at each site. A smoother vari-ation (see Fig. 8) is observed for Stordalen CH4as the WT
had a more constant trend (not many peaks, Fig. 5). For the Siberian site the water table varied strongly (wet in 2004 and very dry in 2005 caused by the excessive drainage of the floodplain) therefore the emissions show a higher variability in time.
5 Conclusions
CH4 fluxes from arctic wetlands show a high variability in
time and space. Even if both sites are located in arctic areas, the differences are considerable. Both study sites are wet-lands but the CH4fluxes have different patterns. We
hypoth-esize that the cause for these differences are (1) water table depth (2) air and soil temperature (3) vegetation type and (4) net primary production. By using the simulated water table depth, it was possible to match the measured CH4emissions
with the simulated ones, using a relatively simple bucket model to simulate the water table based on generic meteo-rological precipitation and temperature time series. Water table information may not always be available at high mea-surement resolution and accuracy. We have shown that with the Granberg’s model we could simulate the CH4flux
cor-rectly even with absent (Kytalyk) observations or scattered measurements during the growing season (Stordalen). The results of our study are promising for improvement of re-gional scale CH4emission models. Parameter uncertainty at
site level in wetland CH4process models is an important
fac-tor in large scale modelling of CH4fluxes. The CH4fluxes
at the Kytalyk site appear less sensitive to temperature varia-tion than to water table variavaria-tion, in concordance with other studies (Moore et al., 1990; Roulet et al., 1991; Walter et al., 1996; van der Molen et al., 2007). This stresses the need for improving hydrological models to correctly simulate water table variations for modelling wetland CH4fluxes.
Edited by: J. Leifeld
References
Aselmann, I. and Cruzen, P. J.: Global distribution of natural fresh-water wetlands and rice paddies, their net primary productivity, seasonality and possible CH4 emissions, J. Atmos. Chem., 8, 307–359, 1989.
B¨ackstrand, K., Crill, P. M., Mastepanov, M., Christensen, T. R., and Bastviken, D.: Nonmethane volatile organic compound flux from a subarctic mire in northern Sweden, TellusB, in press, 2008.
Bogner, J. E., Sass, R. L., and Walter, B. P.: Model comparisons of methane oxidation across a management gradient: Wetlands, rice production systems, and landfill, Global Biogeochem. Cy., 14, 1021–1033, 2000.
Bubier, J., Costello, A., Moore, T. R., Roulet, N. T., and Savage, K.: Microtopography and CH4flux in boreal peatlands, northern Ontario, Canada, Can. J. Botany, 71, 1056–1063, 1993b. Bubier, J. L. and Moore, T. R.: An ecological perspective on CH4
emissions from northern wetlands, Trends in Ecology and Evo-lution, 9, 409–464, 1994.
Busch, J. and L¨osch R.: The gas exchange of Carex species from eutrophic wetlands and its dependence on microclimatic and soil wetness conditions, Phys. Chem. Earth, PT B, 24, 117–120, 1999.
Ciais, Ph., Reichstein, M., Viovy, N., Granier, A., Og´ee, J., Allard, V., Aubinet, M., Buchmann, N., Bernhofer, Chr., Carrara, A., Chevallier, F., De Noblet, N., Friend, A. D., Friedlingstein, P., Gr¨unwald, T., Heinesch, B., Keronen, P., Knohl, A., Krinner, G., and Loustau, D.: Europe-wide reduction in primary productivity caused by the heat and drought in 2003, Nature, Vol. 437 Issue 7058, 529–533, 2 diagrams, 1 graph, doi:10.1038/nature03972; (AN 18373101), 2005.
Christensen, T. R., Johansson, T., ˚Akerman, H. J., et al.,: Thawing sub-arctic permafrost: effects on vegetation and CH4emissions, Geophys. Res. Lett., 31, L04501, doi:10.1029/2003.GL018680, 2004.
Crill P. M., Bartlett, K. B., Hariss, R. C., Gorham, E., Verry, E. S., Sebacher, D. I., Madzar, L., and Sanner, W.: CH4flux from Min-nesota peatlands, Global Biogeochem. Cy., 2, 371–384, 1988. Dise, N. B.: CH4emissions from Minnesota peatlands: spatial and
seasonal variability, Global Biogeochem. Cy., 7, 123–142, 1993. Dlugokencky, E. J., Houweling, S., Bruhwiler, L., Masarie, K. A., Lang, P. M., Miller, J. B., and Tans, P. P.: Atmospheric CH4 levels off: Temporary pause or new steady state?, Geophys. Res. Lett., 30(19), 1992, doi:10.1029/2003GL018126, 2003.
Fritz, C., Campbell, D. I., and Schipper, L. A.: Oscillat-ing peat surface levels in a restiad peatland, New Zealand – magnitude and spatiotemporal variability, Hydrol. Process., doi:10.1002/hyp.6912, 2007.
Granberg, G., Grip, H., Lofvenius, M. O., Sundh, I., Svensson, B. H., and Nillson, M.: A simple model for simulation of water content, soil frost, and soil temperatures in boreal mixed mires, Water Resour. Res., 35(12), 3771–3782, 1999.
IPCC, 2001: Climate Change 2001: The Scientific Basis, Con-tribution of Working Group I to the Third Assessment Report of the Intergovernmental Panel on Climate Change, edited by: Houghton, J. T., Ding, Y., Griggs, D. J., Noguer, M., van der Linden, P. J., Dai, X., Maskell, K., and Johnson, C. A., Cam-bridge University Press, CamCam-bridge, United Kingdom and New York, NY, USA, 881 pp., 2001.
IPCC Third Assessment Report: Climate Change 2001 – Synthesis Report, Stand-alone edition, edited by: Watson, R. T. and the Core Writing Team, IPCC, Geneva, Switzerland, 184 pp., 2001. Johansson, T.: Temporal and spatial variability of carbon cycling in
a subarctic landscape, Ph.D., Department of Physical Geography and Ecosystem Analysis, Lund University, 2006.
Kettunen, A., Kaitala, V., Lehtinen, A., Lohila, A., Alm, J., Solvola, J., Martikainen, P. J.: CH4production and oxidation potentials in relation to water table fluctuations in two boreal mires, Soil Biol. Biochem., 31, 1741–1749, 1999.
King, J. Y. and Reeburg, W. S.: A pulse-labelling experiment to determine the contribution of recent plant photosynthates to net CH4emissions in arctic wet sedge tundra, Soil. Biol. Biochem., 34, 173–180, 2002.
Matthews, E. and Fung, I.: CH4 emissions from natural wet-lands: global distribution, area and environment characteristics of sources, Global Biogeochem. Cy., 1, 61–86, 1987.
Moore, T. R. and Knowles, R.: CH4emissions from fen, bog and swamp peatlands in Quebec, Biogeochemistry, 11, 45–61, 1990. NOAA-NCDC website: http://lwf.ncdc.noaa.gov/oa/ncdc.html, last
access: June 2007. ¨
Oquist, M. G. and Svensson, B. H.: Vascular plants as regulators of CH4emissions from a subarctic mire ecosystem, J. Geophys. Res., 107(D21), 4580, doi:10.1029/2001JD001030, 2002. Post, W. M., Emanuel, W. R., Zinke, P. J., and Stangenberger, A.G.:
Soil carbon pools and world life zones, Nature, 298, 22–54, 1982.
Raghoebarsing, A. A., Smolders, A. J. P., Schmid, M. C., Rijp-stra, W. I. C, Wolters-Arts, M., Derksen, J., Jetten, M. S. M., Schouten, S., Sinninghe Damst´e, J. S., Lamers, L. P. M., Roelofs, J. G. M., Op den Camp, H. J. M., and Strous, M.: Methan-otrophic symbionts provide C for photosynthesis in peat bogs, Nature, 436, 1153–1156, 2005.
Reay, D. (Lead Author) and Hughes, P. (Topic Editor): CH4, in: Encyclopedia of Earth, edited by: Cutler, J. Cleveland (Washing-ton, D.C.: Environmental Information Coalition, National Coun-cil for Science and the Environment), Published November 24, 2006 (Retrieved January 22, 2007), 2006.
Rivkina, E. M., Friedmann, E. I., McKay, K. P., and Gilichinsky, D. A.: Metabolic activity of permafrost bacteria below the freezing point, Appl. Environ. Microb., 66(8), 3230–3233, 2000. Rosswall, T. and Heal, O. W. (Eds.): Structure and Function of
Tun-dra Ecosystems, Ecol. Bull. (Stockholm), 20, 265–294, 1975. Roulet, N., Moore, T., Bubier, J., and Lafleur, P.: Northern fens:
CH4flux and climatic change, Tellus, 44B, 100–105, 1991. Steele, L. P., Fraser, J. P., Rasmussen, R. A., Khalil, M. A. K.,
Con-way, T. J., Crawford, A. J., Gammon, R. H., Maserie, K. A., and Thoning, K. W.: The global distribution of CH4in the tropo-sphere, J. Atmos. Chem., 5, 125–172, 1987.
Solomon, S., Qin, D., Manning, M., Alley, R. B., Berntsen, T., Bindoff, N. L., Chen, Z., Chidthaisong, A., Gregory, J. M., Hegerl, G. C., Heimann, M., Hewitson, B., Hoskins, B. J., Joos, F., Jouzel, J., Kattsov, V., Lohmann, U., Matsuno, T., Molina, M., Nicholls, N., Overpeck, J., Raga, G., Ramaswamy, V., Ren, J., Rusticucci, M., Somerville, R., Stocker, T. F., Whetton, P., Wood, R. A., and Wratt, D.: Technical Summary, in: Climate Change 2007: The Physical Science Basis. Contribution of Working Group I to the Fourth Assessment Report of the Intergovernmen-tal Panel on Climate Change edited by: Solomon, S., Qin, D., Manning, M., Chen, Z., Marquis, M., Averyt, K. B., Tignor, M., and Miller, H. L., Cambridge University Press, Cambridge, UK and New York, NY, USA, 2007.
Str¨om, L. and Christensen, T. R.: Below ground carbon turnover and greenhouse gas exchanges in a sub-arctic wetland, Soil Biol. Biochem., 39(7), 1689–1698, 2007.
Svensson, B. H. and Rosswall, T.: In situ CH4 production from acid peat in plant communities with different moisture regime in a subarctic mire, Oikos, 43, 341–350, 1984.
Turetsky, M. R., Wieder, R. K., and Vitt, D. H.: Boreal peatland C fluxes under varying permafrost regimes, Soil Biol. Biochem., 34, 907–912, 2002.
Van Genuchten, M. T.: A closed form equation for predicting the hydraulic conductivity of unsaturated soils, Soil Sci. Soc. Am. J., 44(5), 892–898, 1980.
Van Huissteden, J., Maximov, T. C., and Dolman, A. J.: High CH4 flux from an arctic floodplain (Indigirka low-lands, Eastern Siberia), J. Geophys. Res., 110, G02002, doi:10.1029/2005JG000010, 2005.
Van Huissteden, J., Van den Bos, M., and MartcorenaAlvarez, I.: Modelling the effect of water-table management on CO2 and CH4fluxes from peat soils, Neth. J. Geosci., 85, 3–18, 2006a. Van Huissteden, J., Maximov, T. C., and Dolman, H.: CH4
fluxes in 2004 and 2005 in the Northeast Siberian tundra near Chokhurdagh, Indigirka Lowlands, in: International workshop on H2O and CO2exchange in Siberia, edited by: Dolman, H., Moors, E., Ohta, T., Maximov, T. C., Nagoya, Japan, 33–36, 2006b.
van der Molen, M. K., van Huissteden, J., Parmentier, F. J. W., Pe-trescu, A. M. R., Dolman, A. J., Maximov, T. C., Kononov, A. V., Karsanaev, S. V., and Suzdalov, D. A.: The growing season greenhouse gas balance of a continental tundra site in the Indi-girka lowlands, NE Siberia, Biogeosciences, 4, 985–1003, 2007, http://www.biogeosciences.net/4/985/2007/.
Wagner, D., Gattinger, A., Embacher, A., Pfeiffer, E.-M., Schloter, M., and Lipski, A.: Methanogenic activity and biomass in Holocene permafrost deposits of the Lena Delta, Siberian Arctic and its implication for the global CH4 budget, Global Change Biol., 13, 1089–1099, doi:10.1111/j.1365-2486.2007.01331.x, 2007.
Walter, B. P., Heimann, M., Shannon, R. D., and White, J. R.: A process based model to derive CH4emissions from natural wetlands, Report no. 215 Max-Planck-Institut f¨ur Meteorologie (Hamburg), 21 pp., 1996.