HAL Id: insu-03209961
https://hal-insu.archives-ouvertes.fr/insu-03209961
Submitted on 27 Apr 2021
HAL is a multi-disciplinary open access
archive for the deposit and dissemination of
sci-entific research documents, whether they are
pub-lished or not. The documents may come from
teaching and research institutions in France or
abroad, or from public or private research centers.
L’archive ouverte pluridisciplinaire HAL, est
destinée au dépôt et à la diffusion de documents
scientifiques de niveau recherche, publiés ou non,
émanant des établissements d’enseignement et de
recherche français ou étrangers, des laboratoires
publics ou privés.
Observations of power line harmonic radiation by the
low-altitude AUREOL 3 satellite
Michel Parrot
To cite this version:
Michel Parrot.
Observations of power line harmonic radiation by the low-altitude AUREOL 3
satellite. Journal of Geophysical Research, American Geophysical Union, 1994, 99 (A3), pp.3961.
�10.1029/93JA02544�. �insu-03209961�
JOURNAL OF GEOPHYSICAL RESEARCH, VOL. 99, NO. A3, PAGES 3961-3969, MARCH 1, 1994
Observations
of power line harmonic radiation by the
low-altitude
AUREOL
3 satellite
Michel Parrot
Laboratoire de Physique et Chimie de l'Environnement, Centre National de la Recherche $cientifique, Orl6ans, France
Abstract. During the past decade,
most scientific
satellites
have been dedicated
to the study
of
the auroral zones, but low-altitude satellites also allow the study of the anthropogenic effects in
the mid-latitude
regions.
AUREOL 3 was such a low-altitude
polar-orbiting
satellite,
with an
apogee
and perigee
of 2000 and 400 km, respectively,
which observed
power line harmonic
radiation
(PLHR). The wave experiment
named ARCAD 3 provided
the waveforms
of five
components
of the electromagnetic
field (three magnetic
and two electric)
in a frequency
range
between
0 and 1.5 kHz. The telemetry
was recorded
at different
stations.
During the lifetime of
the mission,
940 records,
each lasting
approximately
12 rain, were processed
in order to obtain
spectrograms
of the waveforms.
On these
spectrograms,
five events
with magnetospheric
lines
have been detected, which in all cases are separated by 50 Hz (with an accuracy of 176); such
lines are not at exact
harmonics
of the 50-Hz power system,
but drift in frequency
with time. The
drift, which is between 1 and 8 Hz/s, is not constant during an event. A common property of
these
five events
is that they were recorded
during
periods
of very low magnetic
activity
and were
observed
mainly in the night sector.
Comparison
of the characteristics
of these
PLHR with
existing
theories
concerning
the general
problem
of VLF triggered
emissions
and sideband
stability
of whistler
mode
waves,
shows
that the drift in frequency
is not due to a Doppler
effect,
but most probably
to a non linear interaction
between
electrons
and coherent
waves,
occurring
in the topside ionosphere.
1. Introduction
Power line harmonic radiation (PLHR) is the ELF and VLF waves radiated by electric power systems at the harmonic frequencies of 50 or 60 Hz. These electromagnetic waves are supposed to amplify and trigger many emissions, and thus to participate in the precipitation of electrons from the slot region (2 < L < 3) between the inner and outer radiation belts. The PLHR phenomenon has commonly been observed on ground, but
observations from satellites are rare.
On the ground, the propagation of PLHR through the magnetosphere was first observed by Helliwell et al. [1975], between an industrialized region, Roberval in Quebec, and its conjugate point, the Siple station in Antarctica. Similar observations were made from different places by Matthews and Yearby [1981] and Kirnura et al. [1987]. The radiation consists o f several line emissions that do not always appear at exact harmonics of 50 or 60 Hz; on the contrary, they are not spaced at exactly the power system frequency. In some cases, the lines shii• in frequency. A peak in PLHR events is observed around 3 kHz, and between 0600 and 1800 local time [Park and Helliwell, 1978]. During an experiment with a transmitter, it was found by Park and Chang [1978] that power line effects can be simulated by radiating as little as 0.5 W at a given frequency. An
estimation of the PLHR power radiated into the magnetosphere
was measured by Yearby et al. [1983].
Copyright 1994 by the American Geophysical Union. Paper number 93JA02544.
0148-0227/94/93JA-02544505.00
A low-altitude
survey
of •LF emissions
obtained
by the
Ariel
3 and 4 satellites [Bullough eta!., 1976; Tatnall et al., 1983; Bullough et al., 1985] revealed a maximum in wave activity over North America that the authors attributed in part to the PLHR. But the data from these two satellites only consisted of averaged values in three frequency bands (750 Hz, 3.2 and 9.6 kHz), and
did not allow direct observations of PLHR. Weak emissions
related to PLHR were observed on board the ISEE 1 satellite by Bell et al. [1982] above North America. The line radiation was only detected on 5 of the 90 orbits studied, and were observed during periods of low magnetic activity. Most of these magnetospheric lines were located between 3 and 4 kHz, and their frequencies significantly deviated from the PLHR frequencies as was already observed from ground data. During disturbed propagation conditions, one event related to the PLHR was detected on the S3-3 satellite by Koons et al. [1978]. Some observations with the ISIS 2 satellite are given by Park and Helliwell [1981]. In this last case, the line frequencies are less
than 1.8 kHz. Field measurements of PLHR at the fundamental
frequency were made in the atmosphere with balloons [To•nizawa and Yoshino, 1984]. The same experiment in the topside ionosphere, showing increases of the magnetic field strength at the fundamental frequencies 50 and/or 60 Hz, was reported by Tomizawa and Yoshino [1985]. Concerning the AUREOL 3 data, an increase of the VLF activity has also been observed over North America [Parrot, 1990]. It was shown by Parrot et al. [1991] that the intensity of the electric component field that is parallel to the Earth's magnetic field varies with the days of the week, with a maximum on Monday. A theoretical model which ascribes this observation to a PLHR effect was presented by Molchanov et al. [1991].
3962 PARROT : POWER LINE HARMONIC RADIATION OBSERVATIONS
In the observations mentioned above, the problem of frequency shift was attributed either to a Doppler effect or to a non linear wave-particle interaction. This phenomenon was considered in the past by many authors, because it is related to the general problem of VLF-triggered emissions and the non linear interaction between energetic electrons and coherent VLF waves [Helliwell, 1967; Nunn, 1971, 1984; Brinca, 1972a]. At higher frequencies than PLHR, other coherent waves such as the pulses of VLF ground-based transmitters are known to produce similar phenomena [Bell, 1985]. The other important feature with the VLF transmitter signals is that sidebands of electrostatic nature are generated [Nunn, 1973; Tanaka et al., 1987; Bell and Ngo, 1988, 1990]. To explain these observations, Nunn [1986] has presented a nonlinear theory of sideband stability for different ducted whistler mode waves including the PLHR. It is shown that a maximum upward drift of 30 Hz/min could be expected if the wave amplitude is larger than 0.5 pT. With another simulation,
Carlson et al. [1990] found a 30 Hz/s frequency drift rate during whistler mode amplification of a wave pulse. A recent review of theoretical and numerical studies of VLF-triggered emissions, generated by man-made signals and propagating in the whistler mode in the magnetosphere, is given by Otnura et al. [1991]. Helliwell [1988] has reviewed the main characteristics of the controlled VLF signals injected into the magnetosphere from Siple and received on ground or satellites. A survey of the impact of PLHR on natural noise in our environment is given by Kikuchi [1983]. It was shown by Sa [1990] that when a wave is perturbed by a weaker signal (PLHR), sidebands, and consequently triggered emissions can occur even if the amplitude ratio between the two signals is as high as 50 dB.
This paper studies magnetospheric lines observed by the low- altitude orbiting AUREOL 3 satellite. It is shown that these lines are related to PLHR. The wave experiment on AUREOL 3 and the observed events are described in section 2. Section 3 presents the comparison with past observations made on the ground as well as from satellites. The existing theories that can explain the
main characteristics of the AUREOL 3 observations are
discussed in section 4. Conclusions are presented in section 5.
2. The Data
The wave experiment ARCAD 3 was placed into a quasi-polar orbit on board the triaxial-stabilized AUREOL 3 satellite (apogee 2012 km, perigee 408 km, inclination 82ø5 ', period 109.5 min), launched on September 21, 1981. ARCAD 3 measured three magnetic and two electric components of the waves in the ELF and VLF range, from 10 Hz up to 15 kHz. The E z component was approximately parallel to the Earth's magnetic field at high latitude, the Ea component being nearly perpendicular. The x direction was nearly parallel to the velocity of the satellite. All characteristics of the experiment are given by Berthelier et al. [1982]. Two telemetry systems were available on AUREOL 3. One was the real-time French telemetry (TMF), only used when the satellite was near a telemetry station, the second was the on board tape-recorded Soviet telemetry (TMS). In contrast to the TMS, the TMF contained high-bit rate data and provided waveforms of five components of the electromagnetic field in a 10 Hz-l.5 kHz bandwidth. The sampling frequencyf• was 5000 Hz, which means that the maximum frequency of the spectrum theoretically was 2500 Hz if we ignore the antialiasing filter.
For this paper the study only concerned the TMF data recorded at different telemetry stations. Data from October 1981 until
December 1983 were used. Considering all telemetry stations, there are approximately 940 TMF records each lasting between 12 and 15 min. The recording periods were not selected and varied from one day to another, depending on the programmarion of the experiment and on the position of the stations. Using all recorded data, spectrograms were made on a routine basis with a frequency resolution of 2.5 Hz and a time resolution of 80 ms. A search for the presence of spectral lines was carried out by visual inspection of these spectrograms of the five available
components.
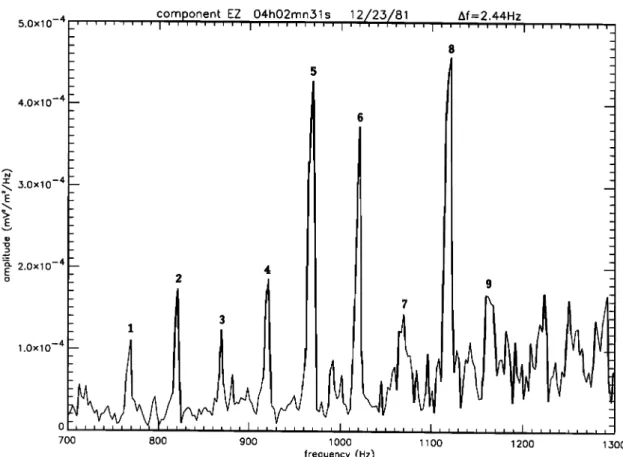
A first example is given in Figure 1. This spectrogram represents the spectrum intensity of the electric signal E z received at the Toulouse station on April 9, 1982, as a function of frequency and time. Main geophysical parameters are displayed below. A set of lines drifting upwards is observed between 400 Hz and 1 kHz. A spurious line due to an interference on board
the satellite can be seen around 160 Hz. This interference cannot
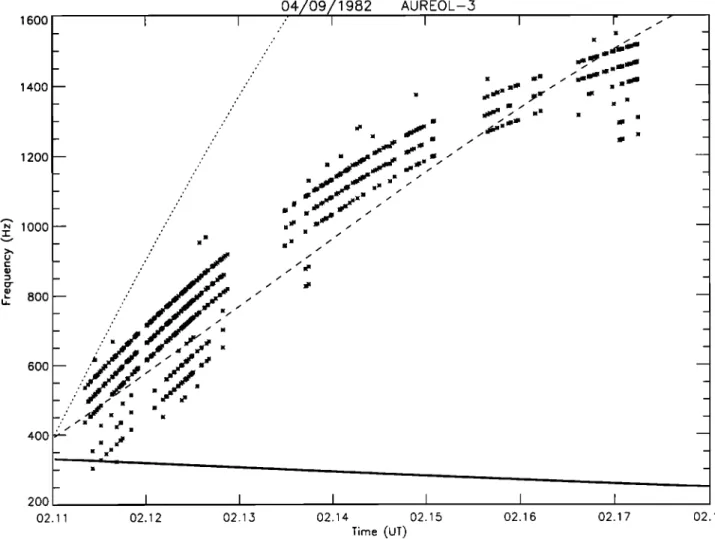
be blended with magnetospheric lines as the frequency was constant during the recording. Another example of magnetospheric lines recorded on December 23, 1981 is given in the presentation of the first results of the ARCAD 3 experiment (Figure 19 of Berthelier et al., [1982]).
Among the 940 considered records, only five events were
detected. The characteristics and locations of these observations
are summarized in Table 1. For each event, the following parameters are shown: day, hour (UT) of the beginning of the observation, geographic latitude and longitude, altitude of the satellite, L value, magnetic local time, EKp or the sum of the Kp indices for the day, a Kp index corresponding to a period of 3
hours, and the maximum number of observed lines. The number
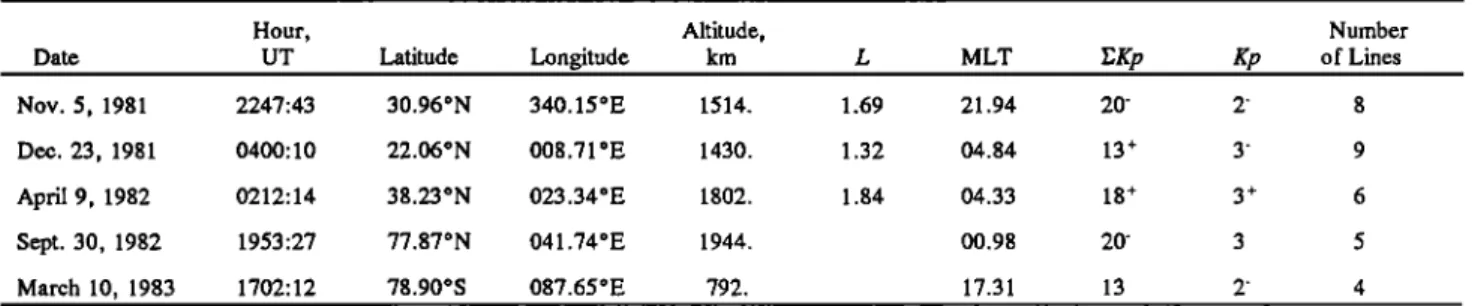
of lines was detected by spectral analysis of the waveform data. An example of the spectrum obtained on December 23 at 0402:31 UT is plotted in Figure 2. The frequency range is between 700 and 1300 Hz, and the frequency resolution of analysis is 2.44 Hz. All peaks numbered from 1 to 9 are roughly distant by 50 Hz. It must be noted that the peaks have different amplitudes.
The recorded signal is eminently nonstationary; to improve the
frequency resolution, the accuracy of the spectral analysis was increased using the following DFT (discrete Fourier transform):
3/-1
X(J)
=•'• x(n)e
•2,•at
(1)
n•O
where x(n) are the samples,f is the frequency, At is the sampling interval (1/5000), and N is the number of samples taken into account. Thus the spectrum SO') is obtained using the equation (1)
by
s(t)--x(t)x '00 (2)
where the asterisk denotes the complex conjugate. A frequency
resolution of 0.1 Hz, and a time resolution of 0.5 s was chosen
for each
spectrum.
To save
computer
time, the spectra
have
only
been calculated in the frequency band where the lines are
observed. In these spectra, it consistently appears that the spectral lines are distant by 50 Hz with an accuracy of 1%. For two events, the frequency of the peaks has been plotted against time in Figures 3 and 4. The entire observation period was considered.
For a given event, the time of observation of these lines is
relatively important (5 min on December 23, 6 min on April 9, 7 min on September 30). It was only limited by the duration of the record or the frequency range of the spectrograms, as the
PARROT ß POWER Ln•E HARMONIC RADIATION OBSERVATIONS 3963 F 5 •5
UT
02.11o44
02.12.14
02.12.44
MLT
4.34
4.33
4.32
ALTITUDE
1789.7
1802.6
1815.0
INV. LAT
43.56
42.49
41.47
GEOG. LAT 39.59
38.20
36.82
GEOG. LONG 23.17
23.35
23.51
L
1.90
1.84
1.78
Figure 1. Spectrogram of the signal of an electric component recorded on April 9, 1982, during 1 min. Minimum, maximum, and average amplitudes are given on the right. The following parameters are displayed on the bottom: UT time, magnetic local time, altitude in kilometers, invariant latitude, geographic latitude and longitude, L value. PLHR with drifting frequencies are observed between 400 and 900, Hz.
ooo
! i i
lines drifted upwards or downwards. The regular blanks observed in Figures 3 and 4 are due to the on-board calibration which was
removed from the data. The solid line at the bottom of the
spectrograms represents the variation of the proton gyrofrequency ft• given by a model. Figure 3 concerns the event recorded on
April 9, which was partially presented in Figure 1, and where the lines drift upwards. It must be noted that during this event, two different sets of frequencies were observed. At 0211:40 UT, the exact frequencies were 322.3, 372.6, and 422.9 Hz, as well as 529.5,579.4, and 629.4 Hz. Figure 4 represents a case where the
lines drift downwards. It concerns the event recorded on
December 23, which was partially shown in Figure 19 of Bertrelier et al. [1982]. Up to nine lines are observed, and, for example, the frequency values of the peaks observed at 0358:21
UT are 1368.6, 1418.7, 1468.7, 1518.0, 1568.8, 1618.6, 1668.4,
1718.2, and 1768.4 Hz. The frequency variations are not so smooth as in the first event, and a large jump is observed at
0400:39 UT.
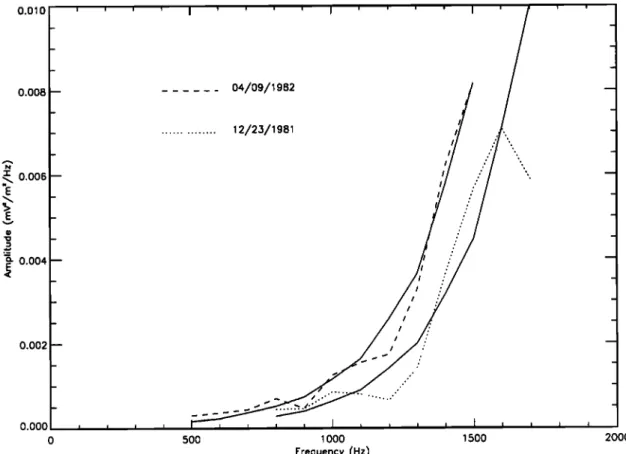
In the spectrograms of both events, the amplitude of the peaks seems to vanish at low frequencies, and a careful check of the amplitude was made. For each of the two events an average spectrum was obtained for the entire observation period. The amplitudes of the peaks, which are shown in Figures 3 and 4, have also been averaged in frequency taking into account frequency bands of 100 Hz. The two spectra have been plotted in Figure 5 with a dashed curve for the April 9 event, and a dotted curve for the December 23 event. The shape of these spectra seems unusual as the amplitude increases at high frequencies. Considering that the attenuation of the signal is only -30 dB at 3000 Hz, attention was paid to the slope of the antialiasing filter. Therefore the full lines in Figure 5 represent for each case what would be the attenuation of the maximum value of both spectra, as a function of the frequency f, if we consider that this value is observed at the frequency 5000 Hz -f. There is a quite good agreement between the curves deduced from the slope of the filter and the experimental curves. This indicates that, because of an
TABLE 1. Date, Location, and Main Geophysical , , Parameters of the Five Events
Hour, Altitude,
Date UT Latitude Longitude km L MLT
Nov. 5, 1981 2247:43 30.96øN 340.15øE 1514. 1.69 21.94 Dec. 23, 1981 0400:10 22.06øN 008.71 øE 1430. 1.32 04.84 April 9, 1982 0212:14 38.23øN 023.34øE 1802. 1.84 04.33 Sept. 30, 1982 1953:27 77.87øN 041.74øE 1944. 00.98 March 10, 1983 1702:12 78.90øS 087.65øE 792. 17.31 20- 13 + 18 + 20' 13 2- 3' 3 + 3 2- Number of Lines , 8 9 6 5 4
3964 PARROT ß POWER LINE HARMONIC RADIATION OBSERVATIONS 5.0x10 -4 4.0x10 -4 -r 0-4 .•. 3.0xl E E ._ -4 o_ 2.0xl 0 E 1.OxlO -4 o 700
com ent EZ 04hO2mn51s 12 1 Af=2.44Hz
800
$
7
900 1000 11 O0 1200 1300
frequency (Hz)
Figure 2. Frequency zoom of the spectrum of the signal of an electric component recorded on December 23, 1981
at 0402:31 UT. Peaks which are roughly distant of 50 Hz are numbered.
aliasing effect, Figures 3 and 4 do not show real spectra, but their symmetrics for half the sampling frequency, i.e., 2500 Hz. This means that a peak observed at 1500 Hz in fact lies at 3500 Hz. Thus, the frequencies of the lines in Figure 3 (4) are drift downwards (upwards). In all five cases, it is observed that the frequency variation has the same sense as the Earth's magnetic
field.
The data corresponding to these events were recorded at three different telemetry stations: Toulouse, Tromsoe and Terre Ad61ie. In all cases, the interval between two adjacent lines was 50 Hz which is the frequency of the power system in Europe. At the longitude of Terre Ad61ie, Russia, China and a part of Japan are the main users of the 50 Hz frequency. Except for the last event
on March 10, 1983, all observations were recorded when the
satellite was close to its apogee.
In all five cases, the spectral lines were detected on the spectrograms of the electric components. The fact that nothing was observed at the same time on the magnetic components is
discussed below.
3. Comparison With Past Observations
The five events have several common features. The first one is
that magnetospheric lines are detected during period of very low magnetic activity. Table 1 shows that gKp was low during the day of the event, but low values were also observed during the previous days. Most of these days were noted as quiet by J. V. Lincoln and H.E. Coffey (Geomagnetic and solar data, various issues of Journal of Geophysical Research from 1981 to 1983). Thus magnetospheric lines are only detected when the usual natural noise is absent. This fact was already underlined for
previous observations from the ground by He!!iwell et al. [1975] and Matthews and Yearby [1981], as well from satellites by Bell et al. [1982]. It should also be noted that all five days corresponding to the events are weekdays when electric power consumption is larger than during weekends.
It can be seen in Table 1 that the AUREOL 3 events mainly occurred in the night sector. This does not agree with the maximum of PLHR occurrence observed by Park and Helliwell [1978], which is between 0600 and 1800 MLT. However, their ground observations were related to waves propagating in ducted
mode, which are directly dependent of the power consumption
that is maximum during the day. They also indicated that the frequency maximum of occurrence is around 3 kHz. The PLHR frequencies of AUREOL 3 are roughly identical if we consider that the real frequencies are equal to 5000 Hz - f, wheref is the value of the frequencies observed in Figures 3 and 4.
The second common feature of the five events is that the
frequency spacing of magnetospheric lines is always 50 Hz, although they do drift. This frequency interval is expected if the lines are due to PLHR, but disagrees with previous observations. He!liwell et al. [1975], Matthews and Yearby [1981], and Bell et al. [1982] indicated that the frequency offset between two adjacent lines is close, but never exactly equal to, 50 and/or 60 Hz. A possible explanation due to the particular situation of Canada was provided by Matthews and Yearby [1981]: although the main power frequency is 60 Hz, some plants with very high consumption use the 50-Hz system. The two systems, 50 and 60 Hz, which are interconnected, could generate many harmonics.
During all five events, an upwards or downwards shift in
PARROT ' POWER L•E HARMONIC RADIATION OBSERVATIONS 3965 1600 140o 1200 lOOO 800
04/09/1982
AUREOL-,3
I I I I n{ m{ t F 200 I I I I I I 02.11 02.12 02.13 02.14 02.15 02.16 02.17 Time (UT)Figure 3. Extended view of the spectrogram for the event recorded on April 9, 1982 (see Figure 1). The points represent the frequencies of the peaks that were extracted from background noise. The full line represents the variation of the proton gyrofrequency given by a model. The dashed and dotted lines are related to theoretical models of waves with drifting frequencies (see text for explanation).
02.18
the five cases: it is roughly between 3 and 4 Hz/s, with a minimum of 1 Hz/s, and a maximum of 8 Hz/s. This maximum occurs during the last event of Table 1. It is generally somewhat higher than the frequency drift previously reported: a maximum value of 50 Hz/min was observed by Helliwell et al. [1975]; the line drifts at Halley had a maximum of 200 Hz/min, but usually were around 100 Hz/min [Matthews and Yearby, 1981]. The satellite observations by Bell et al. [1982] showed a frequency change of approximately 22 Hz/min. Explanations of the frequency drifts of these PLHR will be discussed in the next
section.
4. Comparison With Existing Theories
In the past, a first attempt to explain the frequency drift was to invoke the Doppler shit• due to the satellite velocity. If we consider that the wave normal vector k is nearly parallel to the satellite velocity vector v,, the maximum Doppler frequency shift Af is given by
kv,
:nfV,
(3)
2•
where c is the velocity of light, and n is the refractive index. The maximum value of n in the whistler mode approximation is
obtained when k is nearly perpendicular to the Earth's magnetic field. Thus n is given by
n=(
-g-)
RL ]/'2_
(4)
where R, L, and S are the plasma coefficients defined by Stix [1962]. As the events were recorded when the satellite was at relatively high altitude, only protons were considered to evaluate equation (4). Equation (3) has been calculated for the December 23, 1981, event. The proton gyrofrequencyfn varied as in Figure 4, the velocity of the satellite v s was 6.8 km/s, and the plasma
frequencyfv
was estimated
to be 900 kHz. It was found
that, at
0358:00 UT, the Doppler shift Af = 6.3 Hz forf = 3500 Hz, and at 0402:40 UT for the same frequency, Af = 5.6 Hz. Considering that the PLHR were observed in a frequency band o f 500 Hz, Af was estimated at a given time for two different frequencies. It was found that at 0358:00 UT, Af = 6.7 Hz for f - 3700 Hz, and Af = 5.7 Hz forf = 3200 Hz. At 0402:40 UT, the values are Af = 6.1 Hz forf = 3800 Hz, and Af = 7.1 Hz forf = 4300 Hz. Therefore two conclusions are clear: first, the Doppler shift does not explain the frequency drift observed during the events as the difference of shit• between 0358:00 UT and 0402:40 UT is only 0.7 Hz at a given frequency; second, the
3966 PARROT ß POWER LINE HARMONIC RADIATION OBSERVATIONS 1500 • • ""/r.
1000
03.5812/2,3/1981
AUREOL-,3
] I 5OO i I I I I 03.59 04.00 04.01 04.02 Time (UT) 04.03Figure 4. Same as in Figure 3, but for the event recorded on December 23, 1981.
Doppler shift does not destroy the 50-Hz interval between the PLHR, as at any moment, the maximum difference between the Afvalues of lines separated by 500 Hz is 1 Hz.
To study the triggering of discrete VLF emissions, Helliwell [1967] considered the wave-particle interaction involving cyclotron resonance. In an inhomogeneous magnetic field, the electrons cannot stay in resonance with waves, and he calculated the variation of the wave frequency df which is necessary to
maintain an interaction:
3X (1-
df=
l+2x[l+
3X)tan2a]df½
(5)where X = f/f½, f• is the electron gyrofrequency, and o• is the pitch angle of the electrons. In this equation, it is supposed that
the wave normal vector k is in the direction of the Earth's
magnetic field. It means that equation (5) was obtained with
n 2 = R. In his calculation, Helliwell [1967] considered an inte-
raction taking place in equatorial regions; but it might take place elsewhere. The importance of off-equatorial resonance
interactions of coherent whistler mode waves and electrons was
underlined by Neubert et al. [1987], who showed that pitch angle scattering due to cyclotron resonance is enhanced in the topside ionosphere where these PLHR events are located. Although other explanations cannot be ruled out [Bell et al., 1982], it is
hypothesized that the observed PLHR is amplified in the topside ionosphere rather than at the magnetic equatorial plane. This interpretation is supported by the following two points: first, the electrostatic nature of the waves suggests that the stimulation does not take place very far from the satellite; second, the frequency drit• rate shows a relation with the local magnetic field, as it will be examined in the next paragraph.
The theoretical equation (5) has been used, with the experimental conditions of the April 9 event, to calculate the frequency drit• of one line. The initial frequency at 0211 UT was 4600 Hz. The time step used to resolve the equation was 1 s. The curve that was obtained is plotted as a dotted line on Figure 3 and does not represent the variation of the frequency f, but the variation of the frequency 5000 Hz - f. The value of o• was chosen to obtain the best fit with the PLHR. It corresponds to a pitch angle nearly equal to 0. The same process was used for the December 23 event with an initial frequency at 0358 UT equal to 3500 Hz. The result is plotted as a dotted curve in Figure 4. In both cases, we observe that, as time goes on, the theoretical curves rapidly become different from the observed ones. Thus more plasma parameters have been considered in the simulation. Following the work of Helliwell [1967], a new term was introduced by Sudan and Ott [1971] to account for variation of electronic density n o along the wave path. The variation of frequency df' is now given by
PARROT ' POWER LINE HARMONIC RADIATION OBSERVATIONS 3967 O.OLO 0.008 0.006 0.004 0.002 04/09/1982 12/23/1981 0.000 • • • • • j • • • • I • • • 0 500 1000 1500 2000 Frequency (Hz)
Figure 5. The dashed and dotted curves represent the average spectrum of the events recorded on April 9, 1982, and on December 23, 1981, respectively. These spectra have been averaged for frequency and time. The solid curves are related to the slope of the antialiasing filter (see text for explanation).
df
/ =dr-
2X(1
-X)f,
dno
(6)
1 +2X n o
where df is calculated with equation (5). Using the same experimental conditions as before, the frequency shifts have been calculated for the two events, and the variation of density was adjusted to fit the observations. The curves are shown as dashed lines in Figures 3 and 4. Good agreement is obtained between experimental and theoretical curves, especially for the December 23 event. The variation of electronic density, which is needed to attain this result, is relatively small: 0.3 % during the 7 min of the April 9 event, and 0.07% during the 5 rain of the December 23
event.
A second correction to the variation of the wave frequency df given by equation (5) was introduced by Matsumoto [1979]:
df/' =df
+Audt
(7)
The value of Au, which represents a non linear effect resulting from particle trapping in phase potential wells, is limited by
-3X
_<Au<_ 3X
(8)
2a-(2X+l)
%2 2a-(2X+l)
%2
Here, •ot is a wave trapping frequency defined by
•,2.k
v J.
eBw/m
(9)
where vx is the perpendicular velocity of the resonant particle, e and rn the electronic charge and mass, respectively, and B•, the wave magnetic field. The inequality of equation (8) expresses the necessary condition to have resonant electrons phase-trapped in waves [Matsmnoto, 1979]: it is due to the fact that the second- order resonance angle introduced by Nunn [1971] can take an arbitrary value between -a'/2 and a'/2 (in Helliwell's treatment, this angle is zero). Thus it is always possible to find a value of Au in equation (7), that will give a theoretical curve similar to that obtained with equation (6). Concerning the December 23 case, it is found that Art -- -1.6 Hz/s. However, it must be noted that the possible maximum value of Au is much too large when we consider the intensity of the wave magnetic field B•, recorded during the events. With the experimental conditions of the December 23 ease at 0358 UT, and considering the
gyroresonance
relation
kv I = 2a' (/'½
-j0 to calculate
•ot
in the
equation (9), the maximum value of Au is 49 Hz/s if we suppose
that the pitch angle •x = 45 ø (tan •x = V x /Vl). It is 6 times
larger than the maximum drift that is observed. This rough estimate of the maximum Au is obtained with the experimental value B•, = 0.22 pT, but no significant peak is observed in the magnetic spectrum around 1500 Hz.
Another possibility to explain the frequency drift was given by Matthews et al. [1984a, 1984b], who used a numerical simulation model to study the equatorial particle interaction with a whistler
mode wave in the inhomogeneous geomagnetic field. They
showed that a wave which passes several times in the equatorial amplification region has a maximum growth at a frequency that
3968 PARROT ß POWER LINE HARMONIC RADIATION OBSERVATIONS
shifts upwards. The frequency shift is estimated to be • f,/2, where f, = w, /2a- and wt is given by equation (9). With the parameter values of the December 23 event presented above, wt • 20 Hz. In their model the amplified wave at the. frequencyf + f,/2 propagates from the equator, is reflected in the ionosphere
(where it could be observed by a low-altitude satellite), and returns to the equator to undergo another shift. Considering that there is a frequency shift of • f,/2 per hop, and that one hop travel time is 3 s, it gives a frequency drift of • 3 Hz/s which
is rather consistent with the observations.
A similar result was obtained by Nunn [1986]' using a different approach, he studied the nonlinear sideband stability of different ducted whistler waves in cyclotron resonance with electrons. In the PLHR case, he considered that the interaction takes place around the magnetospheric equator at L = 4 and found a maximum shift Af = 2.4 Hz when Bw = 2.7 pT andf = 2858 Hz. With these experimental conditions (which are not exactly relevant for the AUREOL 3 observations), a maximum upward drift rate of 30 Hz/min is expected, considering that the PLHR frequency increases by Af on each equatorial pass. But, the AUREOL 3 events that were observed at high latitudes do not support the fact that this interaction occurs near the equator.
Moreover, Nunn [1986] noted that this mechanism needed
sufficient amplitudes of the wave magnetic field Bw (> 0.5 pT),
which is not the case of our events.
Two reasons may explain that the PLHR are not observed in
the'magnetic
spectrograms.
First,
the
values
of the
wave
magnetic
field (1.5 10 '4 -y/Hz 1/2 at 1000 Hz) are about the same as the noiselevel of the experiment at the frequencies of observation. Second, the PLHR have certainly been subjected to other mechanisms that would have increased their electrostatic part. This could be related to the general problem of sideband generation; sidebands of electrostatic nature are mainly observed around the pulses of ground-based VLF transmitters. The possible generation
mechanisms are (see, for example, Bell [1985], Bell and Ngo
[1988] and references therein): interhemispheric propagation, scattering from ionospheric irregularities, nonlinear scattering involving a parametric instability, and whistler mode sideband
instability. Interhemisphere propagation is not applicable to our
events, and the scattering from ionospheric irregularities generally induces symmetric sidebands around the carrier. No other frequency component in the spectra can be considered to produce a parametric interaction with the input waves, but the fact that many spectral lines maintain a constant frequency gap during a certain time, may be the result of a parametric interaction
between them. On the other hand, the whistler mode sideband
instability [Nunn, 1971; Brinca, 1972a, 1972b; Denavit and Sudan, 1975] is linked to the same nonlinear interaction process between coherent waves and particles that we saw before. The theory also predicts that the lower sideband is damped. Thus the most likely mechanism that is proposed to explain the AUREOL 3 events, assumes a nonlinear interaction with frequency drift, as was been shown with the equations (5)-(7); this whistler mode instability simultaneously induces the intense electrostatic part of the sidebands that are observed close to the region of generation. S. Conclusions
Several observations of PLHR were made with the low-altitude
AUREOL 3 satellite, whose common features are that the lines drift together and have a roughly constant frequency spacing of 50 Hz, their frequency range is mainly between 3 and 4 kHz, they are only observed with the electric components, and they are observed during periods of very quiet magnetic activity.
The frequency drift of these PLHR is not due to a Doppler effect but can be explained by considering a whistler mode instability during a gyroresonance interaction between such coherent waves and particles in an inhomogeneous medium. The mechanism is supposed to take place in the topside ionosphere. Due to their intensity, only triggered electrostatic sidebands are
observed.
Such observations are generally rare (only five cases were detected among 940 different telemetry records from the AUREOL 3 satellite). This is not very surprising because, due to wave experiment constraints, they occurred in a frequency band that is not often correctly surveyed by magnetospheric satellites,
and because the interaction mechanism that enhances these
emissions mainly occurs when magnetic activity is very low.
Moreover, PLHR will be masked when intense natural noise is
present in spectrograms. But, even if they are rarely observed, PLHR are omnipresent in the magnetosphere and play a role in wave-particle interaction.
Acknowledgments. The AUREOL 3 program was undertaken jointly by
the Centre National d'Etudes Spatiales (CNES) in France, the Space
Research Institute (IKI) and INTERCOSMOS in Russia. The author
thanks J. J. Berthelier, principal investigator of the VLF experiment, for use of the data. He also expresses his thanks to D. Lagoutte, G. Pepin and J. L. Rauch, who helped in data handling.
The editor thanks K.-I. Nishikawa and another referee for their
assistance in evaluating this paper.
References
Bell, T.F., High-amplitude VLF transmitter signals and associated sidebands observed near the magnetic equatorial plane on the ISEE 1 satellite, J. Geophys. Res., 90, 2792-
2806, 1985.
Bell, T.F., and H.D. N go, Electrostatic waves stimulated by coherent VLF signals propagating in and near the inner radiation belt, J. Geophys. Res., 93, 2599-2618, 1988. Bell, T.F., and H.D. Ngo, Electrostatic lower hybrid waves
excited by electromagnetic whistler mode waves scattering
from planar magnetic-field-aligned plasma density
irregularities, J. Geophys. Res., 95, 149-172, 1990. Bell, T.F., J.P. Luette, and U.S. Inan, ISEE 1 observations of
VLF line radiation in the Earth's magnetosphere, J. Geophys.
Res., 87, 3530-3536, 1982.
Berthelier, J.J., et al., Measurements of the VLF electric and
magnetic components of waves and DC electric field on board the AUREOL 3 spacecraft: The TBF-ONCH experiment, Ann. Geophys., 38, 643-667, 1982.
Brinca, A.L., Whistler side-band growth due to nonlinear wave- particle interaction, J. Geophys. Res., 77, 3508-3523, 1972a. Brinca, A.L., Sideband growth in nonlinear Landau wave-particle
interaction, J. Plasma Phys., 7, 385-402, 1972b.
Bullough, K., A.R.L. Tathall, and M. Denby, Man-made
ELF/VLF emission and the radiation belts, Nature, 260, 401- 403, 1976.
Bullough, K., T.R. Kaiser, and H.J. Strangeways, Unintentional man-made modification effects in the magnetosphere, J. Artnos. Terr. Phys., 47, 1211-1223, 1985.
Carlson, C.R., R.A. Helliwell, and U.S. Inan, Space-time evolution of whistler mode wave growth in the magnetosphere, J. Geophys. Res., 95, 15,073-15,089, 1990. Denavit, J., and R.N. Sudan, Whistler sideband instability, Phys.
Fluids, 18, 575-584, 1975.
Helliwell, R.A., A theory of discrete VLF emissions from the magnetosphere, J. Geophys. Res., 72, 4773-4790, 1967. Helliwell, R.A., VLF wave stimulation experiments in the
magnetosphere from Siple station, Antarctica, Rev. Geophys.,
PARROT : POWER LINE HARMONIC RADIATION OBSERVATIONS 3969
Helliwell, R.A., J.P. Katsufrakis, T.F. Bell and R. Raghuram, VLF line radiation in the Earth's magnetosphere and its association with power system radiation, J. Geophys. Res.,
80, 4249-4258, 1975.
Kikuchi, H., Overview of power-line radiation and its coupling to the ionosphere and magnetosphere, Space $ci. Rev., 35, 33-
41, 1983.
Kimura, I., H. Higuchi, K. Hashimoto, N. Sato, and T. Matsudo, Relationship between power line radiation and VLF wave activities observed in Iceland, Mere. Natl. Inst. Polar Res. Spec. Issue, Jpn., 47, 97-108, 1987.
Koons, H.C., M.H. Dazey, and B.C. Edgar, Satellite observation
of discrete VLF line radiation within transmitter-induced
amplification bands, J. Geophys. Res., 83, 3887-3889, 1978.
Matsumoto, H., Nonlinear whistler mode interactions and
triggered emissions in the magnetosphere: A review, in Wave Instabilities in Space Plasma, pp. 163-190, D. Reidel,
Norwell, Mass., 1979.
Matthews, J.P., and K. Yearby, Magnetospheric VLF line radiation observed at Halley, Antarctica, Planet. Space $ci.,
29, 97-106, 1981.
Matthews, J.P., Y. Omura, and H. Matsumoto, Some PLHR phenomena and their explanation, in biternational Wroclaw Sy•nposium on Electromagnetic Compatibility, pp. 55-59, Technical University of Wroclaw, Poland, 1984a.
Matthews, J.P., Y. Omura, and H. Matsumoto, A study of particle trapping by whistler mode waves in the geomagnetic field: The early development of the VLF quiet band, J. Geophys. Res., 89, 2275-2287, 1984b.
Molchanov, O.A., M. Parrot, M.M. Mogilevsky, and F. Lefeuvre, A theory of PLHR emissions to explain the weekly variations of ELF data observed by a low-altitude satellite, Ann. Geophys., 9, 669-680, 1991.
Neubert, T., T.F. Bell, and L.R.O. Storey, Resonance between coherent whistler mode waves and electrons in the topside ionosphere, J. Geophys. Res., 92, 255-265, 1987.
N•ann, D., A theory of VLF emissions, Planet. Space $ci., 19,
114!-1167, 1971.
Nunn, D., The sideband instability of electrostatic waves in an inhomogeneous medium, Planet. Space $ci., 21, 67-88, 1973. Nunn, D., The quasistatic theory of triggered VLF emissions,
Planet. Space $ci., 32, 325-350, 1984.
Nunn, D., A nonlinear theory of sideband stability in ducted whistler mode waves, Planet. Space Sci., 34, 429-451, 1986. Omura, Y., D. Nunn, H. Matsumoto, and M.J. Rycrof•, A
review of observational, theoretical and numerical studies of
VLF triggered emissions, J. Atmos. Terr. Phys., 53, 351-368,
1991.
Park, C.G., and D.C.D. Chang, Transmitter simulation of power line radiation effects in the magnetosphere, Geophys. Res.
Left., 5, 861-864, 1978.
Park, C.G., and R.A. Helliwell, Magnetospheric effects of power
line radiation, Science, 200, 727-730, 1978.
Park, C.G., and R.A. Helliwell, Power line radiation in the
magnetosphere, Adv. Space Res., 1,423-437, 1981. Parrot, M., World map of ELF/VLF emissions as observed by a
low-orbiting satellite, Ann. Geophys., 8, 135-146, 1990. Parrot, M., O.A. Molchanov, M.M. Mogilevski, and F.
Lefeuvre, Daily variations of ELF data observed by a low altitude satellite, Geophys. Res. Left., 18, 1039-1042, 1991. Sh, L.A.D., A wave-particle-wave interaction mechanism as a cause of VLF triggered emissions, J. Geophys. Res., 95,
12,277-12,286, 1990.
Stix, T. H., The Theory of Plasma Waves, pp. 9-13, McGraw-
Hill, New York, 1962.
Sudan, R.N., and E. Ott, Theory of triggered VLF emissions, J. Geophys. Res., 76, 4463-4476, 1971.
Tanaka, Y., D. Lagoutte, M. Hayakawa, F. Lefeuvre, and S. Tajima, Spectral broadening of VLF transmitter signals and
sideband structure observed on Aureol 3 satellite at middle
latitudes, J. Geophys. Res., 92, 7551-7559, 1987.
Tatnall, A.R.L., J.P. Matthews, K. Bullough, and T.R. Kaiser, Power-line harmonic radiation and the electron slot, Space
$ci. Rev., 35, 139-173, 1983.
Tomizawa, I., and T. Yoshino, Power line radiation over northern Europe observed on the balloon B•5-1 N, Mean. Natl. Inst. Polar Res. Spec. Issue, Jpn., 31, 115-123, 1984. Tomizawa, l., and T. Yoshino, Power line radiation observed by
the satellite OHZORA, J. Geomagn. Geoelectr., 37, 309-327,
1985.
Yearby, K.H., A.J. Smith, T.R. Kaiser, and K. Bullough, Power
line harmonic radiation in Newfoundland, J. Atmos. Terr.
Phys., 45, 409-419, 1983.
M. Parrot, Laboratoire de Physique et Chimie de l'Environnement, CNRS, 3A, Avenue de la Recherche Scientifique, 45071 Orl6ans cedex 02, France.
(Received June 11, 1993; revised August 16, 1993; accepted August 31, 1993.)