HAL Id: hal-00316700
https://hal.archives-ouvertes.fr/hal-00316700
Submitted on 1 Jan 2000
HAL is a multi-disciplinary open access
archive for the deposit and dissemination of sci-entific research documents, whether they are pub-lished or not. The documents may come from teaching and research institutions in France or abroad, or from public or private research centers.
L’archive ouverte pluridisciplinaire HAL, est destinée au dépôt et à la diffusion de documents scientifiques de niveau recherche, publiés ou non, émanant des établissements d’enseignement et de recherche français ou étrangers, des laboratoires publics ou privés.
Dayside ionospheric response to changes in IMF
polarity: optical and plasma-flow observations
S. E. Pryse, A. M. Smith, L. Kersley
To cite this version:
S. E. Pryse, A. M. Smith, L. Kersley. Dayside ionospheric response to changes in IMF polarity: optical and plasma-flow observations. Annales Geophysicae, European Geosciences Union, 2000, 18 (7), pp.782-788. �hal-00316700�
Dayside ionospheric response to changes in IMF polarity:
optical and plasma-¯ow observations
S. E. Pryse, A. M. Smith, L. Kersley
Department of Physics, University of Wales, Aberystwyth, SY23 3BZ, UK e-mail: [email protected]
Received: 20 September 1999 / Revised: 17 January 2000 / Accepted: 18 February 2000
Abstract. The response of the dayside ionosphere to changes in polarity of the interplanetary magnetic ®eld was observed by two independent techniques. The signatures were seen in the 630.0 nm red-line emission, measured by a meridian scanning photometer at Ny-AÊlesund on Svalbard, and also in the line-of-sight plasma velocities monitored by the Finland CUTLASS Super-DARN radar. A time dierence of some 6 to 8 min occurred between the responses of the two techniques, with the ¯ows being ®rst to respond. In the present case study, the longer delay in the optics suggests that ion precipitation controls the auroral emission.
Key words: Ionosphere (ionosphere-magnetosphere interactions) ± Magnetospheric physics (magnetosphere-ionosphere interactions; polar cap phenomena)
1 Introduction
The polar ionosphere is strongly in¯uenced by the interaction of the interplanetary magnetic ®eld (IMF) with the geomagnetic ®eld. Sandholt et al. (1998a) demonstrated the use of IMF clock angle as an ordering parameter for classi®cation of cusp auroral activity. Type 1 aurora, which are found between 70 and 74° MLAT, are characteristic of southward IMF (clock angle 90± 180°), while type 2 forms at about 78±79° MLAT are the signature of northward IMF with a clock angle of less than 45°. For intermediate clock angles of 45±90°, both type 1 and type 2 auroral emissions can coexist. Type 1 and type 2 aurorae are interpreted as candidate footprints of equatorial and lobe reconnection respectively. The optical response to rotations of the IMF was discussed by Sandholt et al. (1998b). The IMF control of high-latitude plasma convection is taken as evidence that magnetic
reconnection plays a dominant role in generation of polar-cap ¯ows. The dependence of the ¯ow pattern on IMF has been illustrated by Rei and Burch (1985) and Heppner and Maynard (1987), and recently reviewed by Cowley (1998). Under southward IMF (Bz < 0), a two-cell ¯ow pattern comprises antisunward ¯ow over the polar regions, where ®eld-lines are open, with return ¯ows on closed ®eld at lower latitudes in the dawn and dusk sectors. For northward IMF (Bz > 0), a multi-cell pattern results, with sunward ¯ow within the polar cap. The By component of the IMF distorts the dawn-dusk symmetry of the cells, with the tension force pulling newly opened ®eld-lines east or west depending on the sign of By (Cowley et al., 1991). Radar observations of changes in the ionospheric ¯ow due to changes in IMF have shown a rapid response of the high-latitude ionosphere near noon, on time scales of no longer than a few minutes, with the eect subsequently propagating to other time sectors on scales of about ten minutes (Todd et al., 1988). Hairston and Heelis (1995), using data derived from the DMSP satellites, measured longer response times of typically 20 to 40 min, with changes for northward-to-southward turnings of the IMF being more rapid than those for southward-to-northward turnings. The dierence in the time scales of the two studies was attributed to the method of observation, with the latter workers measuring the longer time required for the signatures of the ¯ow pattern to become established while the radar measured the time for local ionospheric response. Recent studies have used SuperDARN radar observations to investigate the response time. Ruohon-iemi and Greenwald (1998) suggested that the response at all MLTs starts almost simultaneously with that near noon, with the pattern over the entire high-latitude zone recon®guring from that characteristic of Bz > 0 to that of Bz < 0 on a time scale of 2 to 4 min. In addition, Taylor et al. (1998) found that the dayside ¯ow started to respond within a few minutes of the estimated time of arrival at the ionosphere of the eect of an IMF turning, with the response subsequently extending in latitude and local time.
The current study focuses on a period of a distinct pattern of changes in the IMF on 24 January, 1998. Observations are presented from two independent tech-niques, showing ionospheric responses near magnetic noon to the IMF variations. Signatures in 630.0 nm red-line emission were measured by a meridian scanning photometer (MSP) at Ny-AÊlesund on Svalbard. The ¯ow response was observed in line-of-sight plasma velocities monitored by the Finland CUTLASS Super-DARN radar. The relative response time of the obser-vations obtained by the two techniques is discussed. 2 Observations
2.1 Interplanetary magnetic ®eld
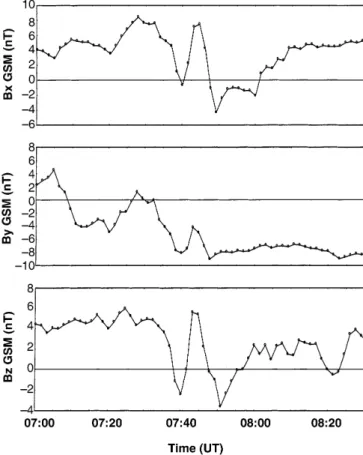
Figure 1 shows the three components of the IMF measured by the WIND satellite between 0700 UT and 0830 UT on the morning of 24 January, 1998. From 0700 UT to 0730 UT the Bz component was northward, with generally steady values of about 4.5 nT. During the next half-hour it underwent two clear southward excursions at about 0738 UT and 0747 UT, reaching minimum values of about )3 and )4 nT at about 0740 UT and 0751 UT respectively. These were sepa-rated by a period of clear northward IMF. Subsequently, the IMF resumed its northward orientation, but with Bz attaining smaller values of some 2 nT. The variation in
Bx is somewhat similar to that of Bz, with the two events coinciding generally with negative periods of Bx. While By is initially positive, it becomes negative, reaching values of some )8 nT at 0748 UT, though a weak positive turning around 0730 UT should be noted. The WIND satellite was upstream in the solar wind with co-ordinates of X = 233.4 Re, Y = 12.5 Re, Z = )20.3 Re. It measured a plasma ¯ow speed of some 410 km s)1 throughout the interval. The propagation
delay from satellite to magnetopause was estimated to be 70 5 min using the method of Taylor et al. (1998), where retardation across the bow-shock and magneto-sheath is considered. Observations by the ACE satellite con®rm the pattern of changes of the IMF, though the ®rst southward turning appears sharper, possibly be-cause the resolution of the measurements is 16 s, as opposed to 90 s for the WIND satellite.
Support for the time delay can be obtained from other observations. Examination of the H-component of the magnetic ¯uctuation measured on the ground by the magnetometer at Longyearbyen shows a broad correla-tion with the solar wind dynamic pressure seen by WIND, with a delay of about 70 min in accord with the formula estimate. A change detected by the magnetom-eter marks the arrival in the ionosphere of the eect of a ¯uctuation in the solar wind density and hence, for an assumed frozen-in plasma, of a variation in the IMF. 2.2 Optical emission
The intensity of the 630.0 nm emission recorded by the MSP at Ny-AÊlesund (78.9°N, 12.0°E) from 0835 UT to 0915 UT on 24 January is shown as a function of time and zenith angle in Fig. 2. The photometer scans essentially along the magnetic meridian with a repeat time of 16 s. Similar auroral forms (not shown) were observed simultaneously by a MSP located at Long-yearbyen (78.2°N, 15.7°E), though the active region of emission was further north in the ®eld of view as expected. During the ®rst 15 min shown here, the emission comprises only a broad, steady, type 2 enhancement in the northern ®eld-of-view, centred on 40° zenith (~78.0° MLAT). The enhanced activity persists in this northern region throughout the time interval, but at later times it shows some variation in latitude and intensity. Following a slight fading at about 0856 UT, there is a clear onset of intensi®cation at 0858 UT, with subsequent gradual fading. A second intensi®cation occurs a few minutes later. Whilst the onset of this is not seen in the Ny-AÊlesund data because of a small data gap, the Longyearbyen record showed the onset to be at 0908 UT. During the two periods of fadings in the type 2 forms, clear type 1 emissions develop near the zenith between 0856 UT and 0858 UT and 0903 UT and 0908 UT respectively. After 0908 UT there is coexistence of both type 1 and type 2 forms.
The interpretation of the optical signatures matches the IMF changes. The steady type 2 emission before 0856 UT re¯ects the initial background state of north-ward IMF, with clock angle generally less than 45°. The subsequent sequence of types 1, 2, 1 emissions is
Fig. 1. Components of the IMF measured by the WIND satellite on the morning of 24 January, 1998
in accord with the two southward turnings of the IMF separated by a distinct northward interval. Finally, the coexistence of type 1 and type 2 forms is as expected for a weakly northward IMF with By dominant. The time delays between the southward turning of the IMF seen at the satellite and the ionospheric optical response were approximately 78 min for the ®rst type 1 intensi®cation and 76 min for the second.
2.3 Plasma ¯ow
At the time of interest the Finland radar of the SuperDARN facility was observing a region encom-passing the ®eld-of-view of the MSP at Ny-AÊlesund. Line-of-sight velocities, with 2 min resolution, are shown in the top panel of Fig. 3 with positive values representing ¯ows towards the radar. These values have been obtained by averaging measurements in radar beams 6, 7, 8, 9 and 10 for ranges broadly within a latitude band between 77 and 84° MLAT. This region was selected because it gave general coincidence with the red-line optical emission. However, the data are mainly from the region of the type 2 aurora due to limited
availability of CUTLASS returns in the region of the type 1 forms. Initially the ¯ow was weakly towards the radar, but there is a clear apparent turning at 0848 UT with the line-of-sight velocity away from the radar attaining an average value of about 150 m s)1 at
0850 UT. Following a brief period of signi®cantly lower velocities a second interval of away ¯ow started at about 0857 UT with a maximum average velocity in excess of 250 m s)1 at 0900 UT. At later times ¯ow continued
away, but with diminishing magnitude. The variation in the line-of-sight velocity can also be interpreted in terms of the changes in IMF. Corresponding changes in the clock angle of the IMF are shown in the lower panel of Fig. 3. Comparison of the panels indicates a one-to-one correspondence with a delay time of about 70 min.
The details of the changes in the ¯ow patterns that can be related to the IMF can be seen from the plots of Fig. 4, line-of-sight convection velocities superposed on a geographic map for selected times throughout the extended period of interest. Figure 4a is characteristic of the situation before 0822 UT, essentially with the ¯ow at high latitudes toward the radar in the east and away in the west. With an IMF clock angle of less than 45° and By positive, the pattern can be interpreted as lobe cell convection in an enlarged dawn cell. Between 0822 UT and 0836 UT (Fig. 4b) the pattern changes so that the region of ¯ow towards the radar has extended to the
Fig. 3. Line-of-sight velocities measured by the CUTLASS Finland SuperDARN radar on the morning of 24 January, 1998 (upper panel). The velocities have been averaged over the general area of coincidence of the radar observations and red-line emission. Clock angle of the IMF for the morning of 24 January, 1998 (lower panel)
Fig. 2. Intensity of the 630.0 nm emission measured by the meridian scanning photometer at Ny-AÊlesund on the morning of 24 January, 1998, as a function of zenith angle
west in response to By turning negative. From 0836 UT to 0848 UT the ¯ow is towards in the centre of the ®eld-of-view and away at the sides (Fig. 4c), consistent with sunward convection between two lobe cells of roughly equal size with By ~ 0. There is a marked change in character between 0848 UT and 0852 UT with the convection being directed away from the radar over most of the ®eld-of-view (Fig. 4d), though there is a hint of ¯ow towards at the western edge (Fig. 4e). With the onset of Bz negative and By held <0, antisunward convection is established in the polar-cap entry, with the sunward ¯ow of the lobe cell being pushed to the dawn sector. From 0852 UT to 0858 UT (Fig. 4f), the toward ¯ow relocates from the western edge back into the ®eld-of-view as the antisunward convection relaxes in re-sponse to an IMF clock angle <45°. However, the general antisunward pattern is re-established between 0858 UT and 0902 UT (Fig. 4g) with the southward turning of the IMF. After 0902 UT the ¯ow is towards
(sunward) in the dawn sector but away (antisunward) in the east (Fig. 4h), in conformity to an IMF clock angle between 45° and 90° and By negative driving an enlarged dusk lobe cell coupled with the antisunward ¯ow of the merging cell. It is clear from the long sequence of patterns that on a broad scale there is such close correspondence between the detailed changes in IMF orientation and the convection ¯ow response that there is little possibility of ambiguity in the identi®cation of the exact sequence.
3 Discussion
The response of the ionosphere to changes in IMF has been observed by two dierent techniques. In particular, clear signatures of two southward turnings in Bz were seen in both red-line auroral emission and in the line-of-sight ¯ow velocities measured, with both sets of
Fig. 4a±d. Plots of line-of-sight velocities measured by the CUTLASS Finland SuperDARN radar at the selected times shown on the morning of 24 January, 1998
measurements demonstrating a one-to-one correspon-dence with the IMF. The optical response delayed the IMF measurements at the satellite by some 76 to 78 min, while the broad changes to the convection pattern lagged by only about 70 min. The dierence in the response times measured by the two techniques is thus some 6 to 8 min, much larger than any possible errors and is thus of signi®cance.
Previous studies have suggested that the response time of ionospheric convection to the arrival of a change in IMF Bz at the magnetopause can be rapid, on time scales of no more than a few minutes. Etemadi et al. (1988), using ¯ow measurements by the EISCAT inco-herent scatter radar, found changes in the magnetic noon to mid-afternoon sector on a scale of 3.9 2.2 min. Todd et al. (1988) measured response times of 5.5 3.2 min in the early to mid-afternoon sector and approximately 9.5 3.0 min in the mid-morning and dusk sectors. Rodger and Pinnock (1997) proposed a hypothesis for the initial ionospheric re-sponse to a ¯ux transfer event. They envisaged a rapid
out¯ow of magnetospheric electrons from ¯ux tubes that have just undergone reconnection, which estab-lished a ®eld-aligned current very rapidly in the vicinity of the open/closed ®eld line boundary. The rise time of the additional electric ®eld responsible for the initiation of the convection velocity variations was estimated to be ~100 s. Ruohoniemi and Greenwald (1998) observed a fast response in ¯ows measured by the SuperDARN HF radars to a Bz positive-to-negative turning, with the changes in the entire convection pattern occurring essentially simultaneously in the noon to midnight sectors within 2 to 4 min. They suggested that the changes in the dayside potential pattern may be com-municated throughout the high-latitude ionosphere at the speed of the fast AlfveÂn wave in seconds. Taylor et al. (1998) also found a prompt response in the dayside ¯ow to a change in polarity of IMF, with SuperDARN observations showing the ionospheric response starting within 2 min of the expected time of arrival at the ionosphere of the eect of the IMF. However, the response then expanded east-west and poleward on time
scales of ~7 and ~14 min respectively. The ionospheric ¯ow response observed in the current study is expected to be in accord with the observed time scales of minutes, relating to the propagation time of the AlfveÂn wave from the magnetopause to the dayside ionosphere. It is thus of importance to examine why the signatures in the auroral optical emissions are delayed by a further 6 to 8 min.
The auroral emissions result from particle precipi-tation into the ionosphere. The travel time for soft electrons from magnetopause to ionosphere is only of the order of 10 s, too small to account for the present results. It is thus possible that the ions control the emission. One possibility is that the red-line emission is a consequence of soft-ion precipitation, either through direct excitation of the atomic oxygen by the incoming protons or by indirect excitation, resulting from the ¯ux of electrons ejected from the atmospheric gases following bombardment with the incoming protons (Rees, 1982). However, proton-exited aurorae would be expected to be spatially diuse, while the discrete nature of the observed emission suggests that it was produced by incoming electrons. Thus an alternative possibility is that the ions tend to control the motion of the electrons to maintain charge quasi-neutrality (Bur-ch, 1985), causing a delay in the time of arrival of the electrons at the ionosphere and allowing excitation by electron precipitation as a possible primary source for the observed red emission. It can be noted that Moen et al. (1998) documented a correlation on the dayside between 630.0 nm and Hb emissions indicative of
protons. The time-of-¯ight of the precipitating protons from magnetopause to ionosphere can be estimated using the method of Lockwood and Smith (1992). The ions, considered with zero pitch angle at all altitudes, were taken to have energies of 200 eV, in keeping with energy deposition in the F-region. The location of the magnetopause at the time of interest has been estimat-ed as about 8 Re (Taylor et al., 1998 and references therein). The virtual distance of travel of the ions was set to 18 Re, towards the lower end of the range suggested by Lockwood and Smith (1992). The time-of-¯ight of the ions was estimated to be almost 10 min, with a further delay of up to 2 min possible before emission due to the lifetime of O(1D). Thus the
observed time dierence in the observations by the two techniques is consistent with the previous estimates of ¯ow response and the ion time of ¯ight. The ion travel time estimated could possibly have arisen because the reconnection site was `o-nose', consistent with the polarities of Bx and By. For example when Bz is negative, then a negative Bx may cause the recon-nection to be south of the equatorial plane, while a non-zero By could move the site to one of the ¯anks. Both situations could result in longer travel times for the ions, not only from the increased path length but also because the initial ion populations may be `softer', that is of lower energy. However, discussion here of possible scenarios for the exact locations of the reconnection sites and the draping of the ®eld-lines
would be essentially conjecture, based on details at the limits of the experimental observations.
4 Conclusion
A signi®cant time dierence of about 6 to 8 min has been observed between the response to the IMF rotation in the convection and the red-line auroral emission. The dierence can be explained by the dierent modes of propagation from magnetopause-to-ionosphere for the two sets of observations. Previous studies suggest that convection in the noon sector responds on time scales of a few minutes (~5 min). Estimates based on the time-of-travel of precipitating soft ions and atomic state lifetime give a delay in the optical response of some 12 min. The dierence between the two propagation times is broadly in accord with the observed time delay of some 6 to 8 min between the responses to the changes in IMF Bz in the measurements by the two dierent techniques. The results provide indication that the ions play a role in controlling the optical auroral response.
Acknowledgements. Financial support for the project has been provided by the UK Particle Physics and Astronomy Research Council under Grant PPA/G/S/1997/00269. We are grateful to Dr Joran Moen of UNIS for access to the optical observations made by the University of Oslo at Ny-AÊlesund. The CUTLASS radar is a UK National Facility funded by the Particle Physics and Astron-omy Research Council. WIND data have been provided by R. Lepping at NASA/GSFC.
Topical Editor M. Lester thanks C. J. Farrugia and R. W. Smith for their help in evaluating this paper.
References
Burch, J. L., Quasi-neutrality in the polar cusp, Geophys. Res. Lett., 12, 469±472, 1985.
Cowley, S. W. H., Excitation of ¯ow in the Earth's magnetosphere-ionosphere system: observations by incoherent scatter radar, in Polar cap boundary phenomena, Eds. J. Moen et al., NATO Advanced Science Institutes Series, Kluwer, Dordrecht, The Netherlands, 509, 127±140, 1998.
Cowley, S. W. H., J. P. Morelli, and M. Lockwood, Dependence of convective ¯ows and particle precipitation in the high-latitude dayside ionosphere on the X and Y components of the interplan-etary magnetic ®eld, J. Geophys. Res., 96, 5557±5564, 1991. Etemadi, A., S. W. H. Cowley, M. Lockwood, B. J. I. Bromage,
D. M. Willis, and H. LuÈhr, The dependence of high-latitude dayside ionospheric ¯ows on the north-south component of the IMF: a high time resolution correlation analysis using EISCAT ``Polar'' and AMPTE UKS and IRM data, Planet. Space Sci., 36, 471±498, 1988.
Hairston, M. R., and R. A. Heelis, Response time of the polar ionospheric convection pattern to changes in the north-south direction of the IMF, Geophys. Res. Lett., 22, 631±634, 1995. Heppner, J. P., and N. C. Maynard, Empirical high-latitude electric
®eld models, J. Geophys. Res., 92, 4467±4489, 1987.
Lockwood, M., and M. F. Smith, The variation of reconnection rate at the dayside magnetopause and cusp ion precipitation, J. Geophys. Res., 97, 14 841±14 847, 1992.
Moen, J., D. A. Lorentzen and F. Sigernes, Dayside moving auroral forms and bursty proton auroral events in relation to particle boundaries observed by NOAA 12, J. Geophys. Res., 103, 14 855±14 863, 1998.
Rei, P. H., and J. L. Burch, IMF By-dependent plasma ¯ow and Birkeland currents in the dayside magnetosphere 2. A global model for northward and southward IMF, J. Geophys. Res., 90, 1595±1609, 1985.
Rees, M. H., On the interaction of auroral protons with the Earth's atmosphere, Planet. Space Sci., 30, 463±472, 1982.
Rodger, A. S., and M. Pinnock, The ionospheric response to ¯ux transfer events: the ®rst few minutes, Ann. Geophysicae, 15, 685± 691, 1997.
Ruohoniemi, J. M., and R. A. Greenwald, The response of high-latitude convection to a sudden southward IMF turning, Geophys. Res. Lett., 25, 2913±2916, 1998.
Sandholt, P. E., C. J. Farrugia, J. Moen, é. Noraberg, B. Lybekk, T. Sten, and T. Hansen, A classi®cation of dayside auroral forms and activities as a function of
interplanetary magnetic ®eld orientation, J. Geophys. Res., 103, 23 325±23 345, 1998a.
Sandholt, P. E., C. J. Farrugia, J. Moen, and S. W. H. Cowley, Dayside auroral con®gurations: Responses to southward and northward rotations of the interplanetary magnetic ®eld, J. Geophys. Res., 103, 20 279±20 295, 1998b.
Taylor, J. R., S. W. H. Cowley, T. K. Yeoman, M. Lester, T. B. Jones, R. A. Greenwald, G. Sofko, J.-P. Villain, R. P. Lepping, and M. R. Hairston, SuperDARN studies of the ionospheric convection response to a northward turning of the inter-planetary magnetic ®eld, Ann. Geophysicae, 16, 549±565, 1998. Todd, H., S. W. H. Cowley, M. Lockwood, D. M. Willis, and
H. LuÈhr, Response time of the high-latitude dayside ionosphere to sudden changes in the north-south component of the IMF, Planet. Space Sci., 36, 1415±1428, 1988.