HAL Id: hal-00330908
https://hal.archives-ouvertes.fr/hal-00330908
Submitted on 15 Feb 2006
HAL is a multi-disciplinary open access
archive for the deposit and dissemination of
sci-entific research documents, whether they are
pub-lished or not. The documents may come from
teaching and research institutions in France or
abroad, or from public or private research centers.
L’archive ouverte pluridisciplinaire HAL, est
destinée au dépôt et à la diffusion de documents
scientifiques de niveau recherche, publiés ou non,
émanant des établissements d’enseignement et de
recherche français ou étrangers, des laboratoires
publics ou privés.
Real-size experiments and 3-D simulation of rockfall on
forested and non-forested slopes
L. K. A. Dorren, F. Berger, U. S. Putters
To cite this version:
L. K. A. Dorren, F. Berger, U. S. Putters. Real-size experiments and 3-D simulation of rockfall on
forested and non-forested slopes. Natural Hazards and Earth System Science, Copernicus Publications
on behalf of the European Geosciences Union, 2006, 6 (1), pp.145-153. �hal-00330908�
Natural Hazards and Earth System Sciences, 6, 145–153, 2006 SRef-ID: 1684-9981/nhess/2006-6-145
European Geosciences Union
© 2006 Author(s). This work is licensed under a Creative Commons License.
Natural Hazards
and Earth
System Sciences
Real-size experiments and 3-D simulation of rockfall on forested and
non-forested slopes
L. K. A. Dorren1, F. Berger1, and U. S. Putters2 1Cemagref Grenoble, St. Martin d’H`eres cedex, France 2ecoRisQ, St. Martin d’H`eres, France
Received: 16 September 2005 – Revised: 24 November 2005 – Accepted: 9 December 2005 – Published: 15 February 2006
Part of Special Issue “Spatial prediction modeling in natural hazards and risk”
Abstract. Only a few rockfall simulation models take into
account the mitigating effect of existing forest cover. The objective of our study was to improve the generic rockfall simulation model RockyFor, which does take the effect of forest stands into account, thereby developing a clear method for quantifying and modelling slope surface characteristics based on quantitative field data. To obtain these data we car-ried out 218 real-size rockfall experiments on forested and non-forested sites on a mountain slope in the French Alps. On the basis of a polygon map representing different diame-ter classes of the madiame-terial covering the slope, we dediame-termine the mean obstacle height (MOH) for each homogeneous unit at the experimental sites. We proposed an algorithm for calculating the tangential coefficient of restitution using the MOH. Comparing the simulated and observed data from the real-size rockfall experiments showed that the 3-D combined deterministic-probabilistic rockfall simulation model Rock-yFor accurately predicted rockfall events on a non-forested (Root Mean Square Error = 17%) and a forested site (Root Mean Square Error = 12%). We conclude that for further improvement of rockfall-forest simulation on different slope types more quantitative data is required on (1) the energy dissipative capacity of shrubs and bushes (e.g. in coppice stands), (2) the effect of the slope material, (3) the rock shape as well as the rock size, and (4) the tangential and normal co-efficient of restitution. Based on the presented results we can state that the RockyFor model could contribute to better tak-ing into account the mitigattak-ing effect of the existtak-ing forest cover when planning protective measures.
1 Introduction
To sustain and protect livelihoods in the European Alps to-day, forests are indispensable. They cover the steep slopes of the main valleys and protect these developed and densely
Correspondence to: L. K. A. Dorren
populated areas against rapid mass movements that pose risks to infrastructure and inhabitants. Well-known exam-ples are rockfall, defined in this paper as the fall of single rocks and stones with a volume smaller than 5 m3 (Jahn, 1988; Gsteiger, 1993; Erismann and Abele, 2001; Berger et al., 2002), and snow avalanches (Berger, 1996; Weir, 2002). Without these forests, the costs of building and maintain-ing technical protective constructions would be unafford-able. This is recalled in the first paragraph of the Moun-tain Forest Protocol of the Alpine Convention: “mounMoun-tain forests provide the most effective, the least expensive and the most aesthetic protection against natural hazards.” In Aus-tria and Switzerland alone, approximately 50 million Euros are spent yearly to maintain or improve the protection pro-vided by mountain forests (European Observatory of Moun-tain Forests, 2000; Swiss Federal Statistical Office, 2002).
Forests cannot always provide sufficient protection. In the case of rockfall this is because slopes are too steep or too short, or the forest is degraded and its structure is not dense enough to stop falling rocks. In those cases protection could be provided by technical measures such as rockfall dams, nets, etc. Throughout the European Alps, rockfall simula-tion models are used in so-called trajectory studies, to esti-mate the hazard posed by rockfall to residential areas (hazard zonation) and traffic routes and to design such technical pro-tective measures.
A wide range of models exists, varying from 2-D statis-tical models to 3-D deterministic models (Guzzetti et al., 2002; Dorren, 2003). With the increasing digital mapping and spatial modelling possibilities, there is a tendency to-wards 3-D combined deterministic – probabilistic rockfall simulation models, both at local and regional scale (e.g. Lin-iger, 2000; Guzzetti et al., 2002; Dorren and Seijmonsber-gen, 2003; Dorren et al., 2004; Le Hir et al., 2004). The problematic part in rockfall models is the simulation of re-bounds. The majority of these models calculate a rebound by means of energy loss coefficients, also called coefficients of restitution. The most widely used ones are the tangential (rt)and the normal (rn) coefficient of restitution (Pfeiffer
146 L. K. A. Dorren et al.: Rockfall-forest simulation Figure captions
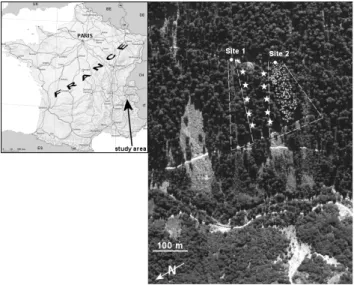
Figure 1. An orthophoto and a map showing the study area. The two round white dots indicate the start positions of the two sites. Site 1 is an avalanche track, which is denuded of trees, Site 2 is forested. The abundant white points at Site 2 are the mapped positions of all the trees present before the experiments. The white stars indicate the camera positions on both experimental sites.
23 Fig. 1. An orthophoto and a map showing the study area. The two
round white dots indicate the start positions of the two sites. Site 1 is an avalanche track, which is denuded of trees, Site 2 is forested. The abundant white points at Site 2 are the mapped positions of all the trees present before the experiments. The white stars indicate the camera positions on both experimental sites.
and Bowen, 1989; Budetta and Santo, 1994; Chau et al., 1998, 2002; Guzzetti et al., 2002; Agliardi and Crosta, 2003; Schweigl et al., 2003; Dorren et al., 2004). These coeffi-cients are generally derived from literature data, whereas the difference between the characteristics of the material cover-ing the slope surface and those of the fallcover-ing rock itself are often neglected. To account for local variation, the coeffi-cients of restitution are often randomly varied within a given distribution. For local studies, no standard methods exist for estimating the coefficients in the field. Another parameter that is often used in rockfall simulation models is the slope variation coefficient, to account for fine scale variations in the slope topography (Pfeiffer and Bowen, 1989; Spang and Krauter, 2001; Dorren et al., 2004). This coefficient is gen-erally calculated on the basis of the rock radius and the size of the material covering the slope surface.
Only a few rockfall simulation models take into ac-count the mitigating effect of the existing forest cover (e.g. Zinggeler et al., 1990; Liniger, 2000, Dorren and Seijmons-bergen, 2003; Dorren et al., 2004; Le Hir et al., 2004), but generally this effect is neglected. As a result, the rockfall hazard under forested slopes is often overestimated and the protective measures that are taken are too expensive. In many cases, innovative forest management could be sufficient to reach an acceptable level of safety. In the remaining cases, where technical protective measures are needed, the existing forest cover often reduces the rockfall energies and rebound heights, which would mean that more modest protective con-structions would suffice.
Two steps are critical for improving the earlier mentioned rockfall hazard assessment studies in the European Alps. The first one is quantifying the effect of protection forests
on rockfall hazards by using rockfall simulation models that simulate rockfall in 3-D and explicitly take the barrier effect of protection forests into account. The second step is de-veloping a clear method for quantifying and modelling slope surface characteristics. The objective of our study was to improve the generic rockfall simulation model RockyFor de-veloped by Dorren et al. (2004), thereby developing a clear method for quantifying and modelling slope surface charac-teristics based on quantitative field data. To obtain these data we carried out 218 real-size rockfall experiments on forested and non-forested sites on a mountain slope in the French Alps.
2 Materials and methods
2.1 Real-size rockfall experiments
Our study area is situated in the Forˆet Communale de Vaujany in France (lat 45◦120, long 6◦30) and has an altitude ranging from 1200 m to 1400 m above sea level (Fig. 1). There we threw large, individual rocks (spherical shaped rocks with a mean diameter of 0.95 m) down the slope, which has a mean gradient of 38◦. By using field measurements and video cameras we captured the velocity and the trajectory of the rock in 3-D. In addition we mapped and measured the size of all tree damages. We carried out these experiments on two sites, of which the central downslope axes were approx-imately 120 m apart from each other. Site 1 (approx. 1.1 ha) covers an avalanche track and is therefore denuded of trees (unstocked). Site 2 (approx. 0.9 ha) is covered by forest, except for the upper first 40 m, which is the distance neces-sary for a block of 1 m3to reach its maximal speed (Gsteiger, 1993; Brauner et al., 2005). The site is representative for active rockfall slopes in the European Alps. The main tree species in the study area are Silver fir (Abies alba – 50%), Norway spruce (Picea abies (L.) Karst. – 25%), beech
(Fa-gus sylvatica – 17%) and Sycamore (Acer pseudoplatanus L.
– 4%). The mean stand density on Site 2 before the exper-iments was 290 trees per hectare and the mean stem diam-eter at breast height (DBH) was 31 cm (standard deviation 21 cm).
During all the experiments the protocol was identical. Be-fore each single rockfall experiment, we coloured the rock to be thrown with biodegradable paint, so it left traces af-ter rebounding on the slope surface or impacting tree stems on Site 2. A caterpillar was used to throw the rocks down the slope. After each single rockfall experiment, we captured the trajectory of the rock with an Impulse LR 200 laser distance meter manufactured by Laser Technology, Inc. (Centennial, Colorado, USA) by measuring the distance and direction be-tween each subsequent impact on the ground or against a tree. This was done to obtain information about the rockfall trajectories in 3-D, as the five digital high-speed cameras, which were installed along the experimental site, only pro-vide a 2-D view. The cameras were fixed at a height of 10 m in trees that are situated 30 m away from the experimental
L. K. A. Dorren et al.: Rockfall-forest simulation 147
rockfall paths of the two sites. In addition, we described and measured all the tree impacts and the resulting damages on trees. In total, we captured the trajectories of 100 rocks on Site 1 and 118 rocks on Site 2. On Site 2, only 102 rocks could be used for analysis. Three reasons for not using the remaining 16 rocks were: 1) they stopped within the first ten meters after sliding on the slope surface, 2) their rockfall path was too far away from the cameras due to lateral deviation of the falling rock, or 3) they broke into pieces during impacts on trees or on the slope surface. On average we managed to carry out eight rockfall experiments per day. Additional de-tails of the experiments are described in Dorren et al. (2005). Before the experiments, we made a map that covered Site 2, which depicted the surface characteristics in 70 poly-gons with homogeneous terrain properties. The average size of these polygons was 103 m2, the minimal size was 7 m2. In each polygon (n=70) we measured the mean soil depth (ma-terial consisting of gravel size class and smaller), and we es-timated the mean rock diameter of 70% of the rocks covering the slope surface in the polygon and the same for 20% and 10% of the surface cover. The redistribution into these three cover classes proved to work well after extensive testing in the terrain on different slope surfaces.
In parallel, we analysed the surface roughness at the posi-tions of rock impacts on the ground by measuring the maxi-mal height variance of the material on the ground at the im-pact position, which was a clear imim-pact crater in about 20% of all cases. The latter was done to investigate if there is a relationship between the size of the material on the slope sur-face, the radius of the falling rock and the energy loss during a rebound on the slope surface as described by Kirkby and Statham (1975).
In addition to the surface cover map, we created a Dig-ital Elevation Model (DEM) with a resolution of 2.5 m for the two sites. This has been done with the Inverse Distance Weighted interpolation method using on average 3 points per cell. The point data has been collected in the terrain with a detailed topographical survey using the laser distance meter and a compass.
2.2 Calculating the rockfall impact energy
We analysed the digital films of the rockfall trajectories us-ing a free downloadable program called AviStep, which has been developed by M. Delabaere (Saint Denis de la R´eunion, France). This program allows extracting the position and the velocity of a moving particle for each individual image in a digital film. The principle is as follows. First, each film has to be referenced in x and y direction, which means that in the first image of each film, we defined the distance in me-ters between two known points in the terrain, which were also clearly recognisable on the first film image. Then, we analysed the trajectory of each falling rock in 2-D using a sequence of movie images. Since we used high-speed dig-ital cameras we were able to register the velocities (both in x and y direction, as well as the resultant translational ve-locity) of each falling rock every 1/25th second. Therefore,
we could accurately determine the translational velocity of a falling rock before and after impacting a tree. Determining the angular velocity was more difficult, as we had to deter-mine the number of sequential images for the rock to rotate once, which was not always easy to recognise.
Before each rockfall experiment we measured the volume of the rock. All rocks had approximately the same shape (spherical), volume (average 0.49 m3on both sites) and den-sity (2800 kg m−3). With this information we could deter-mine the mass of the rock and therefore the translational ki-netic energy (Ek−trans)as well as the rotational energy (Erot)
at any given point in its trajectory, given that the rock was clearly visible on the movie images.
2.3 Rockfall simulation model
Within this study we improved the rockfall model developed by Dorren et al. (2004). This model, called “RockyFor”, cal-culates 1) runout zones of rockfall events on both forested and non-forested slopes, 2) trajectories, velocities, and trans-lational and rotational energies of falling rocks, and 3) im-pacts against tree stems, potential stem breakage and the re-sulting energy loss. RockyFor is a process-based model that simulates rockfall in 3-D. It uses raster maps as input that de-scribe (1) the Digital Elevation Model (DEM), (2) the rock-fall source cells, (3) the elasticity of the surface material per cell, (4) the roughness of the slope surface per cell (expla-nation of the elasticity and the surface roughness follows), (5) the number of trees per cell, (6) the diameters of the trees in each cell, and (7) the tree species per cell. Rock-yFor assumes that each rockfall source cell poses the same risk and simulates, one after another, the trajectories of a given number of rocks (10. . . 100 000) per rockfall source cell. The model accounts for flying, rolling and bouncing within a raster cell. Moreover, RockyFor can explicitly sim-ulate rockfall impacts against individual trees, as investigated by Jahn (1988), Gsteiger (1993), Berger and Lievois (1999) and Dorren and Berger (2006). The main components of the model are (1) the calculation of the rockfall trajectory, (2) the calculation of energy loss due to impact against trees, and (3) the calculation of the velocity of the falling rock.
The trajectory of the simulated falling rock is primarily de-termined by the topography and is calculated by a multiple fall direction method. At every step in the simulation, the fall direction of the rock can be towards one of the downs-lope cells from the cell where the rock is located during that simulation step. The exact procedure is described by Dorren et al. (2004). Thus, other than the widely used wa-ter flow direction calculation methods, the model is able to produce diverging rockfall trajectories instead of converging patterns. A restriction enforced by the model is that, af-ter a rebound on the slope surface, the rock cannot deviate more than 45◦laterally from its fall direction before the re-bound. Changes in the fall direction due to rebounds on the slope surface change only between two raster cells, within the raster cell the fall direction does not change unless im-pacts against trees occur. Observations in the field showed
148 L. K. A. Dorren et al.: Rockfall-forest simulation
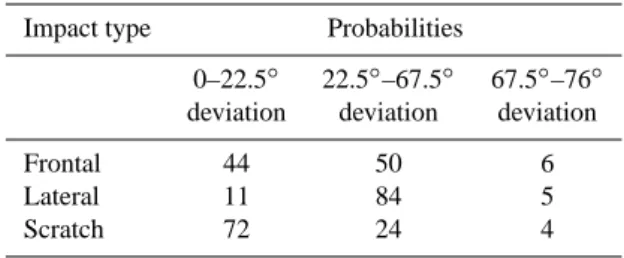
Table 1. Probabilities for deviation to the left or right from the
impact direction after a tree impact (for the tree impact types frontal, lateral and scratch).
Impact type Probabilities
0–22.5◦ 22.5◦–67.5◦ 67.5◦–76◦ deviation deviation deviation
Frontal 44 50 6
Lateral 11 84 5
Scratch 72 24 4
that extreme deviations of rocks from principal fall lines are mainly caused by tree impacts, distinct changes in topogra-phy, or the rock shape (disc shaped rocks or other shapes differing significantly from spheres). The first two are inte-grated in our model, the latter is not.
2.4 Energy loss due to impact against trees
As observed during the experiments, after a tree impact the trajectory of a rock can be deviated laterally up to 76◦from its fall direction before the tree impact. This accounts for the incoming and outgoing direction in a circle with a radius of 5 m around the tree. Of course, locally, meaning around the tree stem, this deviation between the fall direction before and after the impact can be even 180◦. The deviation of the rock depends on the position of the rock with respect to the tree stem at the time of impact. Three main impact types have been defined (see Dorren et al., 2005). Based on these three types, the probabilities in Table 1 in combination with a uniformly distributed randomiser are used to calculate the deviation.
The impact position is also required for calculating the en-ergy loss due to tree impacts. In addition, the diameter of the tree and the kinetic energy of the rock before the impact are needed. An input raster for the x-coordinate and one for the y-coordinate of the centre of the tree determine the tree posi-tions. If the exact positions of the trees in the study area are not available, trees are randomly placed within each pixel, based on the number of trees assigned to each pixel (derived from the number of trees per hectare) and the diameter distri-bution. As the rock is modelled in 3-D, its position is known within each raster cell. If an impact takes place, the rock loses a fraction of its kinetic energy according to the follow-ing sigmoidal function:
1E = −0.046+ 0.98 + 0.046
1 + 10(0.58−((P i−CT A)/0.5×DBH ))×(−8),(1)
where, 1E = Percentage of maximum amount of energy that can be dissipated by the tree (%), Pi-CTA = horizontal dis-tance between the impact and vertical central tree axis (m) and DBH = stem diameter at breast height (m).
The maximum amount that can be dissipated by a specific tree with a certain diameter is determined by the stem diam-eter and the tree species following:
max E. diss. = F E ratio × 38.7 × DBH2.31, (2) where, max E. diss. = maximum amount of kinetic energy that can be dissipated by a tree in kJ, FE ratio = the fracture energy ratio of a given tree species to Abies alba described by Dorren and Berger (2006) and DBH = stem diameter at breast height (cm).
The algorithms presented above have been developed by Dorren and Berger (2006) and are based on data obtained with the real-size rockfall experiments. By using a FE ratio of 1, Eq. (2) represents the function of the maximum energy that can be dissipated by an Abies alba in relation to its diam-eter. With respect to rockfall, this tree can be considered to be representative for a tree with an average energy dissipative capacity.
2.5 Velocity of the falling rock
The velocity of the falling rock during its flight through the air is calculated with standard algorithms for a uniform ac-celerated parabolic movement through the air. The velocity after a rebound or bounce on the slope surface is calculated with algorithms modified from Pfeiffer and Bowen (1989), as presented in Dorren et al. (2004). During each bounce the slope angle at the exact location of the bounce is uniform ran-domly decreased with an angle that varied between 0 and 4◦. This procedure is similar to the varying impact angle based on the surface roughness as described by Jones et al. (2000). Energy loss is determined by the elasticity of the surface material, defined by the so-called normal coefficient of resti-tution (rn) and by the roughness of the slope surface, de-fined by a tangential coefficient of restitution (rt). Dorren et al. (2004) showed that the change of velocity after a re-bound is mainly determined by the tangential coefficient of restitution and the slope angle at the rebound position. Both parameters are determined by the composition and size of the material covering the surface and the radius of the falling rock itself, since for larger rocks the effective surface rough-ness is lower than for smaller rocks, as shown by Kirkby and Statham (1975), and analogue to the principle of the slope variation coefficient used by, e.g. Pfeiffer and Bowen (1989), Spang and Krauter (2001) and Dorren et al. (2004). There-fore, we proposed the following algorithm to calculate the rt:
rt =
1
1 + (MOH /Rrock), (3)
where, MOH is the maximum obstacle height at the slope surface (m) and Rrock is the radius of the falling rock (m).
In the actual calculation of the velocity after a rebound, RockyFor randomly varies the value of the rtwith 10% using a uniform distribution, to account for the local variation in the size of material covering active rockfall slopes.
L. K. A. Dorren et al.: Rockfall-forest simulation 149
The data obtained with the rockfall experiments provide the possibility to assess the validity of this algorithm. We analysed 22 rebounds on the slope surface by using the video images and calculated the tangential coefficient of restitution taking the ratio of the tangential velocity (parallel to the slope surface) of the rock before the impact and the tangential ve-locity after the impact. We related these data with the max-imal height variance of the material on the ground at the re-bound positions. To determine the strength of relationships we calculated the coefficient of determination (R2)and its level of significance (P ).
It is not possible to measure the MOH everywhere on an active rockfall slope. As it is feasible to make a polygon map with mean diameters of the material covering the sur-face classified in different diameter classes, it would be prac-tical if the rt could be estimated on the basis of such a map. We chose to map three different diameter classes that are rep-resentative for 70%, 20%, and 10% of the average diameters of the material covering the surface in a mapped polygon. To test this method, we related the measured MOH values at the rebound positions to the mean diameters of the material cov-ering the slope as derived from our polygon map. For that, we tested two different approaches. Firstly, we calculated the mean diameter in a polygon following,
d =0.7 × d70+0.2 × d20+0.1 × d10, (4)
where d = mean diameter of the material covering the sur-face in a polygon, and dx= the mean material diameter of the 70%, 20%, or 10% class in the polygon. Subsequently, the simulated rock encountered an obstacle with a height equal to the mean diameter in the raster cell derived from the polygon map during the rebound calculations. Secondly, we made the simulation program randomly choose the MOH on the basis of the three cover classes in the polygon using a uni-form distributed randomiser. Here, the probability that the simulated rock encountered an obstacle with a height equal to the mean diameter representative for the 70%, 20% and 10% cover class in the terrain was respectively 70%, 20%, and 10% during each rebound calculation. The latter method only has been applied at Site 2, because Site 1 is relatively uniform regarding the material size covering the slope sur-face.
2.6 Validating the model output
The primary output generated by RockyFor consists of the velocity in each cell after a given number of simulations (m s−1), the kinetic energy in each cell (kJ), the number of
times a simulated rock passed in each cell (−), the rebound heights of the rock in normal direction to the slope surface and in the vertical direction (m), the impact height on trees in each cell (m), the number of tree impacts in each cell (−) and the number of rocks that stopped in each cell (−). The model uses many probabilistic functions. Therefore, repeating the simulations at least a 1000 times, but preferably 10 000 times per start cell produces reliable results. To validate the out-put of 10 000 simulation runs on Site 1 and Site 2, we
com-pared them with the average maximum translation velocity of all the rocks (m s−1), the maximum translation velocity
(m s−1), the percentage of rocks stopped after 223.5 m, the
mean number of tree impacts per falling rock and the maxi-mal vertical rebound height of rebound (m) observed at the slopes of Site 1 (non-forested) and Site 2 (forested).
In addition, to evaluate the model performance at a more detailed scale than the slope as a whole, we compared the observed and simulated translation velocity (m s−1), the ver-tical rebound height (m) and the kinetic energy (kJ) at two “evaluation screens” at Site 1. Evaluation screen 1 is located after 185 m from the starting point at Site 1, measured over the slope and evaluation screen 2 is located after 235 m.
On the basis of all the observed and simulated values we calculated Errors (E) and the Root Mean Square Errors (RMSE) following, E = (C − O) ∗100/O (5) RMSE = v u u t 1 n n X i=1 (E2) , (6)
where n is the number of observations, C is the calculated value and O is the observed value.
3 Results
3.1 Simulated and observed rockfall events
The most important results of this study are the comparison between simulated and experimentally obtained results on the non-forested and forested slope, as these indicate whether the model produces reliable results. Therefore, these results will be presented first. While presenting these results, data obtained from the real-size rockfall experiments will be pre-sented as well. A more extensive presentation of the results of those experiments can be found in Dorren et al. (2005) and in Dorren and Berger (2006).
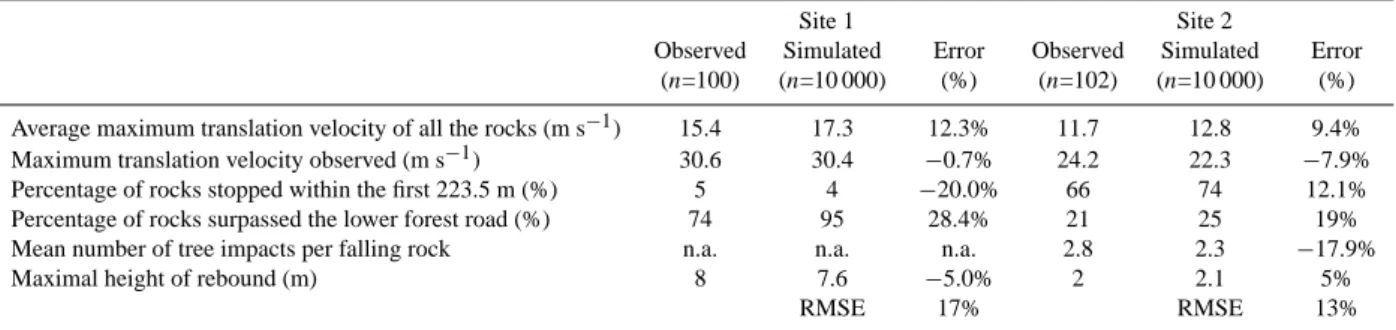
The comparison of the simulated data and the data ob-served at the slopes of Site 1 (non-forested) and Site 2 (forested), which are summarised in Table 2, show that the RockyFor model produces accurate results at the slope level RMSE Site 1 = 17%, RMSE Site 2 = 13%). The largest error is produced at Site 1 by predicting the percentage of rocks surpassing the lower forest road. In reality, we observed that 74% surpassed this road, while the model predicted that 95% would surpass it, which results in an overestimation of 28.4%.
Predicting the mean number of tree impacts that occur per falling rock resulted in the largest error at Site 2. In reality, 2.8 trees were on average impacted by each rock, while the model simulated on average 2.3 tree impacts per rock. This is an underestimation of 17.9%. Regarding the overall distri-bution of the number of tree impacts per rock as presented in Fig. 2, RockyFor reproduced the histogram quite well.
The number of rocks that surpassed the lower forest road on Site 2 indicates the residual hazard of the forest including
150 L. K. A. Dorren et al.: Rockfall-forest simulation
Table 2. Summary of the observed and simulated characteristics of rockfall at Site 1 (non-forested) and Site 2 (forested).
Site 1 Site 2
Observed Simulated Error Observed Simulated Error (n=100) (n=10 000) (%) (n=102) (n=10 000) (%) Average maximum translation velocity of all the rocks (m s−1) 15.4 17.3 12.3% 11.7 12.8 9.4% Maximum translation velocity observed (m s−1) 30.6 30.4 −0.7% 24.2 22.3 −7.9% Percentage of rocks stopped within the first 223.5 m (%) 5 4 −20.0% 66 74 12.1% Percentage of rocks surpassed the lower forest road (%) 74 95 28.4% 21 25 19% Mean number of tree impacts per falling rock n.a. n.a. n.a. 2.8 2.3 −17.9% Maximal height of rebound (m) 8 7.6 −5.0% 2 2.1 5%
RMSE 17% RMSE 13%
Figure 2. Histogram showing the number of impacts against trees per rock as observed during the real-size experiments (observed) and produced by RockyFor (simulated).
24 Fig. 2. Histogram showing the number of impacts against trees per
rock as observed during the real-size experiments (observed) and produced by RockyFor (simulated).
the forest road. The model was capable to simulate this resid-ual hazard with an error of 19%. We observed that 21% of the rocks surpassed the lower forest road at Site 2 and Rock-yFor predicted that 25% would surpass it. In addition, the model reproduced the spatial pattern of the observed rockfall trajectories, as presented in Fig. 3.
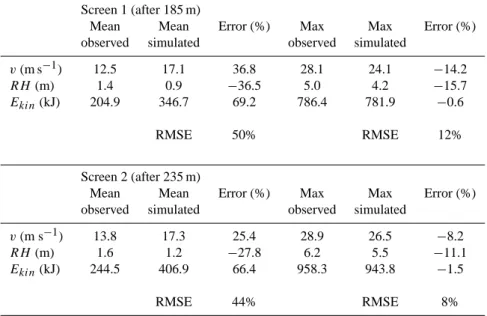
Looking more in detail at the velocities, kinetic energies, and rebound heights that have been observed and simulated at the two evaluation screens at Site 1, it shows that Rock-yFor overestimates the mean velocity, and logically also the kinetic energies, and it underestimates the rebound heights (Table 3). The RMSE is 50% at evaluation screen 1, which is 185 m from the starting point measured over the slope. At screen 2, which is 235 m from the starting point mea-sured over the slope, the RMSE is 44%. The maximum ob-served values, however, are well predicted at the two screens (RMSE of 12% at screen 1 and 8% at screen 2).
3.2 Simulated and observed rebounds on the slope surface
Our analyses showed that there is no relationship between the tangential (rt)and the normal (rn)coefficient of restitution on forested slopes (R2=0.06, P <0.22, n=27). The analyses of the filmed rebounds also prove that both parameters are useful, as on our test sites they seem to be independent from
Figure 3. Observed and simulated rockfall trajectories at the forested Site 2. Trees are indicated as grey round dots. The observed trajectories are represented by the black lines and simulated trajectories are generalised in the raster map displayed in the background. This raster map is a pass frequency map; the darker the cell the higher the simulated frequency of a rock passing through that cell.
25 Fig. 3. Observed and simulated rockfall trajectories at the forested
Site 2. Trees are indicated as grey round dots. The observed trajec-tories are represented by the black lines and simulated trajectrajec-tories are generalised in the raster map displayed in the background. This raster map is a pass frequency map; the darker the cell the higher the simulated frequency of a rock passing through that cell.
the velocity before the rebound of the falling rock. The key values of both coefficients as obtained by analysing the films of the real-size experiments are presented in Table 4.
The analyses also show that there is clear link between the tangential coefficient of restitution and the ratio of the MOH (in reality these consisted mainly of previously de-posited rocks and stones) at the location of the impact to the radius of the rock (Fig. 4). By using Eq. (3) we are able to explain 73% of the variance in the calculated rt values.
There is also a good relationship between the mean diam-eter of the surface covering the slope and the MOH as indi-cated by Fig. 5. By establishing the linear relationship shown in Fig. 5, we could explain 68% of the observed variance. Using this relationship to calculate the rt on the basis of our material diameter class polygon map in our model yielded the simulation results that are presented in the first part of the results section. Using a uniform distributed randomiser that randomly chose the MOH on the basis of the three cover classes in each polygon increased the RMSE of the simula-tion results at Site 2 with 8%, where mainly the simulated velocity decreased.
L. K. A. Dorren et al.: Rockfall-forest simulation 151
Table 3. The observed and simulated translation velocity (v in m s−1), vertical rebound height (RH in m) and kinetic energy (Ekinin kJ) at
screen 1 (after 185 m from the starting point at Site 1, measured over the slope) and at screen 2 (after 235 m from the starting point at Site 1, measured over the slope) as well as the accompanying errors.
Screen 1 (after 185 m)
Mean Mean Error (%) Max Max Error (%) observed simulated observed simulated
v(m s−1) 12.5 17.1 36.8 28.1 24.1 −14.2
RH (m) 1.4 0.9 −36.5 5.0 4.2 −15.7
Ekin(kJ) 204.9 346.7 69.2 786.4 781.9 −0.6
RMSE 50% RMSE 12%
Screen 2 (after 235 m)
Mean Mean Error (%) Max Max Error (%) observed simulated observed simulated
v(m s−1) 13.8 17.3 25.4 28.9 26.5 −8.2
RH (m) 1.6 1.2 −27.8 6.2 5.5 −11.1
Ekin(kJ) 244.5 406.9 66.4 958.3 943.8 −1.5
RMSE 44% RMSE 8%
Figure 4. The relationship between the tangential coefficient of restitution rt and MOH/R
based on analysed rebounds during the real-size rockfall experiments.
26 Fig. 4. The relationship between the tangential coefficient of
restitu-tion rtand MOH/R based on analysed rebounds during the real-size
rockfall experiments.
4 Discussion
The objective of our study was to improve the rockfall sim-ulation model RockyFor, thereby developing a clear method for quantifying and modelling slope surface characteristics based on quantitative field data. The results show that Rock-yFor is able to reproduce the observed rockfall events with errors in general between 15% and 20%. Reproduction of the characteristics of the events observed during our exper-iments indicates that the model is suitable for prediction as no retro-calculation or calibration on the basis of historical or recent observed events is required.
The results of the analyses at the two evaluation screens show that the model generally overestimates the observed
Figure 5. The relationship between the measured MOH in the field and the mean diameter of the slope covering material as derived from the diameter classes polygon map.
27 Fig. 5. The relationship between the measured MOH in the field
and the mean diameter of the slope covering material as derived from the diameter classes polygon map.
mean values, but it reproduces the worst-case events well with a systematic underestimation of approximately 9%, on average. The mean values at the two evaluation screens are very much determined by rocks that roll or bounce down the slope slowly with relatively low bounces. These rocks are generally less spherical, with one or more relative flat sides. Such rocks, except disc shaped ones, decelerate more than round rocks during impacts and they accelerate less than round rocks because they tend to slide over the slope. Disc shaped rocks, tend to roll and bounce over the flat side and developed high rotational velocities. These rocks pose large risks as the probability that they impact trees is low, due to the small diameter. RockyFor also does not account for breaking of falling rocks. The initial rock that is simulated
152 L. K. A. Dorren et al.: Rockfall-forest simulation
Table 4. The range of values of the tangential (rt) and normal (rn)
coefficient of restitution obtained from the real-size experiments on both sites.
rt rn
Site 1 (non-forested) 2 (forested) 1 2 Average 0.70 0.77 0.26 0.36 Stddev. 0.12 0.10 0.09 0.13
Min. 0.50 0.57 0.11 0.21
Max. 0.95 0.96 0.41 0.68
to fall from a certain source area remains the same during the simulation. This means also that the results produced by RockyFor approach more the worst-case scenarios with high velocities, high rebounds and longer runout zones.
RockyFor predicted that the forest at Site 2 could stop 74% of all the rocks, while in reality that forest has stopped 66%. An explanation could be the fact that RockyFor does not include the quality of individual trees in the forest stand, thereby overestimating the energy that can be dissipated by a forest stand. All trees are assumed to behave “ideally” and dissipate an amount of energy determined by the stem diam-eter and its species. In reality, the properties that ddiam-etermine the amount of energy that can be dissipated by a tree vary a lot. Examples of such properties are the quality of the living wood, the size and depth of the root systems, the soil-root plate, root interactions with surrounding trees, the size and shape of the tree crown and tree diseases such as heart rot (Stokes et al., 2005; Dorren and Berger, 2006).
In relation to this, however, it is interesting to notice that the average number of tree impacts per rock was higher in reality than simulated by RockyFor. This could indicate that the problem is rather that RockyFor assumes that all rocks with a translation velocity smaller than 0.1 m/s are stopped. In reality we observed that some rocks, which were initially stopped by trees, continued to fall down the slope after ap-proximately one second, in case they stopped in a non-stable position next to the tree. This effect could not be simulated by RockyFor, which could cause an underestimation of the number of tree impacts per simulated rock. Despite several analyses we have not been able to give a clear answer.
RockyFor predicted that only 4% more rocks surpassed the forest road that limits the foot of Site 2 (see Fig. 1) than observed in reality (simulated 25%, observed 21%, see Ta-ble 2). Looking at the number of rocks that were stopped by the forest in the simulation and reality, as given in Ta-ble 2, this means that in the simulation only 1% of the rocks stopped on the forest road but in reality 13%. This difference points out a weak point of calculating the tangential coef-ficient of restitution on the basis of the Maximum Obstacle Height (MOH). On undisturbed forest roads and compara-ble surfaces, the MOH is very low. After an impact, how-ever, the MOH changed enormously as the rock impact cre-ated a crater in the road. In other words, on soft surfaces,
such as forest roads, the rock creates a barrier for itself dur-ing the impact. Therefore, when mappdur-ing the MOH in the field, the MOH after the impact should be estimated, which makes the proposed method subjective. To avoid this in the future, we started working on a field method to estimate the MOH after an impact for different land cover types (talus slopes, talus slopes with forest soils, meadows, slopes cov-ered by deep soils, forest roads, asphalt roads, etc.) us-ing repeated impacts on the ground with a small granite block (∼0.15 m×∼0.15 m×∼0.15 m) that can be carried in the field. In our current research we try to establish a rela-tionship between the penetration depth of this block and the MOH for larger rocks.
Finally we would shortly like to discuss whether or not it would be wise to take into account the mitigating effect of existing forest cover in rockfall hazard assessment stud-ies. A counter argument that is often heard is that a forest is not perennial. Generally, the same accounts for technical protective structures such as rockfall nets. According to our opinion, a site where a natural hazard poses a risk should be monitored through time, also after a hazard assessment study has been carried out and protective systems haven been in-stalled. It reduces the probability of potential malfunction-ing of the protective system, it bemalfunction-ing a technical structure, a mixed technical – ecological measure, or a pure ecolog-ical measure, such as a protection forest. In other words, monitoring a hazardous site reduces the risk, but zero risk hardly exists. In case a forest with a protective function is destroyed completely by a gale or partly by avalanches or rockfall (mostly in distinct couloirs), its protective function is not completely lost. Moreover, silvicultural techniques ex-ist and are already applied in practice to maintain a large part of the level of protection before the damage occurred (see Dorren et al., 2005; Sch¨onenberger et al., 2005). Since protection forest maintenance is cheap compared to technical protective structures and well-trained foresters are capable of safeguarding the protective function of a forest for 25 years, there is no reason why the mitigating effect of a forest should not be taken into account when planning protective measures if the potential is present on site.
5 Conclusions
Based on the presented results we conclude that the RockyFor model allows predicting the hazard posed by rock-fall (velocity, kinetic energy, jump height and runout zone) accurately, both on forested as on non-forested slopes. It could thus contribute to better taking into account the mit-igating effect of existing forest cover when planning protec-tive measures. For further improvement of rockfall-forest simulation on different slopes types we conclude that more quantitative data is required on (1) the energy dissipative ca-pacity of shrubs and bushes (e.g. in coppice stands), (2) the effect of the slope material, (3) the rock shape as well as the rock size, and (4) the tangential and normal coefficient of restitution.
L. K. A. Dorren et al.: Rockfall-forest simulation 153
Acknowledgements. We gratefully thank the European
Commis-sion for the Marie Curie Fellowship (QLK5-CT-2002-51705) and for funding the ROCKFOR project (QLK5-CT-2000-01302). We also thank G. F. Wieczorek and J. Corominas for their valuable comments on the manuscript.
Edited by: T. Glade
Reviewed by: J. Corominas, G. F. Wieczorek, and another referee
References
Agliardi, F. and Crosta, G. B.: High resolution three-dimensional numerical modelling of rockfalls, Int. J. Rock Mech. Min. Sci., 40, 455–471, 2003.
Azzoni, A. and de Freitas, M. H.: Experimentally gained parame-ters decisive for rock fall analysis, Rock Mech. Rock Eng., 28, 111–124, 1995.
Berger, F.: Cartographie des fonctions de protection de la forˆet de montagne, International Congress Interpraevent 1996, Garmisch-Partenkirchen, Proceedings, 1, 171–180, 1996. Berger, F. and Lievois, J.: Determination of priority forest work
areas and creation of green areas in risk prevention plans – an example of researcher-specialist transfer, in: Int. Conf. Moun-tainous Natural Hazards, edited by: Gillet, F. and Zanolini, F., Cemagref, 12–14 April 1999, Grenoble, France, 412–416, 1999. Berger, F., Quetel, C., and Dorren, L. K. A.: Forest: a natural pro-tection mean against rockfalls, but with which efficiency? Inter-national Congress Interpraevent 2002 in the Pacific Rim, Mat-sumoto, Japan, Proceedings, 2, 815–826, 2002.
Brauner, M., Weinmeister, W., Agner, P., Vospernik, S., and Hoesle, B. : Forest management decision support for evaluating forest protection effects against rockfall, Forest Ecol. Man., 207, 75– 85, 2005.
Budetta, P. and Santo, A.: Morphostructural evolution and related kinematics of rockfalls in Campania (southern Italy): A case study, Eng. Geol., 36, 197–210, 1994.
Chau, K. T., Wong, R. H. C., and Lee, C. F.: Rockfall problems in Hong Kong and some new experimental results for coefficient of restitution, Int. J. Rock Mech. Min. Sci., 35, 662–663, 1998. Chau, K. T., Wong, R. H. C., and Wu, J. J.: Coefficient of restitution
and rotational motions of rockfall impacts, Int. J. Rock Mech. Min. Sci., 39, 69–77, 2002.
Dorren, L. K. A.: A review of rockfall mechanics and modelling approaches, Prog. Phys. Geog., 27, 69–87, 2003.
Dorren, L. K. A. and Berger, F.: Stem breakage of trees and energy dissipation during rockfall impacts, Tree Phys., 26, 63–71, 2006. Dorren, L. K. A. and Seijmonsbergen, A. C.: Comparison of three GIS-based models for predicting rockfall runout zones at a re-gional scale, Geomorphology, 56, 49–64, 2003.
Dorren, L. K. A., Maier, B., Putters, U. S., and Seijmonsbergen, A. C.: Combining field and modelling techniques to assess rockfall dynamics on a protection forest hillslope in the European Alps, Geomorphology, 57, 151–167, 2004.
Dorren, L. K. A., Berger, F., le Hir, C., Mermin, E., and Tardif, P.: Mechanisms, effects and management implications of rockfall in forests, Forest Ecol. Man., 215, 183–195, 2005.
Erismann, T. H. and Abele, G.: Dynamics of rockslides and rock-falls, Springer-Verlag, Berlin, 316 pp., 2001.
European Observatory of Mountain Forests: White Book 2000 on mountain forests in Europe, European Federation of Local Forest Communities, Saint Jean d’Arvey, 60 pp., 2000.
Gsteiger, P.: Steinschlagschutzwald. Ein Beitrag zur Abgrenzung, Beurteilung und Bewirtschaftung, Schweiz. Zeit. Forstw., 144, 115–132, 1993.
Guzzetti, F., Crosta, G., Detti, R., and Agliardi, F.: STONE: a com-puter program for the three-dimensional simulation of rock-falls, Comp. & Geosc., 28, 1079–1093, 2002.
Jahn, J.: Entwaldung und Steinschlag, International Congress Inter-praevent, Graz. Proceedings, 1, 185–198, 1988.
Jones, C. L., Higgins, J. D., and Andrew, R. D.: Colorado Rockfall Simulation Program Version 4.0, Colorado Department of Trans-portation, Denver, CO, 127 pp., 2000.
Kirkby, M. J. and Statham, I.: Surface stone movement and scree formation, J. Geology, 83, 349–362, 1975.
Le Hir, C., Berger, F., Dorren, L. K. A., and Qu´etel, C.: Forest: a natural means of protection against rockfall, but how to reach sustainable mitigation? Advantages and limitations of combin-ing rockfall models takcombin-ing the forest into account, International Congress Interpraevent 2004, Riva del Garda, Italy, Proceedings, 2, 59–69, 2004.
Liniger, M.: Computersimulation von Stein- und Blockschl¨agen, Felsbau, 18, 64–68, 2000.
Pfeiffer, T. J. and Bowen, T. D.: Computer simulation of rockfalls, Bull. Ass. Eng. Geol., XXVI, 135–146, 1989.
Sch¨onenberger, W., Noack, A., and Thee, P: Effect of timber re-moval from windthrow slopes on the risk of snow avalanches and rockfall, Forest Ecol. Man., 213, 197–208, 2005.
Schweigl, J., Ferretti, C., and Nossing, L.: Geotechnical character-ization and rockfall simulation of a slope: a practical case study from South Tyrol (Italy), Eng. Geol., 67, 281–296, 2003. Spang, R. M. and Krauter, E.: Rockfall simulation – a state of the
art tool for risk assessment and dimensioning of rockfall barri-ers, International Conference Landslides – Causes, Impacts and Countermeasures, Davos, United Engineering Foundation, 607– 613, 2001.
Stokes, A., Salin, F., Kokutse, A. D., Berthier, S., Jeannin, H., Mochan, S., Dorren, L. K. A., Kokutse, N., Ghani, M. A., and Fourcaud, T.: Mechanical resistance of different tree species to rockfall in the French Alps, Plant Soil, 278, 107–117, 2005. Swiss Federal Statistical Office: Statistisches Jahrbuch der Schweiz
2002, Swiss Federal Statistical Office, Verlag Neue Z¨urcher Zeitung, 890 pp., 2002.
Weir, P.: Snow Avalanche Management in Forested Terrain, Land Management Handbook 55 British Columbia Ministry of Forests Research Branch, Victoria B.C., Canada, 190 p., 2002.
Zinggeler, A., Krummenacher, B., and Kienholz, H.: Stein-schlagsimulation in Gebirgsw¨aldern, Berichte und Forschungen der Geographisches Institut der Universit¨at Freiburg, 3, 61–70, 1990.