HAL Id: hal-00301810
https://hal.archives-ouvertes.fr/hal-00301810
Submitted on 13 Jul 2006HAL is a multi-disciplinary open access
archive for the deposit and dissemination of sci-entific research documents, whether they are pub-lished or not. The documents may come from teaching and research institutions in France or abroad, or from public or private research centers.
L’archive ouverte pluridisciplinaire HAL, est destinée au dépôt et à la diffusion de documents scientifiques de niveau recherche, publiés ou non, émanant des établissements d’enseignement et de recherche français ou étrangers, des laboratoires publics ou privés.
Detecting charging state of ultra-fine particles:
instrumental development and ambient measurements
L. Laakso, S. Gagné, T. Petäjä, A. Hirsikko, P. P. Aalto, M. Kulmala, V.-M.
Kerminen
To cite this version:
L. Laakso, S. Gagné, T. Petäjä, A. Hirsikko, P. P. Aalto, et al.. Detecting charging state of ultra-fine particles: instrumental development and ambient measurements. Atmospheric Chemistry and Physics Discussions, European Geosciences Union, 2006, 6 (4), pp.6401-6429. �hal-00301810�
ACPD
6, 6401–6429, 2006 Ion-DMPS L. Laakso et al. Title Page Abstract Introduction Conclusions References Tables Figures J I J I Back Close Full Screen / EscPrinter-friendly Version Interactive Discussion
EGU
Atmos. Chem. Phys. Discuss., 6, 6401–6429, 2006 www.atmos-chem-phys-discuss.net/6/6401/2006/ © Author(s) 2006. This work is licensed
under a Creative Commons License.
Atmospheric Chemistry and Physics Discussions
Detecting charging state of ultra-fine
particles: instrumental development and
ambient measurements
L. Laakso1, S. Gagn ´e1, T. Pet ¨aj ¨a1, A. Hirsikko1, P. P. Aalto1, M. Kulmala1, and V.-M. Kerminen2
1
Department of Physical Sciences, P.O. Box 64, 00014, University of Helsinki, Finland
2
Finnish Meteorological Institute, Air Quality Research, P.O. BOX 503, 00101 Helsinki, Finland Received: 25 April 2006 – Accepted: 4 May 2006 – Published: 13 July 2006
ACPD
6, 6401–6429, 2006 Ion-DMPS L. Laakso et al. Title Page Abstract Introduction Conclusions References Tables Figures J I J I Back Close Full Screen / EscPrinter-friendly Version Interactive Discussion
EGU
Abstract
The importance of ion-induced nucleation in the lower atmosphere has been discussed for a long time. In this article we describe a new instrumental setup – Ion-DMPS – which can be used to detect contribution of ion-induced nucleation on atmospheric new particle formation events. We performed several laboratory tests to test the operation of
5
the device and then we measured atmospheric new particle formation events with the instrument in a boreal forest. We found that some of the events were clearly dominated by neutral nucleation but in some cases also ion-induced nucleation contributed to the new particle formation. We also found that negative and positive ions behaved in a different manner, days with negative overcharging were more frequent than days with
10
positive overcharging. A simple order of magnitude estimate gave the contribution of ion-induced nucleation on total nucleation approximately 10%. During the neutral-dominated nucleation days ion contribution was close to zero.
1 Introduction
New particle formation is taking frequently place in the global atmosphere worldwide
15
(Kulmala et al., 2004). Despite many observations, however, the exact nucleation mechanisms still remain an open question. Several nucleation pathways including ion-induced, ternary, binary and kinetic nucleation had been proposed, but the relative importance of these processes in different environments is still unknown. Ternary and binary nucleation refer to the number of vapors participating in the nucleation process,
20
whereas ion-induced nucleation refers to the presence of charges in nucleation (Weber
et al.,1996;Laakso et al.,2002). Thus, both binary and ternary nucleation can be ei-ther ion-induced or neutral. A recently-proposed particle nucleation mechanism is the activation of stable clusters (Kulmala et al.,2000,2006), which can be either neutral or ion clusters (Kulmala et al.,2000).
25
ACPD
6, 6401–6429, 2006 Ion-DMPS L. Laakso et al. Title Page Abstract Introduction Conclusions References Tables Figures J I J I Back Close Full Screen / EscPrinter-friendly Version Interactive Discussion
EGU
and electric fields (for an overview, see e.g.Flagan,1998). Such devices include ion mass spectrometers, ion-spectrometers and Differential Mobility Particle Sizer (DMPS) (Aalto et al.,2001;Weber et al.,1995;Winklmayr et al.,1991). Ion mass spectrometers have been used successfully in the studies of new particle formation in the upper atmo-sphere (Eichkorn et al., 2002). Recent developments in atmospheric measurements
5
are the ion spectrometers which detect ion or charged aerosol distributions from clus-ter ion sizes up to the Aitken mode (Laakso et al.,2004). Typically, ion spectrometers measure both polarities.
The most common aerosol sampling instrument utilizing an electric field is the Dif-ferential Mobility Analyzer (DMA) in a DMPS-system. In the DMA aerosol particles of
10
certain mobility are chosen from an air flow. In the DMPS system, only the charged fraction of particles is measured. The equilibrium charge on particles is provided by a radioactive bipolar or by a unipolar corona charger. The total particle number concen-tration is obtained after a mathematical inversion of the charged fraction. Since only few percent of particles in small sizes are charged, this inversion procedure is very
15
sensitive to understanding the charging probability of particles.
The charged fraction can be calculated from different theories, most widely-used are the semi-empirical theories by Hoppel and Frick (1986) andWiedensohler (1988) as well as the flux-matching theory byFuchs and Sutugin(1970).
Unfortunately, despite numerous laboratory studies, the particle charging probability
20
in the atmosphere is not well-known, especially for the smallest particle sizes (Reischl
et al.,1996). Thus, if we are interested in freshly-formed nanoparticles, more infor-mation on atmospheric charging probabilities is needed (Hussin et al.,1983; Reischl
et al.,1996).
In addition to being necessary for interpretating instrumental results, electric charges
25
may also carry information about the nucleation processes. In case of ion-induced nucleation, new particles are formed electrically charged, whereas in case of neutral nucleation particles do not initially carry any charges. Thus, depending on nucleation mechanism, the charging state of particles may deviate from that in the charge
equi-ACPD
6, 6401–6429, 2006 Ion-DMPS L. Laakso et al. Title Page Abstract Introduction Conclusions References Tables Figures J I J I Back Close Full Screen / EscPrinter-friendly Version Interactive Discussion
EGU
librium. When nucleated particles grow, they will finally reach the electrical equilibrium (Vana et al.,2005). In this study, we use the term charging probability when referring to the fraction of charged particles in the equilibrium state. The term charged frac-tion tells how large is the percentage of charged particles at a certain size. The term charging state refers to the charged fraction with respect to the charged fraction in the
5
equilibrium state (charging probability). If there are fewer charged particles than there would be in the equilibrium state, the charging state of the particles is undercharged. If the number of charged particles exceeds the equilibrium value, the particles are over-charged.
In this work, we present a new instrumental setup which can be used to define
10
charging state of aerosol particles. A preliminary version of this device was utilized already byM ¨akel ¨a et al.(2003) but the results remained unpublished. After describing the instrument and its measurement principles, we present a laboratory verification of the instrument. Then we apply the instrument to ambient new particle formation events. Finally, the results and their consequences are discussed.
15
2 Instrumentation
2.1 Ion-DMPS
The ion-Differential Mobility Particle Sizer (ion-DMPS) is based on a well-defined aerosol sizing instrumentation concentrating on the ultra-fine particle size range (<15 nm in diameter (Aalto et al., 2001). A schematic picture of the instrument is
20
presented in Fig.1(boxed with dashed line). First, aerosol particles are led to a bipolar charger (Ni-63) that can be switched on and off. Next, they are led trough a con-ventional Differential Mobility Analyzer (DMA, length 0.109 m, (Winklmayr et al.,1991) with a switchable two-polarity high voltage power supply. By changing the polarity in the DMA, we were able to measure either positive or negative particles. The DMA was
25
par-ACPD
6, 6401–6429, 2006 Ion-DMPS L. Laakso et al. Title Page Abstract Introduction Conclusions References Tables Figures J I J I Back Close Full Screen / EscPrinter-friendly Version Interactive Discussion
EGU
ticles were detected with a TSI 3025 (Stolzenburg and McMurry,1991) ultrafine particle counter (CPC). Given the maximum voltage, flow rates, and counting efficiency of the CPC, this corresponded to a size range approximately from 3 to 15 nm in electrical mobility equivalent diameter.
Small adjustments to this kind of conventional instrument enabled us to measure
5
aerosol particle size distribution in four different operating modes: 1) the charger was on and the DMA had a negative polarity; 2) the charger was off and the DMA had a negative polarity; 3) the charger was on and the DMA had a positive polarity; 4) the charger was off and the DMA had a positive polarity. For each operation mode, a size scan with pre-defined intervals was carried out.
10
2.1.1 Laboratory verification of Ion-DMPS
The ion-DMPS was tested in a laboratory prior to deployment under field conditions. Several tests were performed with monodisperse ammonium sulphate and silver par-ticles. The laboratory setup is depicted in Fig. 1. Polydisperse ultrafine silver parti-cles were generated with an oven (Carbolite Furnaces MTF 12/388). The equilibrium
15
charge distribution was obtained with a bipolar NI-63 charger and from this generated particle population a monodisperse selection was extracted with a Vienna type Di ffer-ential Mobility Analyser (DMA, length 0.109 m. The sheath flow was set to 20 l min−1 and aerosol flow to 1 l min−1. The aerosol sample was then separated between the ion-DMPS and TSI model 3025 Ultrafine Condensation Particle (UCPC,Stolzenburg and
20
McMurry,1991), the latter of which was used as a reference instrument for absolute particle concentration. In addition, with the aid of the reference instrument, it was also possible to normalize small fluctuations in the aerosol generation system.
2.1.2 Transport efficiency
The purpose of the ion-DMPS is to determine the charging state of ultra-fine particles.
25
ACPD
6, 6401–6429, 2006 Ion-DMPS L. Laakso et al. Title Page Abstract Introduction Conclusions References Tables Figures J I J I Back Close Full Screen / EscPrinter-friendly Version Interactive Discussion
EGU
initial ultra-fine particle concentration has to be large enough to penetrate through the system and give a reliable concentration reading during the counting. The transport efficiency through the ion-DMPS was determined experimentally with monodisperse silver particles ranging from 3 to 40 nm in electrical mobility equivalent diameter. The transport efficiency was a steep exponential curve. Roughly 75% of 20 nm particles
5
penetrated the setup, whereas only 25% of 5 nm particles survived. In the normal operation range of 3–15 nm, the transport efficiency of the setup is 15 to 65%. The cut-size, i.e. the diameter at which the transport efficiency is 50%, was 7.2 nm. This corresponds to a laminar flow diffusion loss (Baron and Willeke,2001) of 16.4 m of a circular tube. The losses are, however, not as crucial to the performance of the
ion-10
DMPS as they are in case of a normal size distribution instrument. In the ion-DMPS, the desired information is the ratio between the concentrations, which are exposed to the same losses despite their polarities or the number of charges.
2.1.3 Charge balance and neutralization efficiency
A charge balance of laboratory-generated particles was determined with the ion-DMPS
15
for ammonium sulphate and silver particles (Fig.2). All the ratios were normalized with respect to the concentration of negative, non-neutralized particles. As neutralized poly-disperse particles were sampled with the ion-DMPS, several features were detected. Firstly, switching on the charger increased the concentration of sub-10 nm particles by approximately 10% in comparison with corresponding non-neutralized negative
parti-20
cle concentration. This effect was more pronounced in the ammonium sulphate experi-ments. Absolute concentrations were higher in the case of negative polarity. This is due to higher mobilities of negative cluster ions, which attach to the sampled particles in the ion-DMPS charger. This has been seen in earlier experiments (Wiedensohler,1988) as well as using theoretical calculations (Fuchs and Sutugin,1970;Hoppel and Frick,
25
1986). As the particle size decreases, the absolute charging efficiency decreases for both polarities. On the other hand, the ratio between the negative and positive charging efficiencies did not remain the same in our experiments. To clarify this, more laboratory
ACPD
6, 6401–6429, 2006 Ion-DMPS L. Laakso et al. Title Page Abstract Introduction Conclusions References Tables Figures J I J I Back Close Full Screen / EscPrinter-friendly Version Interactive Discussion
EGU
experiments are needed to experimentally determine the particle charging efficiency in the sub-10 nm size range.
A crucial part of the ion-DMPS is the radioactive charger in front of the instrument. Since our aim was to determine the charging state, i.e. the excess or deficit of elec-trical charges in ultra-fine particles, the radioactive source in the system has to be
5
strong enough to efficiently neutralize the charging state of the sampled particles to equilibrium conditions. This is needed in the calculation of over / undercharging state as a reference concentration. To test this, higher than atmospheric concentrations of negatively charged silver particles utilizing the laboratory setup were generated. The ion-DMPS distributions measured with the charger and positive polarity (i.e. neutralized
10
negative particles) agreed well with a parameterization byWiedensohler(1988). This indicates that the charger was in working order.
2.2 Balanced Scanning Mobility Sizer (BSMA)
In addition to ion-DMPS, we carried out ion measurements using a Balanced Scan-ning Mobility Sizer (BSMA) (Tammet, 2004, 2006). The Balanced Scanning Mobility
15
Analyzer, manufactured by Airel Ltd., Estonia, consists of two plain aspiration-type Dif-ferential Mobility Analyzers, one for positive and the other for negative ions. The two aspiration condensers are connected as a balanced bridge circuit that allows continu-ous variation of the driving voltage and scanning of the mobility distribution of charged clusters and nanoparticles. A large airflow rate 44 l per second helps to suppress the
20
loss of air ions in the inlet of the instrument. The inlet can be closed or opened for ions using a controlled electrostatic filter and the background signal is eliminated by making every second scan with a closed inlet. A mobility distribution is calculated according to the results of 9 scans performed over 3 min. The electric mobility range of 0.032– 3.2 cm2V−1s−1is logarithmically uniformly divided into 16 fractions. The corresponding
25
size distribution is presented by 10 fractions, logarithmically equally distributed in a diameter range of 0.4–7.5 nm.
ACPD
6, 6401–6429, 2006 Ion-DMPS L. Laakso et al. Title Page Abstract Introduction Conclusions References Tables Figures J I J I Back Close Full Screen / EscPrinter-friendly Version Interactive Discussion
EGU
3 Data treatment and analysis
3.1 Interpretation of ion-DMPS-results
Figure4represents schematically four different cases of nucleation and how they are observed by an ion-DMPS.
In case of neutral nucleation all particles are formed electrically neutral from
nucle-5
ating vapors (Fig. 4, first row), whereas in ion-induced particle formation nucleation takes place on pre-existing cluster ions so that all freshly-formed particles carry one positive or negative elementary charge (Fig.4, second row). When the particles grow bigger, they tend to reach charge equilibrium. In addition to pure neutral or ion-induced nucleation, different combinations of these two mechanisms are also possible. The
10
third row in Fig.4 represents the case where ion-induced nucleation dominates over neutral nucleation, whereas in the fourth row of Fig. 4 neutral nucleation dominates over ion-induced nucleation.
In addition to the cases presented in Fig. 4, it is also possible that positive and negative ions behave in a different way, i.e. ion-induced nucleation can have a charge
15
preference (Kusaka et al.,1995;Lovejoy et al.,2004). For that reason we measured both the polarities. Common to all different nucleation combinations, the only way to receive an overcharging is that at least some fraction of the new particles have originated from ion-induced nucleation.
An example of inverted Ion-DMPS data together with conventional DMPS-data is
20
shown in Fig.5. The concentration of negative natural particles was higher during the first hour of the event than the corresponding concentrations after the ambient particles were neutralized with the radioactive source (Fig. 5c and d, respectively). In other words, fresh atmospheric particles during this day carried excess negative charges compared with the equilibrium state. This is an indication of the participation of ions
25
in the first steps of the particle formation process. Also positive particles were slightly overcharged.
ACPD
6, 6401–6429, 2006 Ion-DMPS L. Laakso et al. Title Page Abstract Introduction Conclusions References Tables Figures J I J I Back Close Full Screen / EscPrinter-friendly Version Interactive Discussion
EGU
the ratio between the natural to neutralized particle concentrations (right column in Fig. 4). If the ratio is >1, the particles are overcharged compared to the equilibrium state. On the other hand, if the ratio is <1, the particles are undercharged. The benefit in using this ratio and one single inlet lies in the fact that it allows us to avoid systematic errors due to losses within the inlet structure.
5
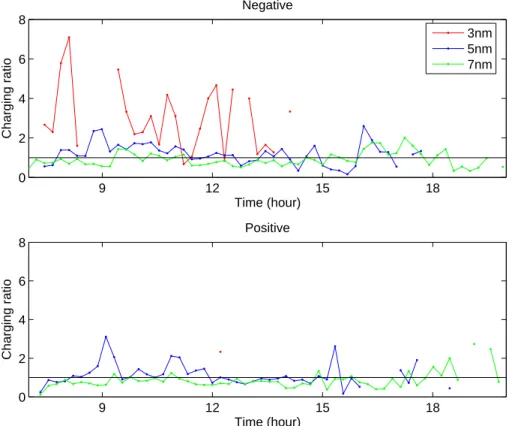
By dividing the natural ion concentration (only values over 0.1 cm−3are used) by the neutralized ion concentration for each diameter and time, we obtain the charging state as a function of time and particle size. This state is averaged over the nucleation period for each diameter. Two example cases are shown in Figs.6 and7. In Fig. 6(21 May 2005) one can observe an overcharged nucleation event for both positive and negative
10
ions, whereas in Fig.7(2 May 2005) particles of both polarities are undercharged. An example of the time behavior of the charging state is shown in Fig.8. As shown in Fig.8the charging states of 5 and 7 m particles are pretty constant during the day. On the other hand the charging state of 3 nm particles vary a lot from 7 to 1. It is also decreasing during the day indicating that ion clusters will first activate or ion induced
15
nucleation are more important before noon than later.
4 Results from atmospheric measurements
We measured with our ion-DMPS at Hyyti ¨al ¨a Forestry field station (Vesala et al.,1998;
Kulmala et al., 2001) during spring 2005 as a part of BACCI-QUEST intensive field campaign. The device was located in the main cottage of the station; the inlet was
20
at 2 m height. We checked the ion-DMPS several times during the measurements by producing ammoniumsulphate aerosol which was first neutralized and then led to ion-DMPS. Then we sampled aerosol with charger on and off and compared the measured concentrations between these two states.
ACPD
6, 6401–6429, 2006 Ion-DMPS L. Laakso et al. Title Page Abstract Introduction Conclusions References Tables Figures J I J I Back Close Full Screen / EscPrinter-friendly Version Interactive Discussion
EGU
4.1 General features of nucleation mode charging state
The analysis was made for those days during which we were able to use data from ion-DMPS, BSMA and DMPS.
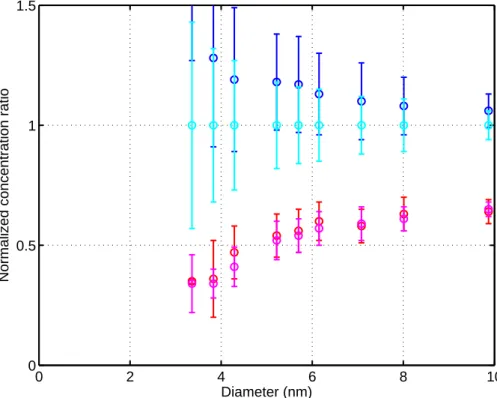
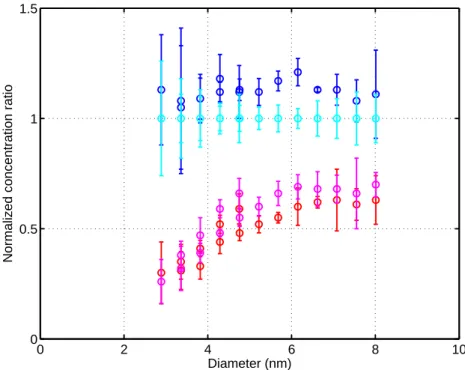
Figure9shows the charging state of different-size particles during all the event days observed, 34 days in total. One can see that negative ions tended to be overcharged
5
for smaller diameters and close to equilibrium for bigger particles. The same tendency was observed for positive ions. However, for one day (2 May 2005, see also Fig. 7) the positive and the negative ions were undercharged at lower particle sizes reaching equilibrium at larger sizes. Compared with event days, the particle charging state seemed to behave quite differently during the five non-event days observed (Fig. 9).
10
One must remember, however, that the charging state of sub-5 nm particles could not be determined during the non-event days due to absence of these particles from the measured size spectra.
Kerminen and Kulmala(2002) described a method for calculating the formation rate of 1-nm particles from the formation rate of 3 nm or larger particles by using observed
15
particle growth rates and condensation sinks. If we repeat this calculation for charged particles, and make the following assumptions: 1) the ion-aerosol attachment coe ffi-cient between cluster ions and sub-10 nm particles is not size dependent, 2) all parti-cles grow in size at a constant rate, 3) the cluster ion concentration does not change during the event and 4) self-coagulation of sub-10 nm particles is negligible, the
charg-20
ing state of different-size particles should follow the following equation:
C(dp)= 1 + β × exp[−λ(dp/d0− 3)] (1)
Here, d0is a non-dimensionalizing coefficient (1 nm), the parameter β gives the magni-tude of the potential over/under charging and the parameter λ tells how rapidly particles reach the charge equilibrium when growing in size. Equation (1) can be used for two
25
different purposes: to characterize the behavior and magnitude of the charging state on different days and to estimating the maximum contribution of ion-induced nucleation to new particle formation.
ACPD
6, 6401–6429, 2006 Ion-DMPS L. Laakso et al. Title Page Abstract Introduction Conclusions References Tables Figures J I J I Back Close Full Screen / EscPrinter-friendly Version Interactive Discussion
EGU
Equation1was fitted to the measurement data by minimizing the distance between the experimental points (median particle number concentrations in different size ranges over the nucleation event) and the exponential function given by Eq. (1). Days with median particle number concentration remaining below 0.1 cm−3in several size ranges were left out of the analysis. The fittings for all the 34 days are presented in Table1.
5
When the parameter β>0 we have an overcharged state, whereas β<0 is indicative of an undercharged state. All λ parameters were positive, showing that the particle charging state tended to approach equilibrium when they grow in size. As visible in Table1, there were many days during which the particle concentrations were too low to make a reliable fitting. This was the case especially for positive particles. It is also
10
important to emphasize on the high sensibility of the fit especially when the number of points reaching the minimum concentration for smaller diameters is low. In such a case, the median for 3 nm can vary enough to change the β and λ parameters, but generally not the charging state.
4.2 Contribution of ion-induced nucleation to the total nucleation rate
15
If the four assumptions made in the previous subsection hold, i.e. the processes grow-ing particles and carrygrow-ing towards the charge equilibrium are similar between the size-ranges 1–3 nm and 3–15 nm, we may extrapolate the fitting given by Eq. (1) down to 1 nm. This gives us the particle charging state at 1 nm, from which we can then esti-mate the maximum contribution of ion-induced nucleation.
20
Table 1 shows that the calculated charging state of 1 nm particles varies a lot be-tween the events, the median over charging being equal to 10 for negative charges and equal to 2.5 for positive charges. Since the charging probability of 1-nm particles is about 1%, we can estimate that the typical contribution of ion-induced nucleation was approximately 10% of the total nucleation rate during the observation period. However,
25
this value might vary depending on the season; here we have used data from late spring only.
ACPD
6, 6401–6429, 2006 Ion-DMPS L. Laakso et al. Title Page Abstract Introduction Conclusions References Tables Figures J I J I Back Close Full Screen / EscPrinter-friendly Version Interactive Discussion
EGU
than would be expected even if ion-induced nucleation contributed 100% of the total nucleation rate. This suggests that during these days, either our measurement uncer-tainties were too large to make a reliable fit into the measurement data, or the assump-tions made in deriving Eq. (1) were not valid for extrapolation of the fitting curve into the size range 1–3 nm. In the following we discuss briefly the latter possibility and its
5
consequences.
One of the main processes affecting the change of a particle population toward the charge equilibrium is ion-aerosol attachment. In the theory byHoppel and Frick(1986) the attachment coefficients of opposite charges are almost constant over the size range 1–5 nm, whereas in the theory byFuchs and Sutugin (1970) however, the attachment
10
coefficient increases linearly with increasing particle size. If the theory byFuchs and
Sutugin (1970) were correct, i.e. the ion attachment would be less effective at smaller particle sizes compared with larger particle sizes, our approach would overestimate the contribution of ion-induced nucleation to the total nucleation rate.
The growth rates of 1–3 nm particles might be larger or smaller than those of >3 nm
15
particles. The former might result from the possible effect of enhanced condensa-tion growth of charged clusters (Yu and Turco,2000), leading to overestimation of the contribution of ion-induced nucleation using our approach. Observations in Hyyti ¨al ¨a indicate, however, that the particle growth rate increases rather than decreases with increasing particle size, with typical particle growth rates being higher by a factor 2–3
20
at the 5 nm size compared with the 2 nm size (Hirsikko et al.,2005). If this is true, the real contribution of ion-induced nucleation could be approximately twice that obtained from our calculation.
Our assumption of constant cluster ion concentration does not significantly affect the results. Typically, variation during the event is less that 10%, and normally the
concen-25
tration is decreasing rather than increasing. If the cluster ion concentration decreases, once again our method overestimates the contribution of ion-induced nucleation.
Self-coagulation of charged and neutral sub-5 nm particles starts to become impor-tant when the concentration of these particles exceeds about 100 000 particles per cc
ACPD
6, 6401–6429, 2006 Ion-DMPS L. Laakso et al. Title Page Abstract Introduction Conclusions References Tables Figures J I J I Back Close Full Screen / EscPrinter-friendly Version Interactive Discussion
EGU
(Kerminen and Kulmala,2002). During our measurements the particle concentrations remained well below this limit, so the effect of self-coagulation on our results can be considered negligible.
In summary, the above uncertainty analysis indicates that we have overestimated rather than underestimated the contribution of ion-induced nucleation. If we take a
5
direct estimation that using the fact that maximum contribution is 100%, we can then device all ion induced fraction given in Table by a factor of 3. In that case the median value is around 3% for negative ions and around 1% for positive ion, and during most of the days. However, during 7 days the contribution is more than 10% and in one day it is 100%. The overall result is that ion induced nucleation (or activation of ion clusters)
10
is not that significant way to form new aerosol particles than neutral nucleation. This is consistent with the recent observations byEisele et al.(2006).
4.3 Comparison with BSMA measurements
We also compared our results from the Ion-DMPS with observations from the BSMA. This was done by calculating the average concentration over the nucleation period for
15
each size and then fitting a line to the data points (see Fig.10and the first column in Fig.4). We have then three different possibilities: 1) concentration of ions decreases (negative slope) 2) concentration of ions is constant (zero slope) 3) concentration of ions increases as a function of size (positive slope). We can now analyze these cases more in detail
20
– Case 1: We can obtain this situation with two different ways. If we have
ion-induced nucleation, we have high concentration of ions at small sizes. When the particles grow bigger, charged particles get neutralized and their concentra-tion decreases. In addiconcentra-tion, concentraconcentra-tion of charged particles decreases due to coagulation scavenging. However, another possibility for decreasing charged
25
particle concentration is neutral nucleation. If we have high neutral nucleation rate, part of the particles are charged. Due to coagulation loss, number of all
ACPD
6, 6401–6429, 2006 Ion-DMPS L. Laakso et al. Title Page Abstract Introduction Conclusions References Tables Figures J I J I Back Close Full Screen / EscPrinter-friendly Version Interactive Discussion
EGU
particles rapidly decreases, and despite increasing charging probability with in-creasing size, overall effect can be decreasing of charged particles as a function of size. Thus, in this case we can not say anything about nucleation mechanism.
– Case 2: Same arguments as in Case 1 apply and we can not say anything about
the nucleation mechanism.
5
– Case 3: If the concentration of charged particles increases with increasing size,
neutral nucleation have to dominate.
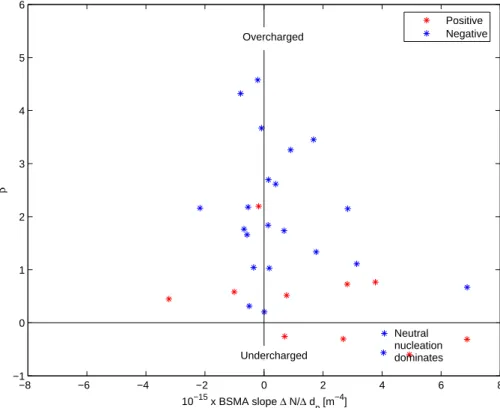
Figure 11 shows the slope of BSMA fittings vs. β. The results indicate that the days with high positive slope values particles are clearly less charged and thus neutral nucleation dominates.
10
5 Conclusions
In this study, we introduced a new DMPS setup which gives information on nucleation processes. We also showed experimental data from 34 new particle formation days from Hyyti ¨al ¨a. Some of the days were clearly overcharged which indicates contribution of ion-induced nucleation on new particle formation whereas some days were
under-15
charged and thus neutral nucleation dominates. The behavior of negative ions differed from that of positive ones; there were usually more negative overcharging compared to positive overcharging. Our results clearly indicate that ion-induced nucleation take place in the atmosphere. The results also indicate that ion-induced nucleation has clear sign preference in favor of negative ions. Order of magnitude estimate gives a
20
typical ion-induced nucleation contribution to the total nucleation rate during the period studied approximately 4%. Minimum contribution was found to be close to 0% and maximum close to 100%
In the future, we will utilize this experimental setup for calculating quantitatively the contribution of ion-induced nucleation on boreal new particle formation episodes for
25
ACPD
6, 6401–6429, 2006 Ion-DMPS L. Laakso et al. Title Page Abstract Introduction Conclusions References Tables Figures J I J I Back Close Full Screen / EscPrinter-friendly Version Interactive Discussion
EGU
References
Aalto, P., H ¨ameri, K., Becker, E., Weber, R., Salm, J., M ¨akel ¨a, J. M., Hoell, C., O’Dowd, C. D., Karlsson, H., Hansson, H.-C., V ¨akev ¨a, M., Koponen, I. K., Buzorius, G., and Kulmala, M.: Physical characterization of aerosol particles during nucleation events, Tellus, 53B, 344–358, 2001. 6403,6404
5
Baron, P. and Willeke, K.: Aerosol Measurement: Principles, Techniques, and Applications, 2nd edition, John Wiley and Sons, 2001. 6406
Eichkorn, S., Wilhelm, S., Aufmhoff, H., Wohlfrom, K., and Arnold, F.: Cosmic ray-induced aerosol formation: First evidence from aircraft-based ion mass spectrometer measurements, Geophys. Res. Lett., 29, 14, 2002. 6403
10
Eisele, F. L., Lovejoy, E. R., Kosciuch, E., Moore, K., Mauldin III, R., Smith, J.-N., McMurry, P., and Iida, K.: Negative atmospheric ions and their potential role in ion-induced nucleation, J.
Geophys. Res., 111, D04305, doi:10.1029/2005JD00, 2006. 6413
Flagan, R.: History of Electrical Aerosol Measurements, Aerosol Sci. Technol., 28, 301–380,
1998. 6403
15
Fuchs, N. A. and Sutugin, A. G.: Highly dispersed aerosols., Ann Arbour Science Publishers, Ann Arbour, London, 1970. 6403,6406,6412
Hirsikko, A., Mordas, G., Aalto, P., Mirme, A., H ˜orrak, U., and Kulmala, M.: Calibration of the Air Ion Spectrometer, in Research Unit on Physics, Chemistry and Biology of Atmospheric Composition and Climate Change: III Progress Report and Proceedings of Seminar in Pallas
20
29.3.–1.4.2005, edited by: Kulmala, M. and Ruuskanen, T., no. 73 in Report Series in Aerosol
Science, 87–90, 2005. 6412
Hoppel, W. and Frick, G.: Ion-aerosol attachment coefficients and steady-state charge distribu-tion on aerosols in a bipolar environment, Aerosol Sci. Technol., 5, 1–21, 1986. 6403,6406,
6412
25
Hussin, A., Scheibel, H., Becker, K., and Porstendorfer, J.: Bipolar diffusion charging of aerosol particles – I: Experimental results within the diameter range 4–30 nm, J. Aerosol Sci., 14,
671–677, 1983. 6403
Jokinen, V. and M ¨akel ¨a, J. M.: Closed loop arrangement with critical orifice for DMA
sheath/excess flow system, J. Aerosol Sci., 28, 643–648, 1997. 6404
30
Kerminen, V. M. and Kulmala, M.: Analytical formulae connecting the “real” and the “apparent” nucleation rate and the nuclei number concentration for atmospheric nucleation events, J.
ACPD
6, 6401–6429, 2006 Ion-DMPS L. Laakso et al. Title Page Abstract Introduction Conclusions References Tables Figures J I J I Back Close Full Screen / EscPrinter-friendly Version Interactive Discussion
EGU Aerosol Sci., 33, 609–622, 2002. 6410,6413
Kulmala, M., Pirjola, L., and M ¨akel ¨a, J. M.: Stable sulphate clusters as a source of new atmo-spheric particles, Nature, 404, 66–69, 2000. 6402
Kulmala, M., H ¨ameri, K., Aalto, P., M ¨akel ¨a, J., Pirjola, L., Nilsson, E. D., Buzorius, G., Rannik, ¨
U., Dal Maso, M., Seidl, W., Hoffmann, T., Janson, R., Hansson, H.-C., Viisanen, Y.,
Laakso-5
nen, A., and O‘Dowd, C.: Overview of the international project on biogenic aerosol formation in the boreal forest (BIOFOR), Tellus B, 53, 324–343, 2001. 6409
Kulmala, M., Vehkam ¨aki, H., Pet ¨aj ¨a, T., Dal Maso, M., Lauri, A., Kerminen, V.-M., Birmili, W., and McMurry, P.: Formation and growth rates of ultrafine atmospheric particles: a review of observations, J. Aerosol Sci., 35, 143–176, 2004. 6402
10
Kulmala, M., Lehtinen, K. E. J., and Laaksonen, A.: Cluster activation theory as an explana-tion of the linear dependence between formaexplana-tion rate of 3 nm particles and sulphuric acid
concentration, Atmos. Chem. Phys., 6, 787–793, 2006. 6402
Kusaka, I., Wang, Z.-G., and Seinfeld, J. H.: Ion-induced nucleation, II, Polarizable multipolar
molecules, J. Chem. Phys., 103, 8993–9009, 1995. 6408
15
Laakso, L., M ¨akel ¨a, J., Pirjola, L., and Kulmala, M.: Model studies on ion-induced nucleation in the atmosphere, J. Geophys. Res., D(107), 4427, doi:10.1029/2002JD, 2002. 6402
Laakso, L., Anttila, T., Lehtinen, K., Aalto, P., Kulmala, M., H ˜orrak, U., Paatero, J., Hanke, M., and Arnold, F.: Kinetic nucleation and ions in boreal particle formation events, Atmos. Chem.
Phys., 4, 2353–2366, 2004. 6403
20
Lovejoy, E., Curtius, J., and Froyd, K.: Atmospheric ion-induced nucleation of sulfuric acid and
water, J. Geophys. Res., 109, D08204, doi:10.1029/2003JD004 460, 2004. 6408
M ¨akel ¨a, J. M., Salm, J., Smirnov, V. V., Koponen, I., Paatero, J., and Pronin, A. A.: Electrical charging state of fine and ultrafine particles in boreal forest air, J. Aerosol Sci., 32, 149–150,
2003. 6404
25
Reischl, G., M ¨akel ¨a, J., Karch, R., and Necid, J.: Bipolar charging of ultrafine particles in the size range below 10 nm, J. Aerosol Sci., 27, 931–949, 1996. 6403
Stolzenburg, M. and McMurry, P.: An ultrafine aerosol condensation nucleus counter, Aerosol Sci. Technol., 14, 48–65, 1991. 6405
Tammet, H.: Balanced Scanning Mobility Analyzer, 16th International Conference on
Nucle-30
ation & Atmospheric Aerosols (ICNAA) in Kyoto, 294–297 2004. 6407
Tammet, H.: Continuous scanning of the mobility and size distribution of charged clusters and particles in atmospheric air and the Balanced Scanning Mobility Analyzer BSMA, Atmos.
ACPD
6, 6401–6429, 2006 Ion-DMPS L. Laakso et al. Title Page Abstract Introduction Conclusions References Tables Figures J I J I Back Close Full Screen / EscPrinter-friendly Version Interactive Discussion
EGU
Res., accepted, 2006. 6407
Vana, M., Tamm, E., H ˝orrak, U., Mirme, A., Tammet, H., Laakso, L., Aalto, P., and Kulmala, M.: Charging state of atmospheric nanoparticles during the nucleation burst events, Atmos.
Res., accepted, 2005. 6404
Vesala, T., Haataja, J., Aalto, P., Altimir, N., Buzorius, G., Garam, E., H ¨ameri, K., Ilvesniemi,
5
H., Jokinen, V., Keronen, P., Lahti, T., Markkanen, T., M ¨akel ¨a, J., Nikinmaa, E., Palmroth, S., Palva, L., Pohja, T., Pumpanen, J., Rannik, U., Siivola, E., Ylitalo, H., Hari, P., and Kulmala, M.: Long-term field measurements of atmosphere-surface interactions in boreal forest com-bining forest ecology, micrometeorology, aerosol physics and atmospheric chemistry, Trends in Heat, Mass & Momentum Transfer, 4, 17–35, 1998. 6409
10
Weber, R. J., McMurry, P. H., Eisele, F. L., and Tanner, D. J.: Measurements of expected nucleation precursor species and 3–500 nm diameter particles at Mauna Loa observatory, Hawaii, J. Atmos. Sci., 52, 2242–2257, 1995. 6403
Weber, R. J., Marti, J., McMurry, P. H., Eisele, F., Tanner, D. J., and Jefferson, A.: Measured atmospheric new particle formation rates: implications for nucleation mechanisms, Chem.
15
Eng. Comm, 151, 53–64, 1996. 6402
Wiedensohler, A.: An approximation of the bipolar charge distribution for particles in the sub-micron range, J. Aerosol Sci., 19, 387–389, 1988. 6403,6406,6407
Winklmayr, W., Reischl, G. P., and Lindner, A., and Berner, A.: A new electromobility spectrom-eter for the measurement of aerosol size distributions in the size range from 1 to 1000 nm, J.
20
Aerosol Sci., 22, 289–296, 1991. 6403,6404
Yu, F. and Turco, R. P.: Ultrafine aerosol formation via ion-mediated nucleation, Geophys. Res. Lett., 27, 883–886, 2000. 6412
ACPD
6, 6401–6429, 2006 Ion-DMPS L. Laakso et al. Title Page Abstract Introduction Conclusions References Tables Figures J I J I Back Close Full Screen / EscPrinter-friendly Version Interactive Discussion
EGU
Table 1. Calculated by using minimum concentration of 0.1 cm−3. Exponential fit parameters for event days. BSMA×10−15shows the slope of BSMA fittings
Negative ions Positive ions
Date β λ Eq. (1) @ 1 nm BSMA×10−15 β λ Eq. (1) @ 1 nm BSMA×10−15
13 April 2005 0.9 2.2 82 – 0.2 0.9 2.3 – 14 April 2005 −0.2 0.0 0.8 4.1 −0.3 0.13 0.6 2.7 16 April 2005 2.1 0.9 14 – – – – – 17 April 2005 5.4 2.0 300 0.1 – – – 0.7 18 April 2005 3.7 1.6 97 −0.1 – – – 2.0 19 April 2005 – – – – – – – – 20 April 2005 0.3 0.4 1.6 – – – – – 24 April 2005 – – – – – – – – 25 April 2005 1.0 0.6 4.1 0.2 – – – 0.7 26 April 2005 4.3 0.6 17 −0.8 – – – 0.2 27 April 2005 3.3 0.5 9.1 0.9 – – – 2.5 30 April 2005 – – – 2.2 – – – – 02 May 2005 −0.6 0.3 −0.1 4.1 −0.6 0.2 0.1 4.9 03 May 2005 0.7 0.8 4.0 6.9 -0.3 0.0 0.7 6.9 08 May 2005 – – – −0.6 – – – – 10 May 2005 2.2 1.5 46 −0.5 – – – 0.0 11 May 2005 3.5 1.5 65 1.7 0.7 0.7 3.8 2.8 12 May 2005 1.7 1.4 27 0.7 0.5 0.6 2.7 0.8 13 May 2005 1.7 1.7 53 −0.6 2.2 1.7 63 −0.2 14 May 2005 0.3 0.9 2.9 −0.5 0.6 0.8 3.6 −1.0 16 May 2005 4.6 1.7 130 −0.2 – – – 4.5 17 May 2005 2.6 1.6 67 0.4 0.8 2.6 130 3.8 20 May 2005 0.2 1.9 11 0.0 −0.3 0.2 0.7 0.7 21 May 2005 2.2 1.0 17 2.8 – – – 5.8 22 May 2005 1.8 0.4 5.4 0.1 – – – 0.3 31 May 2005 – – – 0.5 – – – −0.6 01 June 2005 1.0 0.3 3.0 -0.3 – – – 0.5 03 June 2005 2.2 0.4 – −2.2 – – – −6.6 08 June 2005 – – – −0.6 – – – −3.0 09 June 2005 2.7 0.4 7.5 0.1 – – – 0.2 10 June 2005 1.3 0.7 6.9 1.8 – – – 3.0 11 June 2005 1.1 0.4 3.7 3.1 – – – 1.8 15 June 2005 – – – 5.1 – – – −0.9 19 June 2005 1.8 0.6 6.3 −0.7 0.4 0.2 – −3.2 Min −0.6 0.0 0 −2.2 0.6 0.0 0 −6.6 Max 5.4 2.2 300 6.9 2.2 2.6 130 6.9 Median 1.8 0.8 10 0.2 0.4 0.6 3 0.7 Mean 1.9 1.0 38 1.0 0.4 0.7 21 1.1
ACPD
6, 6401–6429, 2006 Ion-DMPS L. Laakso et al. Title Page Abstract Introduction Conclusions References Tables Figures J I J I Back Close Full Screen / EscPrinter-friendly Version Interactive Discussion
EGU
Oven Bipolarcharger DMA
CPC (1) TSI 3025 Bipolar charger On/Off CPC (2) TSI 3025 DMA ION - DMPS
Fig. 1. A schematic figure of measurement apparatus and the laboratory setup. In ion-DMPS
(boxed with dashed line) ultrafine particles are either directed to the Differential Mobility An-alyzer (DMA) via bi-polar charger (Ni-63), where the sample reached an equilibrium charge distribution, or the charger is by-passed and the charge distribution is measured as it is. The DMA has a switchable high voltage supply, which enables measurements of both negative and positive polarities. For laboratory verifications, monomodal test aerosol was produced with a heated oven and directed to the ion-DMPS setup and a reference instrument (TSI model 3025) in order to determine total number concentration of generated aerosol particles and ensure constant output of the generator.
ACPD
6, 6401–6429, 2006 Ion-DMPS L. Laakso et al. Title Page Abstract Introduction Conclusions References Tables Figures J I J I Back Close Full Screen / EscPrinter-friendly Version Interactive Discussion EGU 0 2 4 6 8 10 0 0.5 1 1.5 Diameter (nm)
Normalized concentration ratio
Fig. 2. Charge balance of laboratory generated ammonium sulphate (upper panel) and
sil-ver (lower panel) particles determined with the Ion-DMPS. Concentration of positive particles detected with the ion-DMPS is lower than negative particles is a result of lower charging effi-ciency for the positive polarity. In addition, the ratio changes as a function of particle diameter decreases as the diameter decreases. Ratios are normalized with negative concentration. As the charger was turned on, concentrations increased approximately 10%. Colors: dark blue: negative neutralized; Cyan: negative; Magenta: positive; Red: positive neutralized.
ACPD
6, 6401–6429, 2006 Ion-DMPS L. Laakso et al. Title Page Abstract Introduction Conclusions References Tables Figures J I J I Back Close Full Screen / EscPrinter-friendly Version Interactive Discussion EGU 0 2 4 6 8 10 0 0.5 1 1.5 Diameter (nm)
Normalized concentration ratio
Fig. 3. A schematic figure showing the contributions of ion-induced and neutral nucleation.
On the left column: absolute concentrations; middle column: charged fraction and equilibrium charged fraction; right column: fraction obtained from ion-DMPS. First row represent situation with pure ion-induced nucleation, second line pure neutral nucleation. Third line is a combi-nation of ion-induced nucleation with a domicombi-nation of ion nucleation whereas fourth line is a combination of neutral and ion-induced nucleation with dominating neutral nucleation.
ACPD
6, 6401–6429, 2006 Ion-DMPS L. Laakso et al. Title Page Abstract Introduction Conclusions References Tables Figures J I J I Back Close Full Screen / EscPrinter-friendly Version Interactive Discussion EGU x x x x x Ion-DMPS Charged fraction Absolute particle concentration dp #/cm 3 dp dp % 1 Ion-induced nucleation 0 Total Equilibrium x x x x x dp #/cm 3 dp dp % 1 Neutral nucleation 0 Total x x x x x dp #/cm 3 dp dp % 1 Ion-induced + neutral nucleation 0 Total x xx x x dp #/cm 3 dp dp % 1 Neutral + ion-induced nucleation 0 Total Equilibrium Ion-DMPS Equilibrium Equilibrium Equilibrium -1 or +1 -1 or +1 -1 or +1 -1 or +1
Fig. 4. A schematic figure showing the contributions of ion-induced and neutral nucleation.
On the left column: absolute concentrations; middle column: charged fraction and equilibrium charged fraction; right column: fraction obtained from ion-DMPS. First row represent situation with pure ion-induced nucleation, second line pure neutral nucleation. Third line is a combi-nation of ion-induced nucleation with a domicombi-nation of ion nucleation whereas fourth line is a combination of neutral and ion-induced nucleation with dominating neutral nucleation.
ACPD
6, 6401–6429, 2006 Ion-DMPS L. Laakso et al. Title Page Abstract Introduction Conclusions References Tables Figures J I J I Back Close Full Screen / EscPrinter-friendly Version Interactive Discussion EGU 10−8 10−7 10−6 D p [m] 10 100 1000 10000 100000 dN/dlogDp [cm−3] 10−8 D p [m] b) 10−8 D p [m] c) 10−8 D p [m] d) 0 3 6 9 12 15 18 21 24 10−8 D p [m] Time [h] e) 0.01 0.1 1 10 100 dN/dlogDp [cm−3] a)
Fig. 5. Data on the distribution on the 21 May 2005: (a) Size distribution in time of all submicron
particles measured with a DMPS,(b) size distribution in time of the negative neutralized ions, (c) negative natural ions, (d) positive neutralized ions, and (e) positive natural ions measured
with the ion-DMPS. Mind the different scales for concentration and particle diameters in DMPS and ion-DMPS.
ACPD
6, 6401–6429, 2006 Ion-DMPS L. Laakso et al. Title Page Abstract Introduction Conclusions References Tables Figures J I J I Back Close Full Screen / EscPrinter-friendly Version Interactive Discussion
EGU
ACPD
6, 6401–6429, 2006 Ion-DMPS L. Laakso et al. Title Page Abstract Introduction Conclusions References Tables Figures J I J I Back Close Full Screen / EscPrinter-friendly Version Interactive Discussion
EGU
ACPD
6, 6401–6429, 2006 Ion-DMPS L. Laakso et al. Title Page Abstract Introduction Conclusions References Tables Figures J I J I Back Close Full Screen / EscPrinter-friendly Version Interactive Discussion EGU 9 12 15 18 0 2 4 6 8 Negative Time (hour) Charging ratio 9 12 15 18 0 2 4 6 8 Positive Time (hour) Charging ratio 3nm 5nm 7nm
ACPD
6, 6401–6429, 2006 Ion-DMPS L. Laakso et al. Title Page Abstract Introduction Conclusions References Tables Figures J I J I Back Close Full Screen / EscPrinter-friendly Version Interactive Discussion
EGU
Fig. 9. On the left, median ratio for all class 1 and 2 days. On the right, median ratio for a
witness sample of 5 non-event days. The upper part is for negative ions while the lower part is for positive ions.
ACPD
6, 6401–6429, 2006 Ion-DMPS L. Laakso et al. Title Page Abstract Introduction Conclusions References Tables Figures J I J I Back Close Full Screen / EscPrinter-friendly Version Interactive Discussion EGU 100 100 101 102 Negative ions − 050502 Diameter (nm) Median concentration [cm − 3 ] 100 100 101 102 Positive ions − 050502 Diameter (nm) Median concentration [cm − 3 ] Data points Fitting
ACPD
6, 6401–6429, 2006 Ion-DMPS L. Laakso et al. Title Page Abstract Introduction Conclusions References Tables Figures J I J I Back Close Full Screen / EscPrinter-friendly Version Interactive Discussion EGU −8 −6 −4 −2 0 2 4 6 8 −1 0 1 2 3 4 5 6 10−15 x BSMA slope ∆ N/∆ d p [m −4 ] β Positive Negative Neutral nucleation dominates Overcharged Undercharged
Fig. 11. Comparison between BSMA and Ion-DMPS results. x-axis show the slope of fittings
done to ion concentrations obtained from BSMA whereas y-axis show the value of Eq. (1). Point with high positive slope and low charged fractions indicate domination of neutral nucleation.