HAL Id: hal-00302585
https://hal.archives-ouvertes.fr/hal-00302585
Submitted on 9 Aug 2005
HAL is a multi-disciplinary open access
archive for the deposit and dissemination of
sci-entific research documents, whether they are
pub-lished or not. The documents may come from
teaching and research institutions in France or
abroad, or from public or private research centers.
L’archive ouverte pluridisciplinaire HAL, est
destinée au dépôt et à la diffusion de documents
scientifiques de niveau recherche, publiés ou non,
émanant des établissements d’enseignement et de
recherche français ou étrangers, des laboratoires
publics ou privés.
formation and filamentary structures
N. Singh, C. Deverapalli, A. Rajagiri, I. Khazanov
To cite this version:
N. Singh, C. Deverapalli, A. Rajagiri, I. Khazanov. Dynamical behavior of U-shaped double layers:
cavity formation and filamentary structures. Nonlinear Processes in Geophysics, European Geosciences
Union (EGU), 2005, 12 (6), pp.783-798. �hal-00302585�
SRef-ID: 1607-7946/npg/2005-12-783 European Geosciences Union
© 2005 Author(s). This work is licensed under a Creative Commons License.
Nonlinear Processes
in Geophysics
Dynamical behavior of U-shaped double layers: cavity formation
and filamentary structures
N. Singh, C. Deverapalli, A. Rajagiri, and I. Khazanov
Department of Electrical and Computer Engineering and CSPAR, University of Alabama, Huntsville, Al 35899, USA Received: 24 February 2005 – Revised: 9 May 2005 – Accepted: 12 May 2005 – Published: 9 August 2005
Part of Special Issue “Nonlinear and multiscale phenomena in space plasmas”
Abstract. Observations from the Polar and FAST satellites
have revealed a host of intriguing features of the auroral ac-celerations processes in the upward current region (UCR). These features include: (i) large-amplitude parallel (E||) and perpendicular (E⊥) fluctuating as well as quasi-static electric fields in density cavities, (ii) fairly large-amplitude unipolar parallel electric fields like in a strong double layer (DL), (iii) variety of wave modes, (iv) counter-streaming of upward go-ing ion beams and downward accelerated electrons, (v) hori-zontally corrugated bottom region of the potential structures (PS), in which electron and ion accelerations occur, (vi) fil-amentary ion beams in the corrugated PS, and (vii) both up-ward and downup-ward moving narrow regions of parallel elec-tric fields, inferred from the frequency drifts of the auroral kilometric radiations. Numerical simulations of U-shaped potential structures reveal that such observed features of the UCR are integral parts of dynamically evolving auroral U-shaped potential structures. Using a 2.5-D particle-in-cell (PIC) code we simulate a U-shaped broad potentialstructure (USBPS). The dynamical behavior revealed by the simula-tion includes: (i) recurring redistribusimula-tion of the parallel po-tential drop (PPD) in the PS, (ii) its up and downward mo-tion, (iii) formation of filaments in the potential and density structures, and (iv) creation of filamentary as well as broad extended density cavities. The formation of the filamentary structures is initiated by an ion-beam driven instability of an oblique ion mode trapped inside a broad cavity, when it be-comes sufficiently thin in height. The filaments of the PS cre-ate filamentary electron beams, which genercre-ate waves at fre-quencies above the lower hybrid frequency, affecting plasma heating. This results in plasma evacuation and formation of a cavity extended in height. The waves associated with fila-mentary electron beams also evolve into electron holes. The transverse and parallel scale lengths of the regions with large
E|| and E⊥ as well as their magnitudes are compared with satellite data.
Correspondence to: N. Singh
1 Introduction
Hull et al. (2003); Mozer and Hull (2001) and more re-cently Ergun et al. (2004) reported that auroral density cav-ities are the locations for large parallel electric fields (E||), which are invariably accompanied with perpendicular elec-tric fields (E⊥)in the upward current region (UCR) of the auroral plasma. The ratio of E|| to (E⊥) ranges from ∼0.25 to O(10). It was also shown that the large-scale structures in the electric fields have substructures, which have perpendic-ular width L⊥∼1–20 km. The temporal behavior of the fields revealed a low-frequency component below 10 Hz along with high-frequency components near ion cyclotron frequencies of H+ and He+ ions. Pottelette et al. (2004) showed from FAST data that E||responsible for accelerating auroral elec-trons and ions could occur in localized regions, which are quite narrow in altitude (∼10 km) and are shifted up and down within a few kilometers. Furthermore, they found that
E||is turbulent and spiky with an upward average field. Prior to these recent reports, McFadden et al. (1999) reported that UCR region is characterized by deep density cavities with no cold plasma and they are primarily populated by up-going ion beams and down-going electron beams. Nonlinear elec-trostatic structures like electron and ion holes were also ob-served and sometime simultaneously in the cavities; the elec-tron holes were seen in conjunction with filamentary elecelec-tron beams.
The purpose of this paper is to present results from 2.5-D Particle-in-cell (PIC) simulations of U-shaped broad poten-tial structures (USBPS) closely revealing some of the ob-served features of the electric fields in the UCR. We present here the temporal and spatial evolution of a 2-D U-shaped po-tential structure (PS) including breaking of a broad U-shaped structure into thinner density and potential substructures, the generation of both thin and broad density cavities, genera-tion of ion cyclotron and lower hybrid fluctuagenera-tions inside the cavity, formation of electron and ion holes, and motion of the PPD as a DL.
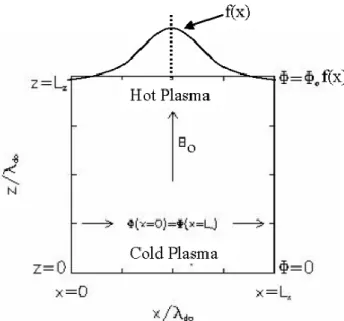
Fig. 1. Geometry of the simulation: the simulated size of the plasma
is Lx×Lzand the ambient magnetic field is along the z-direction.
The horizontal distribution of the applied potential φ (x) at z=Lzis
shown by f (x).
2 Simulation method
We use a 2.5-D particle-in-cell (PIC) code to model the USPS in the x-z plane as shown in Fig. 1. The ambi-ent magnetic field Bo is along z. We use an electrostatic code, in which Poisson equation for the electric potential
ϕ(x, z) is solved with the following boundary conditions:
ϕ(x=0, z)=ϕ(x=Lx, z), ϕ(x, z=0)=0, and
ϕ(x, z=Lz)=ϕoexp[−(x − Lx/2)2/ξ2], (1) where Lxand Lzare the size of the simulated plasma along
xand z directions, ξ gives the perpendicular scale length in the distribution of the potential applied at the top boundary at z=Lz, and ϕo is the amplitude of the applied potential. For the UCR ϕois negative. Note that the boundary condi-tion in x is periodic. At the bottom of the simulated plasma (z=0), we inject a cold plasma by maintaining a plasma reser-voir in which plasma particles have isotropic Maxwellian velocity distribution function with equal electron and ion temperatures Teco=Tico=Tco. Likewise, at the top bound-ary (z=Lz)we inject hot plasma from a plasma reservoir, in which the hot electron and ion temperatures are Teho=Toand
Tiho=4To, respectively. In the simulations described here, we assumed that Tco=To/10. We denote the plasma density in the bottom and top reservoirs by ncofor the cold and nho for the hot plasma, respectively. In the simulations reported here we have nco=nho=no, that is, the same densities for the cold and hot plasmas in their respective bottom and top reservoirs, respectively. All simulations were performed for ion to electron mass ratio M/m=400, which is found to be sufficiently large to separate different electron and ion time
scales of the physical processes involved in the DL dynam-ics.
At the initial time t =0, the simulation region is empty. We begin the simulations by filling the two plasma reser-voirs and let the plasma in them self-consistently expand into the simulation region, subject to the boundary condi-tions on ϕ(x, z). The plasma particles are allowed to leave the simulated-plasma region while exiting at z=0 and z=Lz. Along x we use a periodic boundary condition on the par-ticles. We use the following definitions and normalizations: distances (x and z) are measured in units of Debye length
λdo=aeho/ωpo, time in units of tn=ωpo−1=(noe2/mεo)−1/2, ve-locities (Vx, Vz, and Vz)in the units of aeho=(kBTo/m)1/2, potential in ϕn=(kBTo/e), electric fields in En=ϕn/λdo, en-ergy in Wn=kBTo and current in Jn=enoaeho, where kB is the Boltzmann constant, e is the magnitude of electronic charge, and εo is the electrical permittivity of free space. The plasma density is normalized in units of no. Unless stated otherwise, all quantities in the following text as well as in the figures are expressed in their respective normalizing units. The time step in advancing the simulation is 0.05 tn and spatial grid spacing is λdo both in x and z. The ambi-ent magnetic field Bo was chosen to give e/ωpo=3. In all the simulations reported here, the applied potential drop is
ϕo=−30, and ξ =200λdo=15ρiho, where ρiho is the average hot ion Larmor radius and for the parameters of the simula-tions ρiho=13.3λdo. For satisfying the Bohm criterion for double layer formation we impose an average drift in the negative z direction for the hot electrons in the top reser-voir, namely, |Vdeh|>aeho, the hot electron thermal veloc-ity; specifically we chose |Vdeh|/aeho=1.1. The hot ions in the top reservoir have no average drift, that is their velocity distribution is non-shifted Maxwellian. The cold ions in the bottom plasma reservoir are given an average drift in the pos-itive z direction with zero drift for the electrons. Specifically, the drift velocity of the cold ions is Vdic=1.5 aico, where aico is the cold ion thermal velocity.
3 Numerical results
We performed three runs in which all parameters were the same except for the dimension of the simulation box along
Bo, Lz. In runs R-1, R-2, and R-3, we have Lz=256, 512 and 1024, respectively. In all these runs Lx=1024, which accom-modates nicely the imposed potential structure with ξ =200. These three runs were performed to ensure that the plasma processes seen in them are authentic plasma physical phe-nomena and not an artifact of the limited size of the simula-tion box.
3.1 Temporal and spatial evolution of a U-shaped broad po-tential structure (USBPS)
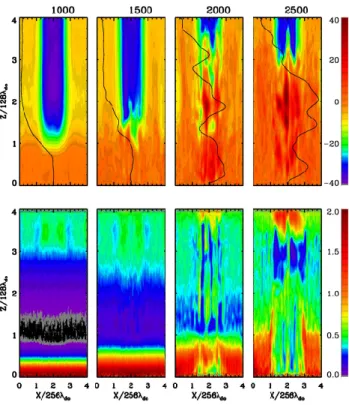
The top and bottom panels in Fig. 2 show the evolution of po-tential and density structures at early times, t <2500, as seen in run R-2; in the top and bottom rows of panels in Fig. 2
equi-potential and equi-density contours are plotted. This early-phase evolution is associated with the initial filling of the simulation region with cold and hot plasmas from the bot-tom and top boundaries, respectively. This filling is evident be comparing the density panels for t =1000 and 1500; plas-mas of higher densities are progressively penetrating deeper into the simulation region from both top and bottom ends. At the initial time t=0, when there is no space charge, the po-tential distribution along z at any x is linear giving parallel electric field Ez(x, z)=ϕ(x, z=Lz)/Lz. The expanding plas-mas modify the initial field forming a USBPS as seen in the panel for t =1000 in Fig. 2; the perpendicular scale length of the USBPS is determined by the applied non-uniform poten-tial given by (1) and its parallel potenpoten-tial drop (PPD) is local-ized in a deep density cavity near the bottom over the height range from z∼128 to z∼256 as shown by ϕ (x=512, z) by the black-line curve. But, this USBPS is not stable, as seen by the considerable changes in it shown in the subsequent panels at t=1500–2500; first the equi-potential contours near the bottom of the USBPS develop corrugation as seen from the plot for t=1500. Subsequently, the narrow channels of negative (low) potentials recede upward leaving behind thin filamentary structures in both the potential and density struc-tures as seen from the plots at t =2000 and 2500; a noteworthy feature of the evolving PS is the persistent feature of corru-gation at the bottom where the PPD occurs in multiple fine-scale substructures. We point out here, that the above tem-poral feature of the USBPS is recurring independent of the initial condition of empty simulation region. Therefore, we first present a summary of the evolution of the USBPS over the entire run time t=10 000 before discussing the physics of the recurring dynamic processes.
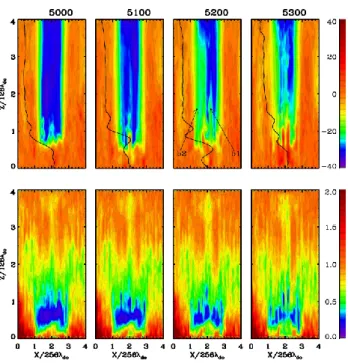
Figure 3 shows the further evolution of the potential (top row) and density (bottom row) structures from t=3000 to
t=10 000. The top row of the panels in Fig. 3 shows that the potential structure, which had receded to higher heights, by t =2500 slowly descends down reaching a low height near
z∼128 at times t ∼5000. Soon after the descent, the USBPS again rather quickly recedes to higher heights and once again it makes a relatively slow descent to nearly the same low height by the time t ∼9000, as it did previously at t ∼5000. We point out that the process of receding to higher heights is much faster than that of the descent. Soon after the de-scent of the PPD to z∼128, the plasma density as well as the potential undergo a rapid filamentation as clearly seen from the plots at t=2500 (Fig. 2), 6000 and 10 000 (Fig. 3). The filamentation leads first to the formation of density striations followed by creation of a broad density cavity with imbed-ded thin structures extending to large heights as seen from the density plots at t =2000 and 2500 in Fig. 2, and at t =7000 and 10 000 in Fig. 3. The USBPS, with imbedded fine struc-tures underneath, rises to higher heights near the top of the cavity. Subsequently as the cavity refills with hot plasma from the top, USBPS descends down eventually reaching the low height z∼128, where the filamentation is triggered as mentioned above and the subsequent processes are repeated.
Fig. 2. Top row: Early-time evolution of a 2-D U-shaped potential
structure. Equi-potential surfaces are shown in color with levels indicated by the color bar on the right. The solid-line curves in the upper panels show the parallel potential profile in the USBPS along
x=512. Bottom row: equi-density surfaces of density structures associated with the potential structures in the top row with density scales shown by the color bar on the right. Times are labeled on the top.
Thus, we find from Figs. 2 and 3 that the potential and the density structure undergo a cyclic evolution, including recur-ring formation of a USBPS, its filamentation, fast upward propagation of the PPD, formation of thin and long substruc-tures in the plasma density underneath it, followed by plasma depletions and creation of a broad density cavity, subsequent downward motion of the bottom of the USBPS containing the PPD forming a broad and vertically extended potential struc-ture. When the parallel potential drop in the structure (US-BPS) reaches near the lower boundary, where cold plasma dominates, the above set of processes begin to repeat again. In R-1 with Lz=256 and in R-3 with Lz=1024 we saw the exactly same evolutionary behavior but with the duration of the cycles halved and doubled of that in R-2, respectively.
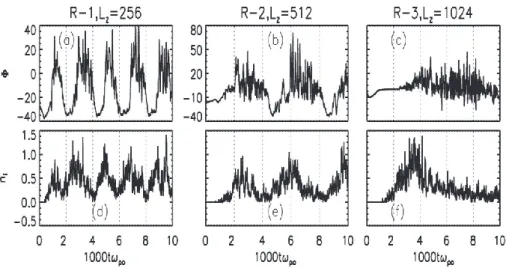
The cyclic behavior of the potential structure in R-1, R-2 and R-3 is more clearly revealed by the top panels in Fig. 4; in these panels we have plotted ϕ(t) at the point (512, 128). The corresponding temporal variations in the plasma density
ni at the same point are plotted in the bottom panels. The panels for R-1 reveal that ϕ and ni undergo nearly 5 cy-cles over the run time of t=10 000. In R-2 there are ∼2.5 cycles over the same run time while in R-3 only one cy-cle is seen. In R-1 and R-2, only the first cycles or so are affected by the initial refilling of the empty simulation
Fig. 3. Same as Fig. 2, but at later times; note the cyclic fast upward motion and relatively slow downward motion of the bottom of the
USBPS. Also note the cyclic formation of filamentary density cavities, their evolution into a broad cavity extended in height and then its shrinking with the downward motion of the USBPS.
Fig. 4. Top row: temporal variation of the potential at (128, 512) in runs (a) R-1, (b) R-2 and (c) R-3. Bottom row: same as the top row, but
showing the density. Note the cyclic variation with 5 cycles, 2.5 cycles and 1 cycle in R-1, R-2, and R-3, respectively.
region and the latter cycles are the consequence of intrinsic plasma processes driven by the electrodynamics of the US-BPS. Comparing results from R-1 and R-2 with that in R-3, we conclude that even in R-3 the results after very early times
t ∼2000 are essentially intrinsic plasma effects unaffected by the initial condition of an empty simulation region.
The time taken for the USBPS to move from top to bottom in R-1, R-2 and R-3 scales linearly with the vertical size Lz. This linear scaling of the transit time is expected because the
USBPS descends with the hot plasma expanding from the top with ion-acoustic speed
Cs=[(kBTeho+3kBTiho)/M]1/2=0.16 aeh (2) The downward expansion occurs into the plasma cavity, which is not an artifact of the initially empty simulation re-gion, but it is a consequence of the self-consistent plasma processes occurring in the simulation, including cavity for-mation.
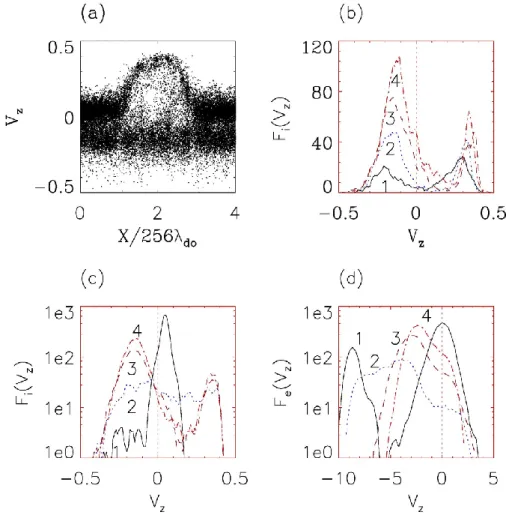
Fig. 5. Parallel velocity distribution of ions and electrons: (a) x−Vzphase space of ions lying in height range 128<z<192 at t=5000. Note the counter-streaming of ion beams in the central region. (b) Temporal evolution of Fi(Vz)for ions in the height range 128<z<192: (1)
t=4600, (2) t=4800, (3) t=5000, (4) t=5200. (c) Spatial evolution of Fi(Vz)for ions at t=5000 (1) z<64, (2) 64<z<128 , (3) 128<z<192,
and (4) 192<z<256. (d) Spatial evolution of Fe(Vz)the same time and height range as Fi(Vz)in (c).
In order to better understand the cyclic behavior of the US-BPS and its consequences, we next discuss the plasma effects and processes driven by the USBPS using results from R-2. When the USBPS descends down to the lowest height, the potential at the point (256, 128) reaches ϕ≈ϕo=−30 (Fig. 4), which is the maximum applied potential difference given by Eq. (1). Thus, the entire parallel potential drop is concen-trated below z∼128 in a DL as shown by the 2-D PS in the panel for t=5000 in Fig. 3 and the corresponding potential profile ϕ(z) along x=512 plotted in the same panel; the par-allel potential drop occurs in a density cavity near the bot-tom as seen from the density structure for t =5000 in Fig. 3; the minimum normalized density in the cavity is ∼0.2 (also see Fig. 8). As shown by the PS at the subsequent times in Fig. 3, The USBPS at t=5000 is not stable; it begins to undergo rapid filamentation as soon as it descends to suffi-ciently low heights where the influx of the cold ions from the bottom boundary in to the cavity becomes increasingly strong.
The ion density plot in Fig. 4e shows that just before
t=5000, the density at the point (512, 128) below the
par-allel potential drop is beginning to increase with time. This is due to plasma expansion from the bottom. Increasing ion density below the USBPS gives rise to an increase in the ion beam density above the parallel potential drop in the USBPS. The enhanced ion beam density triggers plasma instabilities, which contribute to the initiation of the process of filamenta-tion of the USBPS and the plasma density as seen from the plots for t=6000 in the top and bottom panels of Fig. 3, re-spectively. At t =5000 when a horizontally broad PPD exists near z∼128, there is a deep density cavity fairly localized near z∼128 and the plasma density steadily increases with increasing height above it. However, remnants of prior fila-mentations in the density are visible even in the density plot at t=5000. The subsequent density plot at t =6000 shows that the filamentation in the plasma density has become deeper and it extends nearly to the top near z∼Lz. The details of the progress in the filamentation process are shown later in Figs. 6 and 12.
The density plot at t=7000 (bottom panels, Fig. 3) shows that the filamented plasma below the corrugated PPD, now at large heights, has eroded away giving rise to the formation
Fig. 6. Potential (top panels) and density (bottom panels) structures
shown at fine time resolution highlighting the development of the ion instability, which generates the striations in the density and ini-tiates the formation of the alternating fingers of high and low (neg-ative) potentials. Times are labeled at the top of the panels. Fingers “b1” and “b2” are identified for later reference.
of a broad density cavity much extended in height. The plots in the bottom panels at t=8000 and 9000 in Fig. 3 show that the cavity fills from the top. We find that at t ∼8600, the po-tential and density structures (not shown in Fig. 3) are nearly the same as t ∼5000, thus completing a cycle of evolution. The plots at t=10 000 in Fig. 3 show again the rapid filamen-tation of the USBPS, beginning the third cycle of evolution in R-2. It is worth mentioning that the density striations are more clearly seen at t =6000 and 10 000 in contrast to the cor-responding filaments in the potential structure. The reason for this will be made clear when we discuss the plasma pro-cesses, which generate the formation of filamentary density and potential structures in the USBPS.
3.2 Plasma instabilities affecting the stability of the USBPS How is the filamentation process triggered and what are its consequences for the USBPS? Since the filamentation is trig-gered only after the PPD in the USBPS descends down to low heights where cold plasma density and hence the cold ion influx are increasing with time, it appears that an ion beam accelerated by the PPD initiates the process of fila-mentation. We find that another contributing factor to the initiation process is the shrinking size of the density cavity with the downward motion of the PPD (Fig. 3); the cavity with reduced parallel size acts like a cavity resonator for the ion-beam driven modes. The cold electrons are trapped be-low the parallel potential drop. The cold ion beam with
en-hanced density interacts with the hot ions trapped in the low-potential region of the USBPS. Since the hot ions themselves are accelerated downward as a consequence of the expan-sion of the hot plasma with the descending USBPS, there is a counter-streaming of plasma beams in the low-potential re-gion above the PPD. This is shown in Fig. 5a, in which x−Vz phase space at t=5000 is plotted for the ions in the height range 64<z<192; the two distinct ion populations well sep-arated in Vzare clearly seen. Figure 5b shows the temporal evolution of the parallel velocity distribution function for the ions, Fi(Vz), in the central region (384<x<640) of the US-BPS over the height range 96<z<160. We find that over the time from t∼4800 to 5200 a colder and stronger up-going beam emerges with the average beam velocity Vibu=0.38; this beam is the consequence of the acceleration of cold ions entering the USBPS from the bottom with increasing in-flux. Likewise, a down-going hot ion beam also grows as the hot plasma expands with the down-going USBPS. The aver-age beam velocity of the hot ion beam is Vibd=−0.12 aeho. Figure 5c shows the s patial (height) evolution of Fi(Vz)at
t=5000; for z<64 the dominant population is the cold ions. In the midst of the parallel potential drop (64<z<128), the cold and hot ions mix and produce a very broad distribu-tion; at higher heights above the parallel potential drop the two ion populations are distinctly separated forming counter-streaming beams as mentioned above.
Figure 5d shows the electrons’ velocity distribution func-tion, Fe(Vz), like that for the ions in Fig. 5c. For z<64, be-low the USBPS, a trapped cold electron population, which has been considerably heated by the plasma turbulence, co-exists with an electron beam accelerated by the PPD. In the transition region of the PPD, electrons have a very broad dis-tribution with very small slope near Vz∼0. Above z∼128, the electron population is basically the one injected at the top (z=Lz), but progressively accelerated downward like in a pre-sheath. This population, in combination with a heated population near Vz∼0 yields the small slope in this zero-velocity range. The ion beams mentioned above occupy the velocity space near Vz=0 and thus, any ion-beam driven instability is unaffected by any damping by the electrons. The moments of Fi(Vz)over the height range 64<z<192 at
t=5000 (Figs. 5c) are as follows; up-going cold ion beam: average drift velocity Vibu=0.32 aeho, parallel temperature
Tibu=0.6 To; trapped ions: Vibd=−0.12 aeho, parallel temper-ature Tit ||=2 To, perpendicular temperature Tit ⊥=4 To. Like-wise, the moments of Fe(Vz)(Fig. 5d) are as follows: parallel drift velocity Ved=−1.2 aeho, parallel temperature Te||=3 To, perpendicular temperature Te⊥=To. The ion-acoustic speed with the above parallel electron temperature is Cs∼0.2 aeho. Compared to this speed, the relative drift between the ion beams is Vid=0.44 aeho. The above plasma parameters sug-gest that the interaction between the ion beams could drive electrostatic ion cyclotron (EIC) as well as oblique ion-acoustic (OIA) waves. However, the local plasma inhomo-geneity makes the instability analysis difficult. In our simula-tions the ion cyclotron period is τci=833ω−po1and we find that the instability driven oscillations grow at a much faster time
scale compared to τcigiving a clue that OIA waves dominate. We examine next, the nature of the instability highlighting the linear stage of the driven oscillations just before the long and deep filaments form in the density structure.
Figure 6, like Fig. 3, shows the evolution of the potential and density structures but on an expanded horizontal scale and finer time resolution from t =5000 to 5300 revealing that the effect of the growing oscillations spreads to large heights very rapidly. At t =5000, the oscillations at the bottom of the USBPS are confined in the transition region of the PPD; otherwise, most of the space inside the structure, shown in dark blue, has a potential near ∼−30. The subsequent plots show that soon there are fingers of higher potentials (∼−20, shown in green) penetrating into the dark blue region. At even later times, such fingers attain higher potentials (red and orange) shown in Fig. 6. We try to understand the origin and mechanism of the finger formation. During the short time the oscillations in the potentials have developed into inter-penetrating fingers of low and high potentials, the density, shown in the bottom panels of Fig. 6, has developed deeper filaments; the deepest part of the density cavity, appearing in Blue at the bottom of the USBPS, is completely striated by the time t =5200 and the striations extend upward as fil-amentary density cavities, alternating with filaments of den-sity enhancements. The filamentary cavities (bottom panels) and the fingers of higher potentials (top panels) are nearly co-located.
In order to further characterize the oscillations near
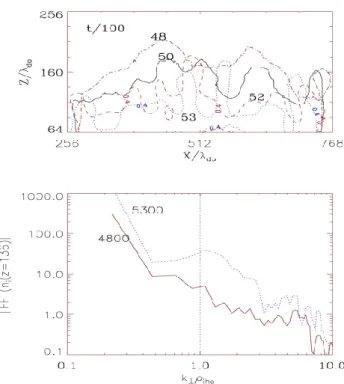
t ∼5000 mentioned above, Fig. 7a shows the evolution of the spatial oscillation in a specific ion density contour, namely,
ni=0.4, from t =4800 to 5200. Note that the contours shown are in the central region of the PS over 256<x<768. With increasing time after t ∼4800 the contour develops large-amplitude oscillations with fine structures along x. Figure 7b shows the wave number spectrum of such oscillations in the ion density ni(x, z=136) at t =4800 as well as at t =5200. The horizontal axis in Fig. 7b is k⊥ρiho, where k⊥ is the wave number in the x direction and the normalization factor ρiho is the hot ion average Larmor radius. Comparing Figs. 7a and b, we find that as the oscillations grow the power is concen-trated in wave number near k⊥ρiho∼1.1, which yields per-pendicular wavelength λ⊥∼=2πρiho∼=76λdo.
In order to determine the wave structure parallel to the magnetic field, we examine the ion density distribution
ni(x=512, z) as plotted in Fig. 8 for the same time interval as in Fig. 7. The noteworthy feature of the vertical density pro-file is that, it has a deep density cavity near the bottom of the PS, as noted earlier. The large-amplitude oscillations initiate in the cavity near t ∼5000. It is difficult to determine the ex-act wave mode of the oscillation in such an inhomogeneous plasma; the oscillations develop in the region of density gra-dients for z>64. However, for the oscillations in the density for t =5200, we estimate that the parallel wavelength λ||∼50– 100 λdo giving k||ρiho∼1.6–0.8. Since the oscillations de-velop at a much faster time scale than the ion cyclotron pe-riod τci=833, we believe that they belong to an oblique ion acoustic mode with a frequency ω∼k||Vibu∼0.025-0.05ωpo,
Fig. 7. Development of the ion-mode instability: (a) Growing
spa-tial oscillations in the density contour for ni=0.4 over time interval
from t=4800 to t=5200. (b) Wave number spectrum of the spa-tial fluctuations in the ion density ni(x)along z=136 and at times
t=4800 and 5200. Note the growth of the short-scale perpendicular oscillations with wave number peaking near k⊥ρiho∼1.1 at t=5200.
which is in the range of ion oscillations; note that ion plasma frequency with the mass ratio M/m=400 and normalized density of unity is ωpio=0.05ωpoand the minimum density in the cavity is ni∼0.1 and corresponding minimum ion plasma frequency is ωpi∼0.015ωpo. Thus the linear wave mode is trapped inside the cavity and grows fast, owing to the res-onant instability becoming an absolute instability due to re-flections from density gradients and resulting feedback. 3.3 Nonlinear evolution
As mentioned above, another important issue is that, the ef-fects of the oscillations locally generated just above the PPD quickly rise to large heights above the cavity; the large am-plitude perturbations reach large heights in a short interval of time 1t∼100. This can be clearly seen from Fig. 6; the perturbations in the potentials at the bottom of the structure (USBPS) are seen to rise nearly to the top in successive plots, which are only 100 units apart in time. Even though the ini-tial oscillations are ion modes, the fast communication of the larger potentials to higher heights forming intertwined fingers of low and high potentials must involve some elec-tron mode. We explain this behavior physically in terms of collection of electrons by a body biased at a large positive potential in magnetized plasmas; the body collects electrons from a long volume of plasma extending along the magnetic field lines passing through it. The electrons’ depletion from
Fig. 8. Evolution of the vertical structure in ni(x=512, z) during
the growth of the ion oscillations shown in Fig. 7.
Fig. 9. Schematic diagram showing the growth in the potential
fingers arising from positive, potential perturbations in the nega-tive background potential. The electrons accelerated downward by the positive potential perturbations cause (i) filamentary electron beams, (ii) density depletions and, (iii) fast rise of the positive po-tential perturbations to large heights. In contrast, the regions with the negative-potential perturbations and high densities remain stag-nant for a much longer time.
the volume generates an extended positive potential sheath (Laframboise, 1997; Singh et al., 2000a). The oscillations at the bottom of the USBPS create little “stubs” of enhanced potentials near the transition region of the PPD as seen from the top panels of Fig. 6; such stubs collect (attract) elec-trons from magnetic field-aligned volumes more efficiently than the neighboring regions with lower potentials. The
col-Fig. 10. x−Vz phase space of electrons over the height range
192<z<246 at t=5200. The red trace in the top panel shows the perturbations in the potential ϕ(x, z=224) showing the correlation in the positive perturbations in the negative background potential with the parallel acceleration of electrons forming filamentary elec-tron beams. Bunches of elecelec-trons labeled “b1” and “b2” refer to the
potential fingers “b1” and “b2” in Fig. 6.
lection (attraction) of electrons from the field-aligned vol-umes generates density depletions as well as “fingers” of hanced potentials extending along the field lines. The en-hanced potential perturbations rapidly propagate upward like a fast electron shock (Singh and Schunk, 1983). This pro-cess is illustrated schematically in Fig. 9; the influence of the positive portions of the oscillation at t=to is shown to advance to higher heights at later times t1 and t2, while the
negative portion remains stagnant. The transverse size of the fingers shown in this figure is typically half of the perpendic-ular wavelengths of the ion oscillations.
The rising potentials in the fingers accelerates electrons downward; Fig. 10 shows the phase space of electrons in the
x−Vz plane in the height range 192<z<256 at t=5200; we have also overlaid in this figure ϕ(x) at z=224. Figure 10 shows the preferential parallel acceleration of electrons in
z−Vz over the range of x with positive potential perturba-tions superimposed on the background negative potentials, creating filamentary electron beams in narrow channels. Two filamentary beams are labeled as b1and b2, and their
loca-tions in the USBPS at t =5200 are shown in Fig. 6.
The potential structure for t =5200 in Fig. 6 shows a nar-row filament of positive- potential perturbation (ϕ∼−10 to
−20) penetrating in to the region of higher (negative) back-ground potential of ϕ∼−30; the filament occupies the re-gion 525<x<580 and extends to z∼300 labeled as b1 in
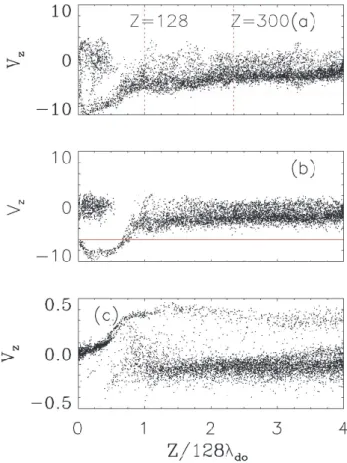
Fig. 6. In Fig. 11a we have plotted the z−Vz phase space of the electrons in this filament showing that they are accel-erated reaching an average velocity of −6 aeho before being further accelerated by the remaining parallel potential drop near the lower height z<128. For the purpose of compari-son Fig. 11b shows the same phase space in the same spa-tial region at t=5000 when the positive potenspa-tial perturbation did not exist, showing that the electron acceleration occurs mostly at the lower height. Figure 11c shows the z−Vzplot of the ions at t =5200 in the same spatial region as for the electrons in Fig. 11a. Note the presence of an up-going ion beam counter-streaming against the electrons accelerated in
Fig. 11. (a) z−Vz plot of a filamentary electron beam; the
elec-trons undergoing acceleration between 128 <z<300 are in the po-tential finger “b1” over the transverse width 525<×<580 at t=5200
in Fig. 6. Such electrons are further accelerated at a lower height,
z<128. (b) When there are no fingers in the USBPS at t=5000 (Fig. 6), electrons are accelerated only at the lower heights. (c) Ions associated with the filamentary electron beam in (a).
the narrow potential filament. The ions are seen accelerated in the parallel potential drop at the lower height where the electrons are accelerated at t =5000 (Fig. 11b). Since the ac-celerated ions move slowly, they interact with the rising po-tential and slow down at higher heights but the ion beam per-sists in the potential finger. We point out that such counter-streaming of electron and ion beams are not uncommon in the auroral plasma (McFadden et al., 1999; Pottelette et al., 2004).
Figure 12 is an extension of Fig. 6 showing evolution of the potential and density filaments over 5400≤t ≤5700. We find that by the time t∼5700, the entire length of the USPBS is deeply striated both in density and potential. Some of the large-amplitude positive potential pulses appearing in the fil-amentary structures are electron holes. We next discuss such nonlinear structures.
Fig. 12. Same as Fig. 6 but at later times as labeled on the top of
the panels: note the formation of long density striations by the time
t ∼5700; density depletions have higher potential than the density enhancements. The depletions have filamentary electron beams, which drive LH waves, which evolve into electron holes (Figs. 13– 16).
3.4 Lower Hybrid and Oblique-resonance-cone (ORC) waves, and electron holes
We find that the accelerated filamentary electron beams, like that shown in Figs. 10 and 11a generate waves above the lower hybrid (LH) frequency. The large-amplitude oscil-lations shown in the temporal variation of the potential in the top panels of Fig. 4 are primarily LH waves and their nonlinearly evolved waveforms. Figure 13a and b show the time history of E⊥and E|| at the point (512, 256) from R-2, respectively. The frequency spectra of the data on E⊥ and E|| are shown in Figs. 13c and d. Examining the plot for E||(t ), we note that parallel electric field in the PPD as a DL at the bottom of the USBPS passes this point at two occasions, first at t∼3800 during the first descent and then at t=7500 during the second descent. The passage of the DL as a large signature in E|| accompanies a weak signa-ture in E⊥; the interrelation between E|| and E⊥ in a DL as a part of a USBDL is discussed later. Before the pas-sage near t ∼3800, both E⊥ and E|| show large-amplitude fluctuations, a typical behavior of the high-potential plasma directly below the PPD. Soon after the passage, the point (512, 256) lies in the low-potential region above the PPD and the fluctuations become relatively much weaker. However, when the filamentation process begins developing fingers in the USBPS, the amplitude of the fluctuations first grows over 5000<t<6000 and then saturates as seen over the time in-terval 6000–7000. During the growth phase the dominant
Fig. 13. Temporal evolution :(a) E||(t ), (b) E⊥(t ). Fourier spectra: (c) E||(ω)and (d) E⊥(ω).
oscillations are the lower hybrid (LH) waves; the fre-quency of the initially growing oscillations is ω=0.055ω−po1. Figure 8 shows that during the time span from t =5000 to 5600, the local normalized plasma density at z∼256 is in the range 0.6–0.8 giving a lower hybrid frequency
ωlh=ωpi/(1+(ωpe/e)2)1/2=0.042ωpo−1, where ωpi and ωpe are the local ion and electron plasma frequencies, re-spectively. Thus the growing oscillation has a frequency just above the local lower hybrid frequency, specifically,
ω=1.3ωlh. Furthermore, we note that E|| E⊥ during the growth phase. Such oscillations belong to the oblique-resonance-cone (ORC) in the whistler frequency band. Fig-ure 13b further shows that the period of the oscillations pro-gressively increases; this is due to the depletion of the plasma density, forming a cavity (see Fig. 3). Furthermore, the oscil-lations seem to evolve into spiky bipolar pulses in E||(t )over the time span ∼6500–7000. The bipolar pulses are electron holes (see also Figs. 15 and 16). It is worth mentioning that it has been previously demonstrated that electron-beam-driven ORC waves do indeed evolve in electron holes (Singh et al., 2000b, 2001a,b; Singh, 2003). The formation of filamentary electron beams (Figs. 10 and 11) is conducive to the
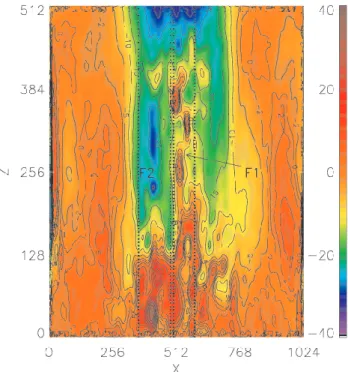
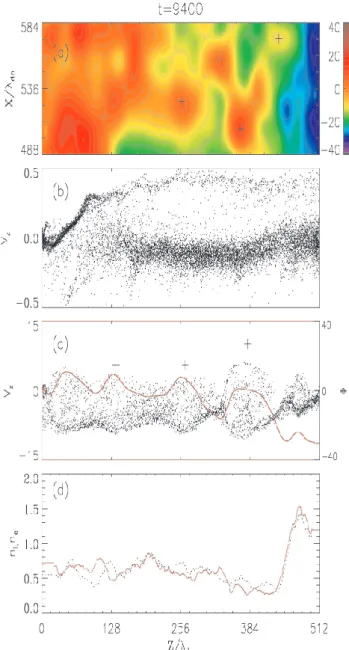
prefer-Fig. 14. (a) Potential structure at t=9400 showing a finger with
positive-potential perturbations and labeled as “F1”. The finger develops in the central region sandwiched between two negative-potential fingers (NPF) on the sides. The NPF on the left is labeled as “F2”. Note the three large-amplitude positive potential pulses in
“F1”; they are electron holes.
ential generation of ORC waves at relatively low frequencies above ωlhin the whistler branch (Singh et al., 1985). McFad-den et al. (1999) have reported that electron holes are com-mon in the UCR and they occur in association with narrow field-aligned electron beams. One-dimensional (1-D) sim-ulations driven by voltage drops and currents have also re-vealed formation of electron holes via electron-beam-driven beam-plasma modes (Omura et al., 1996; Singh, 2000, 2002; Newman et al., 2001; Goldman et al., 2003). Recent 1-D PIC simulations by Matsukiyo et al. (2004) revealed the genera-tion of coherent waveforms consisting of Langmuir, electron-acoustic and ion-electron-acoustic waves.
The LH waves and electron hole structures contribute to mask the filamentary behavior of the PS substructures in
ϕ(x, z). The LH turbulence heats the background electrons, which tend to leave the system contributing to the depletion of plasma in narrow channels. Since the ions lag in the de-pletion process owing to their heavier mass, the potentials in the lower portion of the filamentary DLs, where the electron heating occurs, rise rather rapidly. This is one of the reasons why the negative potential regions quickly recede to higher heights as seen from the plots for t=5000–6000 in Figs. 3, 6 and 12. The electron heating in the region of the raised potentials below the low potential region, aid in the deple-tion of ions causing the extended cavity formadeple-tion at t∼7000 (Fig. 3). This facilitates precipitation of hot ions with the accelerated electrons.
3.5 Frequency spectrum of the plasma turbulence
We have already discussed quite a bit about the temporal and spatial evolution of the fields and plasma in the simulations. We found that ion-beam driven ion modes play a crucial role in triggering the filamentation process as well as in the re-distribution of the PPD from low to high heights. When the filamentary structures form, the lower hybrid waves and electron holes become the important features of the electro-dynamics below the PPD. We highlight here the frequency spectrum of the plasma turbulence seen in the simulations. Figures 13c and d show the spectra of E⊥and E||, respec-tively. The two broken vertical lines indicate the ion cy-clotron (i)and the nominal lower hybrid (ωlh)frequencies; the latter changes with the plasma density when the plasma depletion creates the density cavity. Note the broadband na-ture of the turbulence both in E⊥ and E||. The power at frequencies below i is caused by the recurring redistribu-tion of the PPD from low to high heights. The spectrum of
E⊥ has equally strong distinct peaks at ω∼=i=0.0075ωpo and its second harmonic ω∼=2i=0.015ωpo. Both E⊥ and
E|| have peaks at ω=0.032ωpo; we interpret this frequency as the lower hybrid oscillations in deep density cavity over 600<t <7000 and therefore, it is lower than the nominal value of ωlh=ωlho=0.048ωpo. We have already discussed that the LH oscillations evolve into electron holes having bipolar structures in E|| as shown in Fig. 13b (also see Figs. 14–16).
3.6 Plasma and fields in the potential fingers
We have already discussed the plasma processes, which lead to the formation of density filaments and associated finger-like structures in ϕ(x, z) in a USBPS. The beginning of the formation of the filamentary density and potential structures and their further evolution were discussed earlier in con-nection with Figs. 6 and 12. We examine here the plasma and fields in fingers of both positive and negative poten-tials as substructures in the USBPS. Earlier in Figs. 2 and 3 we showed the evolution over the entire run time from this run. We also noted that a new cycle begins at about t =9000. Fig. 14 shows an example of the USBPS from the early part of this new cycle (t=9400) on an expanded horizontal scale, clearly revealing the details. The large negative potentials (∼−30) in the USBPS have receded to the top (z>450) in its central region (380<x<640) and smaller negative potentials,
∼−20 (green), descend down to low heights up to z∼128 on the sides, leaving in the middle a narrow positive-potential finger extending to heights above z∼450. The density struc-ture at t =9400 is not shown here, but it could be inferred from Fig. 3. There is a broad density cavity associated with the USBPS primarily confined to heights z<256, like that seen from the density plot for t =9000 in Fig. 3. The central positive potential finger has its own small-scale cavity, which extends to the top and joins a newly formed cavity in which the parallel potential drop occurs near the top (z∼450) in the central region of the USBPS. The persistence of this narrow
Fig. 15. Detailed features of F1shown in Fig. 14: (a) Potential structure with positive potential perturbations rising to large heights over the horizontal distance 488<x<536. Note the localized large-amplitude perturbations, which are electron holes as marked with + signs. The z−Vzphase space for (b) ions and (c) electrons lying
in F1; the red line curves show φ(x=512, z). (d) ni(x=512, z), in
dotted line and ne(x=512, z), in solid line. Note the presence of the
ion beam for z>128 even though the large negative potentials in the USBPS have receded to large heights. On the other hand, electrons are accelerated now near the top. Electron phase space shows vortex associated with the electron holes. Note the extended density cavity for z<470.
cavity can be seen from the density plot at t=10 000 in Fig. 3 (bottom panels). Thus at t=9400, there are three narrow U-shaped potential structures, the two on the sides extending down to low heights (z∼128) while the one in the central part of the USBPS is confined near the top (z>450) with a positive-potential finger (PPF) underneath.
Fig. 16. (a)–(d) Same as Figs. 15a–d but for the NPF (F2)
appear-ing over 360<x<599<x<749 in Fig. 14. Note that in this case the major acceleration of both electrons and ions occur at a lower height. (z∼128) A relatively weaker acceleration of electrons oc-curs at higher heights (z∼450) for x>388; the accelerated electrons generate electron holes as shown by the yellow patch near z∼384. The small blue patch in the height range 128<z<384 is an ion hole. In contrast to the finger F1, the cavity in finger F2 is limited to
z<256.
Figures 15a–d show the details in the structure in a nar-row part (488<x<584) of the central finger with positive-potential perturbations, labeled as F1 in Fig. 14: in pan-els from top to bottom we show (a) equi-potential structure, (b) ions z−Vz phase space, (c) electrons z−Vz space, (d) electron (ne(z), red line) and ion (ni(z), dotted line) den-sities along x=524. The red-line curve in (c) shows ϕ (z) along x=524.The equi-potentials showing large-amplitude positive-potential pulses in (a), the vortexes in the electron phase space in (c) and the potential plot ϕ(x=524, z), all
show that the F1 is dominated by electron-hole turbulence. This is what we also noted in Fig. 13 over the time span 6000–7000 when the USBPS underwent filamentation in an earlier cycle. Note that as soon as electrons are accelerated downward near z∼448 (near the top), electron holes begin to emerge. Figure 15b shows that ion beam is still persist-ing despite the raised potential in the fpersist-inger; this is simply due to the slow response of ions to the electric fields which evolve much faster at the electron time scale. Thus the ions accelerated at the earlier times in the USBPS persist despite the fast progression of the positive potentials to large heights. This produces counter-streaming of electron and ion beams as noted earlier in Fig. 11.
Figures 16a–d are like Figs. 15a–d, but for a finger with persisting negative-potentials occupying the horizontal dis-tance 360<x<500 and labeled as F2 in Fig. 14. The ϕ(z) plots in Figs. 16b and c as well as the density plots in Fig. 16d are along x=415. In this finger, electrons undergo a major downward acceleration near z∼128 (near the bottom), and a weak acceleration near z∼416 in the upper part of the fin-ger (x>390). Even below the region of the weak electron acceleration, electron holes are clearly seen as large-positive potential pulses; there is an electron hole as seen from the isolated vortex in the electron phase space (Fig. 16c) and a localized positive potential pulse at the same z in Fig. 16a as well as in ϕ(z) plotted in Figs. 16b and c: this electron hole is labeled as “EH”. We also highlight the ion hole appear-ing as a small blue patch in Fig. 16a; and labeled as “IH” it appears as a negative potential perturbation in ϕ(z) plot in Fig. 16b along with a vortex in the ion phase space. The up-ward ion acceleration near z∼128 is clearly seen in Fig. 16b. A ramp-like acceleration below z∼128 apparent in this figure is due to the earlier ion acceleration in the evolving USBPS. The large positive potentials below z∼128 seen in Figs. 15a and 16a are a consequence of plasma turbulence; electrons in this region are heated by the electron beam turbulence and they tend to exit from the bottom boundary. This creates a positive space charge raising the potential, which retards out-flux of electrons and enhances the downward out-out-flux of ions. Figure 16b shows that even the hot ions, which were previ-ously trapped by the parallel potential drop in the USBPS, are precipitating with the accelerated electrons. This down-ward precipitation of hot ions is the primary mechanism for the extension of the cavity to large heights during the process of the filamentation of the USBPS as shown in Fig. 3. 3.7 Parallel and perpendicular electric fields and density
cavities
In view of the recent reports of turbulent as well as quasi-static electric fields in density cavities measured from Po-lar (Hull et al., 2003; Mozer and Hull, 2001), we examine here the features of electric fields seen by a probe aboard a satellite if it were to traverse the potential structures shown in Fig. 3. The temporal evolution of the potential and den-sity structures including the filamentation suggests a variety of possibilities of such features, depending upon the height
Fig. 17. (a) The lower part of the potential structure at t=8600 (b)
ni(x), (c) E||(x)and (d) E⊥(x)along trajectory T1 shown in (a). (e)-(g) same as (b)-(d) but along trajectory T2. Note that the density
cavities with converging perpendicular fields point into the cavities and maximize near the edges.
and time of observation. We present two sets of examples, one dealing with a long USBPS stretching to low heights like that at t =5000 and the other when it receded to higher heights leaving a turbulent plasma underneath like that at
t=10 000. The situation at t =5000 is also repeated at t =8600; The Fig. 17a shows the bottom half of the USBPS at this time with two trajectories, T1 and T2, drawn in slant broken lines. Also plotted in this column is the shape of the plasma den-sity profile ni(z)along x=512, showing an extended density cavity. T1 is a steep trajectory and it enters and leaves the USBPS at quite different heights. Figs. 18b–d show the spa-tial structures in ni(x), E||(x), and E⊥(x)along T1, respec-tively, x being the projection of T1 on the horizontal axis. Note that; (i) T1 passes through a deep density cavity, (ii) in the cavity a strong unipolar E||(x)is seen while exiting the cavity at the lower height, and (iii) strong converging E⊥(x) exists with positive and negative polarities at left and right edges of the cavity. Such features of the potential structures in the upward current plasma are reported from Polar (Hull et al., 2003); Ergun et al. (2004) describe such structures as textbook examples. As a matter of fact such structures were reported from early 2-D simulations of Singh et al. (1987) and Winglee et al. (1988) in plasmas driven by current sheets. The trajectory T2 in Fig. 17a covers the bottom part of the USBPS and Figs. 17e–g show ni(x), E||(x), and E⊥(x), like for T1. Near the bottom the cavity is even deeper, E||(x) shows that the PPD is horizontally broad creating a strong unipolar parallel electric field in a strong DL. The E⊥(x)in Fig. 17g shows the converging fields concentrating near the left and right boundaries of the cavity.
Like Figs. 17 and 18 shows the features of ni(x), E||(x), and E⊥(x)along trajectories T3 and T4 in the upper half of the USBPS at t =10 000 as drawn in panel (a). The den-sity ni(z)along x=512, shown in panel (a), reveals an ex-tended cavity. Figure 18a shows filamentary structures in the USBPS, and they are reflected in the features of ni(x),
Fig. 18. (a) The upper part of the potential structure at (a) t=10000, (b) ni(x), (c) E||(x)and (d) E⊥(x)along trajectory T3 shown in
(a). (e)-(g) same as (b)-(d) but along trajectory T4. Although rel-atively weak, perpendicular electric fields pointing into the cavity occur near its edges while much stronger turbulent fields occur in-side.
E||(x), and E⊥(x)seen in Figs. 18b–d. Along T3 we find three narrow cavities (panel (b)), in which there are strong uni-polar E||(x) (panel (c)) and bipolar converging E⊥(x) (panel (d)). Thus the narrow structures are filamentary U-shaped DLs imbedded in a USBPS. In contrast to T3, the features of E||(x)and E⊥(x)along T4 are strongly affected by the plasma turbulence generated by the electron beams accelerated in the filamentary DLs at higher heights. A close scrutiny shows that large negative E||(x)in panel (f) belongs to an electron hole intersected by T4; the bipolar nature of the perpendicular electric field associated with the electron hole is clearly evident in panel (g). Note that turbulence occurs in a deep density cavity (panel (e)) and the converging electric fields, positive at the left and negative at the right boundaries of the cavity, are much weaker than the strong fields asso-ciated with the turbulence. The nature of the turbulence is discussed in detail in connection with Fig.13.
4 Discussion and comparison with observations
We found that a USBPS undergoes a transverse filamentation process when its parallel potential drop (PPD) in the form of a DL descends down to the heights where cold plasma dominates. The cold ion beam drives OIA waves trapped in a density cavity at the bottom of the USBPS. The potential perturbations associated with this instability trigger the fil-amentation. The relevance of the dynamical processes and their effects as seen in the simulations to auroral acceleration is discussed below.
Density cavities: Simulations show that density cavities are an integral part of the electrodynamics driven by a US-BPS. The cavities could be either broad or filamentary in their horizontal (latitudinal) structure depending on the phase of the dynamical evolution. Likewise, the cavity could be vertically either extended or confined to the region of the PPD. When the PPD is at large heights, underneath a deep
and extended cavity occurs. In the early stage of the ex-tended cavity formation, the hot plasma above the PPD, while at lower heights, is filamented resulting first into fil-amentary cavities and electron beams. The broad cavity is a direct consequence of plasma heating and acceleration by the plasma turbulence driven by such filamentary electron beams. The hot ions precipitate with the accelerated elec-trons as the plasma evacuation proceeds. In the past, such simultaneous precipitations of energetic ions and electrons have stirred controversy on the role of static parallel fields in auroral accelerations (Bryant et al., 1977). Our simulations show that the acceleration by static fields and simultaneous electron and ion precipitations are an integral part of the elec-trodynamics driven by a USBPS. A similar conclusion was drawn earlier from one-dimensional Vlasov simulations of DLs (Singh and Khazanov, 2003b). The broad cavity re-fills primarily from the top as the hot plasma expands into the cavity; the PPD in the form of a corrugated DL occurs in the density transition at the top of the cavity. When the broad cavity shrinks sufficiently in height by the expanding hot plasma from the top, it acts like a cavity resonator for the ion-beam driven OIA waves, which initiate the cyclic pro-cess of filamentation and redistribution of fields and density in the PS. The broad density cavities are bounded by inward pointing perpendicular electric fields.
Perpendicular scale lengths: The transverse size of the fila-mented density and the associated potential structures scales with the perpendicular wavelength, λ⊥, of the OIA mode and it turns out that λ⊥∼=2πρih, where ρihis the average Larmor radius of the hot ions. Observations from FAST and Polar cover the altitude range 3000–6000 km, over which ρihcould range over 0.2–2 km and λ⊥∼1–12 km for hot ion tempera-ture Tih∼1–10 keV. Thus, we suggest that the filamentation process found in the simulations might be the mechanism for generating 1–20 km substructures reported from Polar obser-vations (Mozer and Hull, 2001; Hull et al., 2003).
Time scale of the cyclic behavior: The cyclic behavior of the USBPS seen in the simulation involving the filamenta-tion and upward and downward mofilamenta-tion suggest considerable fluctuations not only in the electron and ion accelerations, but also in the shape, size and lifetime of the auroral density cavities and electric fields. Since the vertical extent of the acceleration region is not precisely known, it is difficult to conjecture the time scales of such fluctuations. However, if we assume that the acceleration region extends from 3000 km to 8000 km, the dominant period is estimated to be the time taken for the PPD to descend down from top to bottom over this altitude range. Taking the velocity of downward mo-tion to be the ion-acoustic speed, Cs, and the length of the acceleration region L||=1 RE, the time scale for the fluctua-tions is τ ∼L||/Cs. If we use Teh=1 keV and Tih=1–10 keV in Eq. (2), Cs=630–1760 km/s giving τ =3–10 s. It is inter-esting to note that Trondsen and Cogger (1997, 1998) have reported that the lifetime of forms in the auroral arcs are in the range of 1–10 s.
Scaling relations for double layers: Since the PPD occurs in a double layer, simulations have shown that the paral-lel width should scale as (Hubbard and Joyce, 1979; Singh, 1980).
`par∼6×(e|ϕo|/ kBTe)1/2λdo=4×(2e|ϕo|/me)/ωpe∝n −1/2
e
=1.5(ϕokv/ncm3)1/2km (3)
where neis the local electron density and ϕois the potential drop across the layer ( Singh, Khazanov 2005); ϕokvand ncm3 are |ϕo| and ne expressed in kV and in cm−3, respectively. The foregoing scaling simply suggests that the parallel width should scale with an effective Debye length determined by the local plasma density and energy of electrons accelerated by the potential drop supported by the parallel fields. The scaling in Eq. (3) can be used to derive an estimate for the average parallel electric field in a double layer, namely,
E||∼ϕo/`par=670 × (ϕokv)1/2×(ncm3)1/2mV /m (4) The double layers formed at the bottom of the USBPS in our simulations do obey the scaling shown in Eqs. (3) and (4). For example, Fig. 13 shows that a pulse of positive E|| passes through the point (512, 256) at t =3800 and again at
t=7500. The width of the pulses estimated from Eq. (1) is
`par∼60λdo including the effect of the local density; this gives an average E||∼30/60=0.5, which compares well with the amplitudes of the DL seen in Fig. 13. We point out that the above estimated width also compares well with the width estimated from the passage time multiplied by the downward velocity of the DL given in Eq. (2).
Pottelette at al. (2004) have reported identification of a narrow- in-altitude turbulent acceleration region with thick-ness of ∼10 km from FAST data. Hull et al. (2003) have estimated a similar thickness from Polar. In this narrow layer strong parallel electric fields occur, responsible for the auroral electron and ion accelerations. Let us see how such observations on the vertical width of E|| compares with the double layer scalings in Eqs. (3) and (4). Pot-telette et al. (2004) report that for the narrow acceleration layer, ϕo∼4 keV and ne=0.8 cm−3, for which Eq. (3) gives
`par=3.5 km against their estimate of ∼10 km for the vertical thickness of the layer. In view of the uncertainties in deter-mining the plasma density ne, the above comparison between the scaling derived from simulations and observations is fair. The scaling of E|| in Eq. (4) suggests that maximum value of parallel electric fields in the auroral plasma with densi-ties ∼1 cm−3 should be ∼700 mV/m for 1 keV parallel
po-tential drop. Mozer and Hull (2001) reported a maximum field of 750 mV/m. Verification of Eq. (4), namely, E||∝ (ϕokv)1/2x(ncm3)1/2, from satellite observations may prove invaluable in establishing the role of double layers in auroral acceleration
Plasma turbulence: The frequency spectrum of the wave turbulence in the cavities extends from below the ion-cyclotron frequency to LH and higher VLF frequency band. However, there are distinct peaks in the ion cyclotron, ion-acoustic and LH frequency ranges (Figs. 13c and d). These
features of the turbulence are seen in the data reported by Hull et al. (2003) and Pottelette et al. (2004). Both parallel and perpendicular fields at times show spiky features, but not in the region of the PPD, in which they appear as a broad or narrow quasi-steady structures depending on the trajectory of the traversal through the USBPS and the stage of its dynamic evolution.
Corrugated bottom of auroral potential structures: The bottom portion of the U-shaped potential structure is invari-ably found corrugated (Figs. 2–4, 7, 13), like that observed from Polar (Mozer and Hull, 2001) and FAST (McFadden at al., 1999). At times the corrugated structures are long form-ing thin fform-ingers (Figs. 15 and 16); Figs. 3, 6 and 12 show good examples of such fingers over the time span from 5000–6000 and 9000–10 000. We have shown here that corrugation (fil-amentation) are the results of ion-ion instabilities generating OIA waves trapped in a density cavity in the region of the PPD.
Motion of PPD: The upward and downward motions of the U-shaped double layers are relevant to the theory of gen-eration of auroral kilometric radiation. Such radiations have discrete frequencies, which often either increase or decrease systematically over extended periods of time (Pottelette et al., 2003). This behavior in the frequency drift is normally explained in terms of downward or upward motion of narrow potential structures with localized parallel potential drops. The electrons accelerated in such potential structures are the source for the generation of the radiations, which occur near the electron cyclotron frequency, e. The upward or down-ward motion of the potential structure cause the change in the magnetic field and hence in e. Simulations show that the upward and downward motions of potential structures with parallel fields are integral parts of the plasma electrodynam-ics in the upward current region of the auroral plasma.
5 Conclusions
By means of 2.5-D PIC simulations, we studied the dynami-cal behavior of the U-shaped broad DL (USBPS) with polar-ities and plasma populations relevant to the upward current region of the auroral plasma. Relevance of the dynamical be-havior to auroral acceleration in the upward current region is pointed out. However, we wish to point out that the study of the USBPS reported here has some limitations while be-ing applied to the auroral plasma. The major limitation is the size of the simulated plasma and also the properties of the hot and cold plasmas. The limited size ignores the diver-gence of the magnetic field and the associated mirror force. The assumption of equal plasma densities in the top and bot-tom reservoirs of the simulation limits the applicability to the potential structures at high altitudes in the upper part of the auroral density cavity where the ionospheric plasma den-sity is already severely eroded. Despite such limitations, the simulations do reveal the processes responsible for the (i) fil-amentation of the USBPS, (ii) cavity formation, (iii) trans-verse and parallel scale lengths of the auroral electric fields
and their strengths, (iv) formation of thin fingers in the PS and counter-streaming of electron and ion beams in them (v) corrugated bottoms of the USBPS and (vi) DL motion and cavity refilling. These dynamical features of USBPS are consequences of microphysical processes and interaction be-tween them; the sequence of processes seen are the formation of DL supporting PPD at low heights, acceleration of cold ions into a beam, generation of cavity ion modes by the beam when the cavity is sufficiently thin in height, filamentation of the USBPS, formation of filamentary electron beams gener-ating electrostatic whistler waves above the LH frequencies, transportation of the PPD to large heights, plasma heating and depletion below the PPD, cavity formation, downward motion of the PPD reaching heights where cold ions domi-nate. The acceleration of the cold ions forming a strong beam re-triggers the sequence of processes repeatedly.
Acknowledgements. This work was supported by NASA grant
NAG 512897 and NSF grant ATM0206669.
Edited by: P.-L. Sulem Reviewed by: two referees
References
Bryant, D. A., Hall, D. S., Lepine, D. R., and Mason, R. W. N.: Electrons and positive ions in auroral arcs, Nature, 266, 148– 149, 1977.
Ergun, R. E., Andersson, L., Main, D., Su, Y. J., et al.: Auroral particle acceleration by strong double layer: up-ward current region J. Geophys. Res., 109, 12 220–12 234, doi:10.1029/2004JA010545, 2004.
Ergun, R. E., Andersson, L., Main, D., Su, Y. J.: Parallel electric fields in the upward current region, of the aurora: Numerical sim-ulations, Phys. Plasmas, 9, 3695–3704, 2002.
Goldman, M. V., Newman, D. L., and Ergun, R. E.: Phase space holes due to electron and ion beams accelerated by a current-driven potential ramp, Nonlin. Processes Geophys., 10, 37–44, 2003, SRef-ID: 1607-7946/npg/2003-10-37.
Hubbard, R. F. and Joyce, G.: Simulation of auroral double layers, J. Geophys. Res., 84, 4297–4304, 1979
Hull, A. J., Bonnell, J. W., Mozer, F. S., and Scudder, J. D.: A statistical study of large-amplitude parallel electric fields in the upward current region of the auroral acceleration region, J. Geo-phys. Res., 108, 1007–1030, doi:10.1029/2001JA007540, 2003. Laframboise, J. G.: Current collection by a positively charged
spacecraft: Effects of its magnetic presheath, J. Geophys. Res., 102(A2), 2417–2432, 1997.
Matsukiyo, S., Treumann, R. A., and Scholer, M.: Coherent wave-forms in the auroral upward current region, J. Geophys. Res., 109, A06212, doi:10.1029/2004JA010477, 2004.
McFadden, J. P., Carlson, C. W., and Ergun, R. E.: Microstructure of the auroral acceleration region, J. Geophys. Res., 104, 14 453– 14 480, 1999.
Mozer, F. S. and Hull, A.: Origin and geometry of upward parallel electric fields in the auroral acceleration region, J. Geophys. Res., 106, 5763–5790, 2001.
Newman, D. L., Despa, O. M., and Meudon, F.: Formation of dou-ble layers and electron holes in current-driven space plasmas, Phys. Rev. Lett., 87, 25 500-1–25 501-4, 2001.
Omura, Y., Matsumoto, H., Miyake, T., and Kojima, H.: Electron beam instabilities as generation mechanism of electrostatic soli-tary waves in the magnetotail, J. Geophys. Res., 101, 2685–2698, 1996.
Pottelette, R., Treumann, R. A., and Georgescu, E.: Crossing a nar-row – in-altitude turbulent auroral acceleration region, Nonlin. Processes Geophys., 11, 197–204, 2000,
SRef-ID: 1607-7946/npg/2004-11-197.
Pottelette, R., Treumann, R. A., Berthomier, M., and Jaspesre, J.: Electrostatic shock properties inferred from AKR fine structures, Nonlin. Processes Geophys., 10, 87–92, 2003,
SRef-ID: 1607-7946/npg/2003-10-87.
Singh, N.: Computer experiment on the formation and dynamics of double layers, Plasma Phys., 22, 1–24, 1980.
Singh, N.: Electron holes as a common feature of double-layer-driven plasma waves, Geophys. R. L., 27, 927–930, 2000. Singh, N.: Temporal and spatial features of electron holes emerging
from double layers and their relevance to VLF saucers, Geophys. Res. Lett., 29, 1833–1837, 2002.
Singh, N.: Space-time evolution of electron-beam driven electron holes and their effects on the plasma, Nonlin. Processes Geo-phys., 10, 53–63, 2003,
SRef-ID: 1607-7946/npg/2003-10-53.
Singh, N., Conrad, J. R., and Schunk, R. W.: Electrostatic ion-cyclotron, beam plasma and lower hybrid waves excited by an electron beam, J. Geophys. Res., 90, 5159–5172, 1985. Singh, N. and G. Khazanov: Double Layers in Expanding Plasmas
and Their Relevance to the Auroral Plasma Processes, J. Geo-phys. Res., 108, 8007-COA 8-1, 8–16, 2003b.
Singh, N. and Khazanov, I.: Dynamical planar double layers: fila-mentary substructures, electron holes and ion heating, Geophys. R. L., 30, 2262–2266, 2003a.
Singh, N. and Khazanov, I.: Planar double layers in magnetized plasmas: fine structures and their consequences, J. Geophys. Res., 110, A04209, doi:10.1029/2004JA010620, 2005.
Singh, N., Leung, W. C., and Singh, G. M.: Enhanced current col-lection by a positively charged spacecraft, J. Geophys. Res., 105, 18 537–20 947, 2000a.
Singh, N., Loo, S. M., Wells, B. E., and Deverapalli, C.: Three-dimensional structures of electron holes driven by electron beams, Geophys. Res. Lett., 27, 2469–2472, 2000b.
Singh, N., Loo, S. M., and Earl Wells, B.: Electron hole as an an-tenna radiating plasma waves, Geophys. Res. Lett., 28, 1371– 1374, 2001a.
Singh, N., Loo, S. M., and Earl Wells, B.: Electron hole struc-ture depending on plasma magnetization, J. Geophys. Res., 106, 21 183–21 198, 2001b.
Singh, N. and Schunk, R. W.: Collisionless electron shocks in electron-beam plasma systems, Phys. Fluids, 26, 2781–2783, 1983.
Singh, N., Thiemann, H., and Schunk, R. W.: Simulation of auro-ral plasma processes: electric fields, waves and particles, Planet. Space Sci., 35, 353–395, 1987.
Trondsen, T. S. and Cogger, L. L.: A survey of small-scale spa-tially periodic distortions of auroral forms, J. Geophys. Res., 103, 9405, 1998.
Trondsen, T. S., Cogger, L. L., and Samson, J. C.: Asymmetric auroral arcs and inertial Alfven waves, J. Geophys. Res. Lett., 24, 2945–2948, 1997.
Winglee, R. M., Dusenbery, P. B., Pritchett, P. L., and Persoon, A. M.: Particle acceleration and wave emissions associated with the formation of auroral cavities and enhancements, J. Geophys. Res., 93, 14 567–14 590, 1988.