HAL Id: hal-02410291
https://hal.archives-ouvertes.fr/hal-02410291
Submitted on 28 Aug 2020
HAL is a multi-disciplinary open access
archive for the deposit and dissemination of
sci-entific research documents, whether they are
pub-lished or not. The documents may come from
teaching and research institutions in France or
abroad, or from public or private research centers.
L’archive ouverte pluridisciplinaire HAL, est
destinée au dépôt et à la diffusion de documents
scientifiques de niveau recherche, publiés ou non,
émanant des établissements d’enseignement et de
recherche français ou étrangers, des laboratoires
publics ou privés.
Distributed under a Creative Commons Attribution| 4.0 International License
Multidisciplinary study with quantitative analysis of
isotopic data for the assessment of recharge and
functioning of volcanic aquifers: Case of Bromo-Tengger
volcano, Indonesia
Alix Toulier, Benjamin Baud, Véronique de Montety, Patrick Lachassagne,
Véronique Léonardi, Séverin Pistre, Jean-Marie Dautria, Heru Hendrayana,
M. Haris Miftakhul Fajar, Azwar Satrya Muhammad, et al.
To cite this version:
Alix Toulier, Benjamin Baud, Véronique de Montety, Patrick Lachassagne, Véronique Léonardi, et al..
Multidisciplinary study with quantitative analysis of isotopic data for the assessment of recharge and
functioning of volcanic aquifers: Case of Bromo-Tengger volcano, Indonesia. Journal of Hydrology:
Regional Studies, Elsevier, 2019, 26, pp.100634. �10.1016/j.ejrh.2019.100634�. �hal-02410291�
Contents lists available atScienceDirect
Journal of Hydrology: Regional Studies
journal homepage:www.elsevier.com/locate/ejrh
Multidisciplinary study with quantitative analysis of isotopic data
for the assessment of recharge and functioning of volcanic aquifers:
Case of Bromo-Tengger volcano, Indonesia
Alix Toulier
a,*
, Benjamin Baud
a, Véronique de Montety
a, Patrick Lachassagne
d,
Véronique Leonardi
a, Séverin Pistre
a, Jean-Marie Dautria
b, Heru Hendrayana
c,
M. Haris Miftakhul Fajar
c, Azwar Satrya Muhammad
e, Olivier Beon
d, Hervé Jourde
aaHSM, Univ Montpellier, CNRS, IRD, Montpellier, France
bGéosciences Montpellier, Univ Montpellier, CNRS, Montpellier, France
cUniversitas Gadjah Mada, Geological Engineering Department, Yogyakarta, Indonesia
dWater Institute by Evian, Water Resources and Sustainability Division, Danone Waters, Evian-les-Bains, France
eDanone Aqua group, Department of Water Resources, Jakarta, Indonesia
A R T I C L E I N F O Keywords: Hydrogeology Volcanic aquifer Andesite Recharge Isotopes Hydrochemistry Quantitative analysis A B S T R A C T
Study region: The Bromo-Tengger volcanic aquifer system, (East Java, Indonesia).
Study focus: Andesitic volcanic aquifers in Indonesia are an important source of groundwater
supply for the population. The artesian flow from high discharge springs facilitates the access for irrigation and drinking water but continuously flowing artesian wells exert an increasing pressure on the groundwater resource. Given the complexity of the volcanic edifice, a multidisciplinary approach including geological, hydrometeorological, hydrochemical and isotopic measurements was performed to characterise the hydrogeological functioning of the volcano’s northern flank.
New hydrogeological insights for the region: Two main hydrogeological systems are identified: a
system with perched aquifers in the lava flows and pyroclastic complex, supplying low discharge springs or infiltrating to a deep flow system. The latter system is unconfined and provides groundwater to the downstream plain that hosts a confined multi-layer volcano-sedimentary aquifer. The joint implementation of a quantitative isotopic approach and a groundwater budget allows characterising aquifer recharge along the whole volcano flank. It is mainly con-trolled by the rainfall distribution that peaks around 1200 m elevation. The caldera basin on the top of the volcano has a very limited contribution to recharge. A conceptual hydrogeological model is proposed and compared to the main concepts of volcanic islands. This study is a first step for further scientific and management discussions to implement protection policies on the Bromo-Tengger aquifer system.
1. Introduction
Worldwide, insular volcanic aquifers are a serious asset for drinking water supply. In such environments, due to the growth of water needs, surface water resources are no longer sufficient, particularly during the dry season. In many cases, groundwater becomes an alternative resource to provide drinking water, such as on Hawaii in the Pacific ocean (Whittier et al., 2010), Jeju Island in Korea
https://doi.org/10.1016/j.ejrh.2019.100634
Received 13 April 2019; Received in revised form 9 October 2019; Accepted 11 October 2019 ⁎Corresponding author.
E-mail address:[email protected](A. Toulier).
Journal of Hydrology: Regional Studies 26 (2019) 100634
Available online 01 November 2019
2214-5818/ © 2019 Published by Elsevier B.V. This is an open access article under the CC BY-NC-ND license (http://creativecommons.org/licenses/BY-NC-ND/4.0/).
(Hamm et al., 2005), Martinique Island in the Caribbean Sea (Vittecoq et al., 2015) or the Canary Islands in the Atlantic ocean (Izquierdo, 2014).
The Indonesian Archipelago is located on the ring of fire (Pambudi, 2018) which is an area of intense seismic and volcanic activity including 400 andesitic volcanoes, of which about 70 are still active. Some of them are known for the emission of the most major Plinian eruptions already having upset global climate, such as the Mont Samalas (Guillet et al., 2017). In this region, volcanoes represent a concentration of significant hazards and natural livelihood for the population. The Mount Bromo-Tengger in the Eastern part of the Java island is one of the most visited andesitic volcanoes in the world (Bromo-Tengger Semeru national park, FAO 1982; Cochrane, 2006). More than a profitable touristic spot, the massif also provides a unique drinking water resource to the local population through groundwater.
Several volcanic springs discharging more than 1000 L s−1are known at the feet of the volcano and are used for irrigation and the population needs, since centuries to millennials. In particular, they partly supply the second biggest city of Indonesia (Surabaya; about 4 million inhabitants, 80 km north of the volcano) and other cities surrounding the volcano such as Probolinggo (east) and Malang (west). They also totally supply the city of Pasuruan (north). The artesian spring of Umbulan is the most important spring of the area, with a current discharge of about 3500 L s−1.
During the last few decades, and mainly since the 80′, hundreds of wells were drilled at the feet of the volcano, particularly for paddy fields irrigation. These continuously flowing artesian wells, with a discharge often higher than 15 L s−1, modify the hydro-geological functioning of the aquifer, as highlighted by the significant decrease of the major springs’ discharge. The knowledge of the structure, functioning and water budget of the whole hydrogeological system in this area is thus required to ensure the sustainable quantitative management of the aquifer and also to preserve groundwater quality.
The andesitic-type volcanism hydrogeology is much less studied than the basaltic one, and there is a need for the development of hydrogeological conceptual models. Two majors distinctions have been proposed in the literature to describe basaltic-type volcanism hydrogeological systems at the volcano/island scale: (1) the Hawaiian model and (2) the Canary Island model. The Hawaiian model describes a low-lying, basal aquifer with high-level water bodies perched on low permeability layers and impounded by dikes (Ingebritsen and Scholl, 1993). The Canary model describes a continuous aquifer that domes steeply inland, to high elevation, over a low permeability volcanic core (Custodio, 2007;Hemmings et al., 2015b). However, there is now a consensus on considering only one single conceptual model with differences depending on local circumstances and the effects of the volcanic deposits succession, erosion and reshaping due to major landslides (Custodio, Com. Pers.,Custodio, 2007;Herrera and Custodio, 2008). This single conceptual model considers only one main stratified and heterogeneous groundwater body through a combination of a central low permeability volcanic core with a dyke-intrusion network, a more permeable cover and a skirt (or apron) of very transmissive materials in periphery (Custodio, Com. Pers.,Custodio et al., 2016;Marrero-Diaz et al., 2015).
Some andesitic geological environments, such as pyroclastic formations, have locally been studied, e.g.Charlier et al. (2011)in the Caribbean orSelles et al. (2015)in Indonesia. However, the hydrogeological functioning of andesitic volcanoes, or composite shield volcanoes such as the Bromo-Tengger, are poorly known. Moreover, the proposed case study can also be considered as an example of the hydrological responses to changing conditions, due to anthropogenic forcings.
There is a real lack of knowledge regarding the hydrogeology of the Bromo-Tengger volcano. Previous studies mostly focused on the volcanology and seismics of the Mount Bromo and its caldera, and some others on the geological architecture of the volcanic edifice (Aiuppa et al., 2015;Bachri et al., 2015;Bani et al., 2013;Gottschämmer and Surono, 2000;Mulyadi, 1992;Van Gerven and Pichler, 1995;Zaennudin et al., 1994). The main aim of this study is thus to identify the structure and hydrogeological functioning of the northern flank of the Bromo-Tengger volcanic edifice. As required for a correct characterization of such complex hydrosystems, a pluridisciplinary approach see for instance (Dewandel et al., 2017; Maréchal et al., 2014; Pryet et al., 2012a, 2012b) has been implemented. Geological, hydroclimatic, hydrochemical and isotopic investigations allow the construction of a robust conceptual model of the Bromo Tengger volcano. In addition, it is also important to adapt existing methodologies, such as isotope hydrology, and to reinforce their robustness into this specific context of humid tropical climate with a wide range of elevations.
The present work is structured as follows. After this Introduction (Section1), the study area is presented in Section2. Section3 details the methodology which combines geological surveys, the implementation of a hydro-climatologic monitoring network, hy-drochemistry and isotopes analyses. Section4focus on the results and interpretations of the gathered data for a better understanding of groundwater circulation. Section5is devoted to a discussion about the interest of a quantitative isotopic modelling coupled with a hydrological water balance to identify the recharge area of the multilayer aquifer located at the basis of this andesitic volcano and to the set-up of its conceptual hydrogeological model.
2. Study area
The study area (Fig. 1) is approximately 1300 km², and covers the northern flank of the Bromo-Tengger volcano including the highest caldera (Tengger caldera), and the coastal plain of Pasuruan city. While only few springs exist in the southern part of the volcano, the northern part is of great hydrogeological interest due to the numerous high discharge water points (groundwater outflows) known in that area.
2.1. Geology
The Bromo-Tengger (BT) mountain is one of the many volcanic edifices in the eastern part of the Java island, Indonesia (Fig. 1a). It is a complex andesitic stratovolcano comprising, in its actual caldera, several cones such as the last active Mount Bromo (Fig. 1b).
The Bromo-Tengger is located in the Bromo-Tengger-Semeru national park and culminates at about 2700 m above sea level (m.a.s.l.). The inner caldera floor is at about 2100 m.a.s.l.
This volcanic massif began to grow about 1.4 million years ago as a result of the northwards subduction of the Indo-Australian plate beneath the Eurasian plate. This volcano is located in the back arc basin of the Sunda arc (Hamilton, 1988). The different eruptions of the Tengger are mainly classified as VEI 2 as regards the Volcanic Explosivity Index defined byNewhall and Self (1982), that comprises 8 classes. Over time, they produced a succession of a huge accumulation of lava flows and subordinate pyroclastic deposits which constitute the framework of the composite Bromo-Tengger volcano (Thouret, 1999). The recent collapse of the magmatic chamber created a large caldera, 16 km in diameter, with a large collapse in its North-East edge (Sapikerep valley). Widespread ash fall deposits covering the upper flanks of the Tengger are related to phreatomagmatic activity from the intra-caldera complex (Mulyadi, 1992). Erosion by streams forms numerous canyons with very steep slopes which extend radially from the caldera and the volcano slopes to the piedmont areas.
The peripheral zones of the volcano structure, and particularly the Pasuruan north plain, are constituted by volcano-sedimentary deposits (Quaternary in age) such as observed around most big stratovolcano volcanoes in Indonesia (Selles et al., 2015). The thickness of this filling is more than 300 m according to the stratigraphy proposed for the Lusi mud volcano (Mazzini et al., 2017)
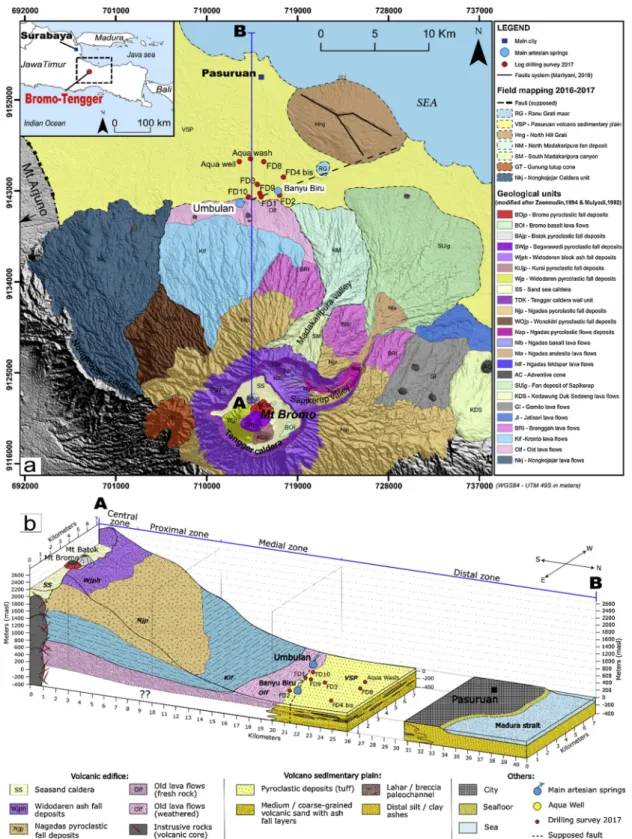
Fig. 1. a Relief map of the North-Eastern part of the Java Island (USGS SRTM30 dataset) with the location of the studied artesian springs, among
which Umbulan, and the main volcanoes active vents. The major active faults systems (Watukosek and Pasuruan) and the meteorological stations from BMKG are indicated, and completed by the satellite data provided by the Tropical Rainfall Measuring Mission (TRMM) (3b42v7; Zone: 25 x 25 km). b The Tengger caldera, seen from Mt Penanjakan at 2700masl. Mt Bromo still active on the left. c South-North view of the Umbulan artesian spring with the new adduction pipe that supplies the Surabaya city with drinking water (drone view). The main spring outflow is located in the southern part of the basin in the catchwork visible on the photo.
located about 40 km North from the Pasuruan plain (Fig. 1a).
This volcano-sedimentary series exhibits a South-North graded bedding. It comprises all the transition terms between proximal volcanic series, such as lava flows, pyroclastic falls and flows, lahars, reworked volcanic formations and more distal volcano-sedi-mentary deposits that are progressively more clayey towards the North. Fine clayey sediments constitute the first tens of meters below ground surface of this volcano-sedimentary series.
If many studies focused on the geology and geomorphology of the Tengger Caldera (Fig. 1b), there is still an important lack of knowledge concerning the fault system of the Tengger edifice and the detailed structure of the peripheral sectors such as the north Pasuruan plain. The major tectonic structures of East Java are normal (E–W) and strike-slip (NE-SW) faults, inherited from the subduction context (Marliyani, 2016;Susilohadi, 1995). Some authors describe the caldera structure and the caldera-bounding faults of different type of volcanoes (Cabusson, 2012;Cole et al., 2005). In particular, for the Tengger, the northeast margin of the Tengger caldera (Fig. 1a) is linear, suggesting a control by a NW-SE trending fault (Newhall and Dzurisin, 1988). Additionally,Neumann van Padang (1951)suggested the existence of two subtle alignments of vents within the caldera: NNE-SSW and E–W. No other fault system is described on the Tengger in the literature. However, the Watukosek fault system (Fig. 1a) associated to the Arjuno Welirang volcanic complex described byMoscariello et al (2017)could be extrapolated to similar regional NE-SW fault systems responsible of the alignment of the Semeru, Bromo and the piercement structure illustrated by the Ranu Grati maar in the Pasuruan plain. The North Pasuruan fault zone surveyed byMarliyani (2016)suggests that the Pasuruan plain is structured by a South-North graben.
2.2. Climate
According to Badan Meteorologi, Klimatologi dan Geofisika of Malang (BMKG, 2018), East Java is characterised by a humid tropical climate with two distinct seasons: a wet season from November to April and a dry season from May to October. The East Java mean annual rainfall is about 1500 mm at sea level, with about 140 rainy days a year (BPS-Statistics Indonesia, 2017). For the Bromo-Tengger area, the precipitation recorded for the 2008–2018 period is ranging from 1290 to 2400 mm year−1, respectively for the station 9 and 5 (BMKG, 2018), (Fig. 2a). The mean interannual precipitation estimated on the basis of 6 rain gauges (n° 1, 2, 4, 5, 6, 7;Fig. 1) regularly located on the northern flank of Bromo-Tengger is about 2000 mm year−1, with a maximum amount of rainfall from December to February (Fig. 2a, b). Unfortunately, BMKG data are not precise enough to map rainfall on the Tengger volcano because of numerous and long gaps observed in data for all rain gauges. In such steep topographic environment, the rainfall usually increases from the coastal low elevation areas to the inland highest areas, but also depends on the wind orientation. From the Surabaya and Malang stations data, the annual average wind direction is about N150° (NW-SE), with a mean velocity of about 5 km h−1and the annual average humidity is 76%. The 2008–2018 annual average temperature shows a minimum temperature of 18.3 °C for Malang (580 m.a.s.l.) and a maximum temperature of 32.1 °C for Surabaya (10 m.a.s.l.).
The mean interannual precipitation estimated by the TRMM satellite data (Kummerow et al., 1998) for the hydrological years 2000–2018 (Fig. 2c) is 2123 mm year−1. There is no significant precipitation trend observed during the last 18 years for annual rainfall as well as for rainfall during wet and dry seasons. The two last hydrological years (2017–2018) have rainfall very near the average, and can both be considered as representative “mean” hydrological years. In addition, the 2017 and 2018 rainfall amount measured during the rainy season is near the average rainfall amount of the rainy season.
2.3. Hydrogeology
In continental context, the structure of volcanic aquifers is mainly governed by the opposition between an impermeable sub-stratum (often non-volcanic), and overlying volcanic formations generally permeable (see for instanceBourlier et al. (2005) or Rouquet et al. (2012). In insular volcanic context, two main manifestations of a single conceptual hydrogeological model are de-scribed in the literature, at the volcanic edifice scale or even at the whole island scale: (1) a low-lying basal aquifer linked to inland dike-impounded and perched aquifers such as in the island of Oahu in Hawaii (Nichols et al., 1996;Peterson, 1972); (2) a continuous basal aquifer extending far inland and at rather high elevation which is well detailed in the Canary Islands (Custodio, 2007). These hydrogeological models were developed for basaltic volcanism (hot spots, transform faults, etc. geodynamical context) and are still improved by the hydrogeological community, especially regarding the key role of the volcanic core with dike network acting as barriers or as water conducting features through the fissures associated (Herrera and Custodio, 2008). Recent studies show a more complex reality, and the need for higher resolution hydrogeological studies, even in basaltic context (Join et al., 2005;Lachassagne et al., 2014).
Moreover, andesitic-type volcanism exhibits different hydrogeological patterns than the basaltic one and still need to be better characterized (Charlier et al., 2011;Hemmings et al., 2015b). In such andesitic context, the volcanic formations have often more various lithologies than in basaltic context, with lavas, but also pyroclastic formations, and volcano-detritic series, such as lahars and debris flows. For instance, the hydrogeological role of the extensive ignimbrite deposits frequently found in andesitic context is still poorly understood and may enable the presence of more than a single groundwater system. The andesitic volcanic formations are also often older, with several volcanic and erosion phases, and the associated weathering processes and paleosurfaces. It generates multiple superimposed or juxtaposed hydrogeological units with various hydrogeological relationships. Furthermore, the high relief of volcanoes favours erosion and the associated presence of deep canyons may also laterally limit the extension of the hydrogeological units. In the Merapi volcano (Indonesia), a dominant pyroclastic and volcano-detritic volcano, groundwater flow pathways are described to be related to the volcanic infilling of ancient paleovalley systems, locally comprising lava flows, which act as a pre-ferential underground drainage networks (Selles et al., 2015).
The volcanic context of the Tengger strato-volcano is rather different as lava flows (mainly basic andesite), extensively present on most of the northern slope, gradually disappear to the upper reach of the North plain, where the volcano-sedimentary series appear. Only a few gravity springs with discharge of a few L s−1are known on the flank of the volcano. In contrast, important artesian springs outflow from the upper part of the volcano-sedimentary series of the Northern Plain, such as Umbulan (Q≈ 3500 L s−1) and Banyu Biru (Q≈ 300 L s−1) springs, which are used for irrigation and drinking water supply in the Pasuruan plain (Fig. 1a). An artesian spring (or well) is defined as a groundwater outflow which occurs through some fissure or other opening features (lithological heterogeneity, fault, intrusive bodies, or drilling for a well) in the confining bed that overlies the confined aquifer (definititon modified fromUNESCO, 2012).
The plain is also characterized by hundreds of artesian wells drilled in the volcano-sedimentary formation, near or downstream the springs, for agricultural or domestic uses. Their depth varies between 30 and 120 m, and their discharge often reaches several L s−1. The geometry and lateral extent of the confining units responsible of artesianism are not known but some authors present the Pasuruan plain as an “extensive and productive aquifer system of moderate transmissivity and with piezometric head near or above
Fig. 2. a Mean interannual rainfall at 10 rainfall stations, as a function of their elevation (m.a.s.l.) (data from BMKG of Malang city); the location of
each rainfall station is reported onFig. 1a. b Mean monthly precipitation for the 10 rain gauges. c Normalised rainfall index (i) and annual cumulative rainfall from 2000 to 2017 hydrological years, estimated from theTRMM data (3b4v7, 2011). The index is given by the equation: i = (Pi – Pmean)/σ where Pi= annual cumulative rainfall, Pmean= mean interannual rainfall and σ = standard deviation of the total annual cumulate rainfall.
the land surface” (Soekardi Puspowardoyo, 1985).
There is no information about hydrothermal activity on the northern flank of the Bromo-Tengger. In addition, the water tem-perature measured in artesian wells of the volcano-sedimentary plain is about 23 °C which indicates a negative thermal anomaly in comparison with the local mean annual air temperature of about 30 °C. Then, the low temperature of the groundwater suggests a recharge at “high” elevation. The hydrogeological functioning of the 40 km2endorheic basin at the summit of the volcano (Tengger sea sand caldera) is also unknown.
3. Methodology
The comprehension of the structure and hydrogeological functioning of complex systems requires a multidisciplinary approach; in fact, each method provides some clues of the hydrosystem which can only be considered as reliable insights when they converge. Complementary methods were then applied: geological study, implementation of a hydro-climatologic monitoring network, hy-drochemistry and isotopes analyses. Results of these investigations and analyses, described here below, allow delineating the re-charge area and conceptualizing the aquifer structure and its functioning.
3.1. Geological study
A multi-scale geological field work has been conducted to gather complementary data.
- First, the main geomorphological structures of the Bromo-Tengger massif were characterized using Arcgis and Google Earth tools. An hill shade map of the SRTM30 m at a resolution of one arc-second (Farr et al., 2007) was elaborated and compared to the different existing geological maps (Mulyadi, 1992;Santosa et al., 1992;Zaennudin et al., 1994).
- Second, a 5 months geological fieldwork was performed to both observe lithological features in areas where information was missing, and verify geological descriptions and limits of the existing maps. On the northern flank of the volcano, this work was mainly carried out in canyons where most of the outcrops are located. Stratigraphic logs and geological data were collected from about 250 outcropping sites, then analyzed to corroborate and sometimes correct information from the existing geological maps. On the volcano sedimentary plain of Pasuruan, the existing geological description was completed by the geological logging of seven wells (34 to 103 m deep) on the basis of the cuttings and cores collected during drilling (AppendixFig. A1).
3.2. Monitoring network for recharge assessment 3.2.1. Hydro-climatological monitoring
The rainfall and temperature pattern of the Bromo volcano were characterized using 4 new meteorological stations (CIMEL RTU station) installed along a NorthSouth transect at different elevations: Kronto 535 m.a.s.l., Wonorejo 1158 m.a.s.l., Temple -2154 m.a.s.l. and Seruni - 2681 m.a.s.l. (Fig. 3).
Hourly temperature and rainfall measurements were recorded over one year from 1/04/2017 to 31/03/2018. This period is part of 2017 and 2018 hydrological years considered as mean hydrological years (see section2.2). Rainfall was collected for isotope analysis and cumulated rainfall assessment in a 200 L water tank, initially filled with 1 L of motor oil to avoid evaporation. The final volume of water in this tank was measured at the end of the monitoring period to check the good calibration of the CIMEL rain gauges. In addition, the Aqua Factory meteo station located in the Pasuruan plain (Aqua - 17 m.a.s.l.), that records daily rainfall, was also used.
A 5.8 km² representative surface watershed was monitored to estimate the water budget of the study area. This watershed ranges from 435 m.a.s.l. at the Kronto river gauging station to 2615 m.a.s.l. Stream water level was measured with a 0.5 cmH2O precision pressure probe, during the hydrological year stemming from 01/11/2017 to 31/10/2018. A rating curve was built using 5 manual discharge gaugings ranging between 2.5 and 60 L s−1, and completed by the discharge estimated during a peak flood (about 1500 L s−1) from a velocity estimate performed with a floating object (a bottle), and the known section of the stream.
Water points on the volcano flank and in the plain (springs, wells, dugwells) were inventoried and stored in a database. Discharge measurements of the main artesian springs and the artesian wells were also realized.
3.2.2. Analysis of climatic and hydrological data
The monitoring results were used to characterize the spatial rainfall and temperature distributions along the northern flank of the volcano.
Based on the Thornthwaite method (Thornthwaite, 1948), the aquifer recharge was computed as follows:
Re=R – (RET+Roff+ ΔS) = ER - Roff- ΔS (1)
where:
Re: recharge (mm) R: rainfall (mm)
RET: real evapotranspiration or also known as actual evapotranspiration (AET) (mm) Roff: runoff (mm)
ΔS: variation in soil moisture storage (mm) ER: effective rainfall (=R - RET) (mm)
The potential and the real evapotranspiration (PET and RET) were calculated for each meteorological stations at a Monthly time step, considering a 100 mm maximum soil moisture storage, initialized at 100 mm in April 2017 (end of the rainy season), (Ponce and Shetty, 1995). Then, effective rainfall (ER) was computed monthly as ER = R – RET.
The water budget parameters (R, RET, ΔS) come from the 01/04/2017 to 31/03/2018 monitoring period. The runoff was esti-mated from the Kronto watershed hydrological data (01/11/2017 to 31/10/2018). To compute average rainfall over this watershed, the weighted surface coefficient from Thiessen polygon is applied on the surface watershed with the data from the Kronto, Wonorejo and Seruni meteo stations with respectively 20, 62 and 18%.
The total recharge of the aquifer was inferred from its outflows from the main artesian springs and artesian wells and from leakage (estimated vertical groundwater flow through the Plain aquitard).
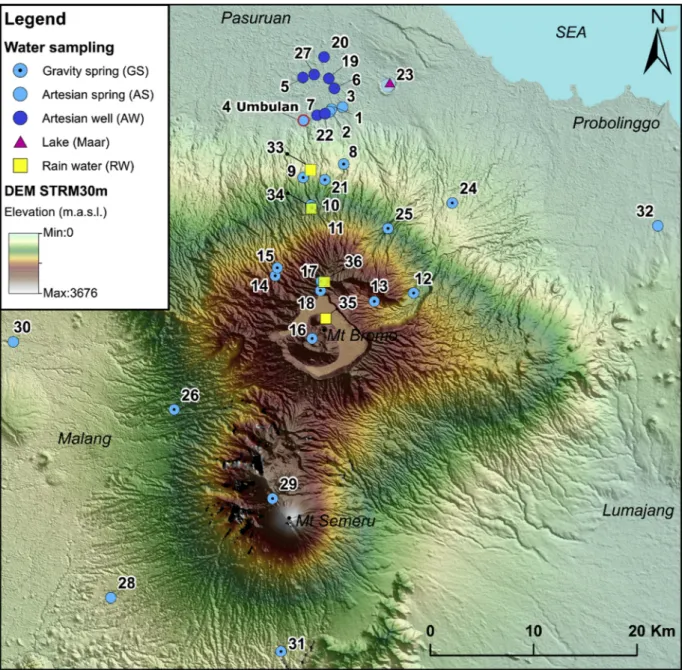
Fig. 3. Location of the sampling sites on the Bromo-Tengger-Semeru area plotted on a DEM (STRM30 m). The sampling points are divided in 5 types:
3.3. Hydrochemical and isotopic measurements
During 4 sampling campaigns including dry and wet season (May-June 2016, November 2016, May- June 2017 and March-June 2018), with sampling elevation ranging from 13 to 2700 masl, were collected:
- i) 31 groundwater samples (artesian wells, artesian and gravity springs), - ii) 1 surface water sample from a lake (Maar),
- iii) 4 rainwater samples from meteorological stations.
Details of the sampling points are given inTable 1and plotted inFig. 3.
On the northern flank of the Bromo-Tengger, the 17 groundwater samples were mainly collected from “gravity springs” such as inter lava flows springs. In the volcano sedimentary plain, the 14 water samples were collected from artesian springs and artesian wells. For each groundwater sample, physico-chemical measurements (Electrical Conductivity (EC), pH, Temperature, Dissolved Oxygen) were recorded in the field using a multiparameter probe HACH HQ40D and completed by spring/well discharge mea-surements.
Anion and alkalinity were collected in HDEP bottles of 10 ml and 50 ml respectively, and stored without air bubbles. Water isotopes were collected in 10 ml amber glass bottles also avoiding entrapped air bubbles. Samples for cation and traces analysis were collected in acid washed 20 ml vials and the samples were preserved by acidifying to pH 2 with concentrated trace grade HNO3−. Each vial was previously rinsed 3 times with the water being sampled. Anion, cation and trace elements were filtrated using a 022 μm Millipore filter. Samples were kept refrigerated prior to analyses.
Table 1
Hydrochemical and isotopic results. Samplings and water analyses were repeated for some locations (b and c letters). NA: not available; BDL: below detection limit.
Coordinates WGS1984 UTM Zone 49S
No. Water point name Type Location Long Lat Elevation Well depth Discharge (m) (m) (m.a.s.l.) (m) (L s−1)
1 Kali Sukun Artesian spring Sruwi 716014 9142825 26 – < 10
2 Telogo Artesian spring Sruwi 715819 9142568 31 – 10
3 Banyu Biru Artesian spring Banyu Biru 717071 9143017 33 – 380 4 Umbulan Artesian spring Umbulan 713303 9141735 33 – 3500 5 Aqua well Artesian well Keboncandi 713239 9145886 13 100 40 6 Bandaran well Artesian well Bandaran 716299 9144839 40 100 7.5 7 Small artesian well Sruwi Artesian well Sruwi 714614 9142240 50 NA < 0.01 8 Sumber Lumbang Gravity spring Cukurguling 717194 9137517 384 – 1 9 Sumber Gondang 1 Gravity spring Kronto 713273 9136210 551 – 2 10 Danyang (Wonorejo) Gravity spring Wonorejo 714011 9133531 1060 – < 0.5 *11 Sumber Tengah Gravity spring Wonorejo 714114 9133282 1144 – 0.1 12 Posong Tepis-Tesa Sapikerep Gravity spring Sapikerep valley 723956 9125054 1261 – < 1 13 Kendil Gravity spring Ngadas 720153 9124239 1753 – > 1 *14 Little-Spring-Tosari Gravity spring Tosari 710563 9126720 1810 – > 1 *15 Banyu Ngisor Gravity spring Wonokitri 710763 9127493 1860 – < 0.01 16 Widodaren Caldera Gravity spring Widodaren 714129 9120656 2200 – < 0.5 *17 Seruni Gravity spring Seruni 715008 9126199 2700 – < 1 18 Séruni 2 Gravity spring Cemoro Lawang 714943 9125300 2675 – 0.5 19 Borehole 7 Artesian well Gading 715751 9145789 22 80 12 20 Borehole 54 Artesian well Pandan Rejo 715293 9147863 18 125 4 21 Kali Pancur 3 Gravity spring Pancur 715374 9135997 672 – 1
22 FD1 Artesian well sruwi 715390 9142385 20 110 2
23 Ranu Grati Lake (Maar) Grati 721646 9145382 17 – NA
24 Tirtoageng Gravity spring Sapikerep valley 727707 9133759 356 – < 20 25 Madakaripura Gravity spring Sapikerep valley 721478 9131294 850 – 200 26 Sumber Pitu Gravity spring Malang 700778 9113788 870 – 1000 27 Community drill 96m Artesian well Winongan 714339 9146170 15 96 15 28 Umbulan Malang Artesian spring Malang 694643 9095612 465 – 100 29 Kalimati Gravity spring Kalimati 710306 9105189 2700 – 1 30 Wendit Malang Artesian spring Malang 684528 9120348 478 – 300 31 Coban sewu Gravity spring Lumajang 711117 9089737 526 – 100 32 Ranggojalu Artesian spring Probolinggo 747589 9131545 61 – 3200 33 Kronto station Rain water Kronto 713990 9136958 545 – – 34 Wonorejo station Rain water Wonorejo 714071 9133211 1158 – – 35 Temple station Rain water Caldera bromo 715445 9122585 2154 – – 36 Seruni station Rain water Seruni 715323 9126121 2681 – –
Table 2 Hydrochemical and isotopic results. Samplings and water analyses were repeated for some locations (b and c letters). (-): not available. No. Water point name Elevation (m.a.s.l.) Type Date pH EC (μS cm −1) T (°C) O2 (mg L −1) HCO 3 −(mg L -1) Ca 2+ Mg 2+ K + Na + Cl − SO4 2− NO 3 − Ionic Balance (%) δ 18O (‰) δD (‰) 1 Kali Sukun 26 AS 13/06/ 2016 7.0 264 24.0 6.5 135.9 24.0 12.1 2.7 7.5 2.5 3.0 2.4 4 −7.37 −44.2 2 Telogo 31 AS 13/06/ 2016 7.3 204 23.7 7.3 119.3 21.0 10.1 2.2 6.5 2.7 3.0 3.3 2 −7.46 −44.8 3 Banyu Biru 33 AS 13/06/ 2016 7.0 258 25.6 7.0 152.5 25.3 12.9 2.4 7.4 1.7 2.3 3.5 1 −7.08 −41.5 b 33 AS 23/11/ 2016 7.2 253 24.0 6.4 160.5 23.3 13.4 2.1 7.4 1.7 2.4 4.0 −3 −7.08 −40.7 c 33 AS 15/05/ 2017 6.4 257 23.8 6.4 153.6 23.1 13.4 2.4 7.5 2.1 2.3 3.6 −1 −7.14 −41.4 4 Umbulan 33 AS 11/05/ 2016 6.9 205 23.5 6.9 100.0 19.7 9.2 2.7 7.0 2.3 3.2 4.7 7 −7.32 −42.8 b 33 AS 23/11/ 2016 7.2 208 23.5 7.3 137.1 18.7 9.9 2.4 7.3 2.2 3.3 5.4 −7 −7.15 −42.2 c 33 AS 17/05/ 2017 6.9 217 23.4 6.9 122.6 19.7 10.0 2.7 7.4 2.5 3.1 5.1 −1 −7.28 −42.7 5 Aqua well 17 AW 15/05/ 2016 7.1 306 25.0 6.4 137.8 20.9 14.5 5.2 11.5 6.1 8.1 6.4 3 −6.96 −40.6 b 17 AW 23/11/ 2016 7.2 310 24.6 6.5 176.4 21.5 17.0 5.2 13.1 6.5 8.4 7.5 −3 −7.00 −39.9 c 17 AW 11/12/ 2017 7.1 316 24.9 6.4 162.7 22.1 14.6 5.4 12.0 7.0 7.7 7.0 −3 −6.96 −41.7 6 Bandaran well 17 AW 13/06/ 2016 6.9 230 24.8 8.0 131.3 17.6 12.2 4.8 10.7 3.0 4.3 3.8 2 −7.31 −43.3 7 Small art well Sruwi 17 AW 13/06/ 2016 7.0 203 25.0 7.2 121.5 22.2 10.6 2.1 6.8 2.3 2.8 3.4 4 −7.44 −43.8 8 Sumber Lumbang 384 GS 22/05/ 2016 7.8 148 25.1 7.8 97.6 13.9 5.3 0.3 5.9 1.1 1.8 6.9 −12 −6.93 −42.0 b 384 GS 24/11/ 2016 7.7 147 25.6 7.9 89.4 14.0 5.8 0.3 7.1 1.1 2.0 5.6 −4 −6.98 −39.6 9 Sumber Gondang 1 551 GS 11/06/ 2016 6.3 158 25.0 7.3 88.6 17.1 6.4 1.0 5.6 0.9 1.7 6.9 1 −7.18 −42.7 b 551 GS 24/11/ 2016 7.4 164 24.0 7.9 96.9 16.9 7.0 0.9 5.8 1.0 1.9 7.0 −2 −7.21 −41.9 10 Danyang (Wonorejo) 1060 GS 11/06/ 2016 6.6 192 22.2 7.6 55.9 22.6 6.4 0.8 4.9 10.0 2.1 24.2 7 −7.43 −44.1 (continued on next page )
Table 2 (continued ) No. Water point name Elevation (m.a.s.l.) Type Date pH EC (μS cm −1) T (°C) O2 (mg L −1) HCO 3 −(mg L -1) Ca 2+ Mg 2+ K + Na + Cl − SO4 2− NO 3 − Ionic Balance (%) δ 18O (‰) δD (‰) b 1060 GS 24/11/ 2016 7.4 173 22.0 7.6 62.5 17.5 6.1 0.6 4.8 10.0 2.1 24.4 −4 −7.44 −41.8 *11 Sumber Tengah 1144 GS 11/06/ 2016 6.6 132 22.2 7.5 31.2 13.1 5.8 0.4 3.3 9.8 1.1 24.7 3 −7.47 −45.8 b 1144 GS 24/11/ 2016 7.0 136 22.0 7.4 35.7 12.0 5.7 0.3 3.4 10.4 1.1 26.2 −4 −7.52 −44.1 12 Posong Tepis 1261 GS 07/06/ 2016 6.3 192 22.4 5.3 67.8 17.8 6.2 4.5 9.5 5.6 16.4 11.1 4 −7.26 −44.9 13 Kendil 1753 GS 10/06/ 2016 7.0 462 18.4 7.8 61.2 47.2 15.0 10.2 15.2 12.2 42.6 118.3 4 −8.17 −53.3 *14 Little-Spring-Tosari 1810 GS 06/06/ 2016 6.7 305 18.0 7.6 38.1 32.3 9.5 5.7 10.0 11.9 21.9 79.3 5 −8.58 −54.3 *15 Banyu Ngisor 1860 GS 06/06/ 2016 6.6 610 19.7 7.1 103.9 68.5 19.0 6.0 19.5 39.2 31.9 128.6 4 −8.85 −57.6 16 Widodaren Caldera 2200 GS 14/05/ 2016 5.6 671 17.9 7.0 7.4 69.7 16.9 11.6 23.8 104.4 138.6 0.0 2 −8.61 −55.8 *17 Seruni 2700 GS 14/05/ 2016 7.5 170 12.5 7.2 46.0 19.2 4.4 3.2 6.8 12.2 16.4 2.2 7 −10.49 −68.1 b 2700 GS 01/12/ 2016 7.0 170 12.6 7.3 19.9 17.2 4.3 2.7 6.5 18.1 23.3 11.4 2 −10.40 −66.7 18 Seruni 2 2675 GS 09/06/ 2016 6.7 275 15.7 7.1 33.4 28.8 8.0 3.4 9.7 24.6 55.8 0.5 4 −10.17 −66.9 19 Borehole 7 22 AW 27/06/ 2016 6.7 297 26.0 5.8 166.5 24.5 15.6 6.0 12.6 5.6 8.0 5.5 1 −7.00 −42.1 b 22 AW 23/11/ 2016 7.3 296 25.1 5.9 191.3 21.3 16.3 5.1 12.9 5.8 8.1 6.0 −7 −6.91 −39.7 20 Borehole 54 18 AW 27/06/ 2016 7.3 353 26.2 3.8 207.2 29.1 18.7 7.9 17.0 7.1 9.4 3.1 1 −7.15 −42.2 b 18 AW 23/11/ 2016 7.4 361 25.6 3.9 210.0 26.4 19.1 6.5 16.9 7.3 9.9 4.2 −2 −7.19 −40.6 21 Kali Pancur 3 672 GS 27/06/ 2016 6.0 109 24.6 2.9 61.2 12.2 3.5 0.9 4.5 0.6 1.4 1.5 2 −7.03 −42.4 22 FD1 20 AW 23/11/ 2016 7.5 212 24.8 7.5 139.6 20.7 10.6 1.8 6.7 1.6 2.3 4.3 −4 −7.35 −41.8 23 Ranu Grati 17 LAKE 18/05/ 2017 8.8 470 25.2 13.9 144.4 31.4 21.7 6.6 14.6 8.8 6.3 0.0 2 −4.96 −33.7 (continued on next page )
Table 2 (continued ) No. Water point name Elevation (m.a.s.l.) Type Date pH EC (μS cm −1) T (°C) O2 (mg L −1) HCO 3 −(mg L -1) Ca 2+ Mg 2+ K + Na + Cl − SO4 2− NO 3 − Ionic Balance (%) δ 18O (‰) δD (‰) 24 Tirtoageng 356 GS 27/04/ 2017 6.2 479 24.5 5.0 203.5 37.6 30.5 10.2 25.2 25.0 43.5 12.5 5 −7.83 −47.9 b 356 GS 19/05/ 2017 6.2 573 24.1 5.3 228.2 33.8 25.4 8.7 21.5 20.8 35.5 12.4 −4 −8.05 −51.0 25 Madakaripura 850 GS 19/05/ 2017 6.9 114 20.9 8.1 98.2 13.6 5.6 2.1 5.5 2.5 4.7 3.2 −12 −7.71 −46.3 26 Sumber Pitu 870 GS 12/06/ 2017 7.1 628 20.6 7.3 312.9 39.2 42.6 9.8 24.5 18.6 52.3 5.7 0 −8.95 −56.4 27 Community Drill 96m 15 AW 27/05/ 2017 7.0 304 24.7 6.1 148.8 21.6 16.4 5.6 12.7 6.3 8.0 5.6 4 −6.98 −40.2 b-78m 15 AW 22/05/ 2017 7.1 318 24.3 5.4 148.4 21.6 16.5 5.6 12.7 6.1 8.0 5.5 5 −7.08 −41.0 28 Umbulan Malang 465 AS 11/04/ 2017 6.7 200 20.9 7.1 105.1 15.9 8.2 3.4 12.0 8.1 9.3 4.0 −4 −7.50 −42.4 29 Kalimati 2700 GS 28/04/ 2017 6.6 – – – 71.5 9.9 3.0 2.6 6.7 1.5 3.3 0.8 −9 −10.83 −68.8 30 Wendit Malang 478 AS 11/04/ 2017 6.3 327 25.0 5.4 139.8 27.4 13.6 5.2 13.4 8.2 15.5 25.0 −1 −6.65 −39.5 31 Coban sewu 526 GS 11/04/ 2017 7.8 359 22.6 8.4 241.7 26.1 20.1 5.8 18.3 5.0 9.5 2.6 −6 −6.76 −39.1 32 Ranggojalu 61 AS 10/04/ 2017 6.8 381 26.5 6.1 215.3 29.9 17.7 5.7 18.1 12.7 5.4 6.5 −3 −6.55 −37.0 33 Kronto station 535 RAIN 27/03/ 2018 – – – – – – – – – – – – – −7.44 −45.6 34 Wonorejo station 1158 RAIN 27/03/ 2018 – – – – – – – – – – – – – −7.97 −48.1 35 Seruni Station 2681 RAIN 30/03/ 2018 – – – – – – – – – – – – – −11.83 −78.6 36 Temple station 2154 RAIN 30/03/ 2018 – – – – – – – – – – – – – −10.45 −70.1 *Gravity spring selected as integrative spring in order to define the BSWL.
Alkalinity was determined in the field by titration with HCL (0,1 M) using a manual Titrator Hach. The other analyses were performed in Hydrosciences laboratory, University of Montpellier. Anions were analyzed by ionic chromatography using a IC1000 Dionex. Cations and traces were analysed with an ICP-MS iCAP Q Thermo-Fisher. The analytical error for major elements is below 5% and below 0.1% for traces elements. Stable isotopes (δ18O, δD) were analysed at LAMA laboratory using an Isoprime mass spec-trometer with an accuracy of ± 0.08‰ for δ18O and of ± 0.8‰ for δD. The isotopic data are reported in the conventional delta (‰) notation as a deviation from the Vienna Standard Mean Ocean Water (VSMOW).
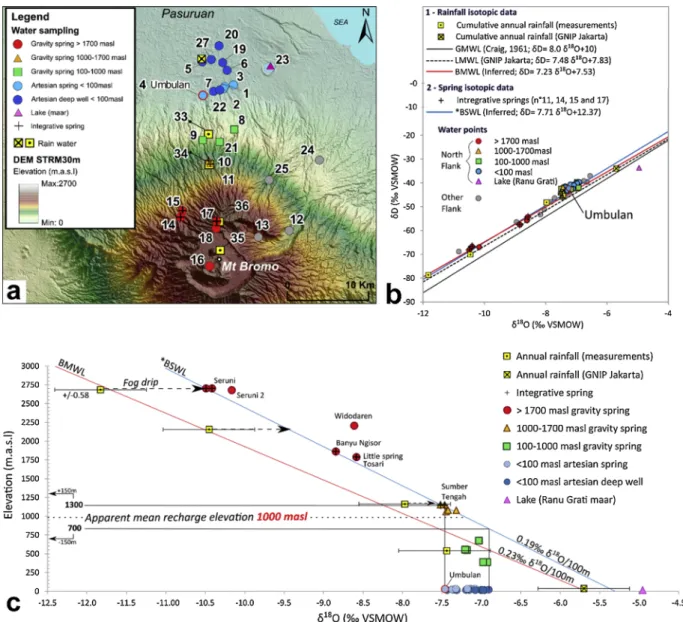
Comparison of the stable isotopic compositions of groundwater and rain water at different altitudes is defined as an efficient and approved scientific tools for evaluating recharge area from complex hydrogeological systems (Gat, 1996;Jones et al., 2000). This method has been successfully performed for many volcanic Islands (Heilweil et al., 2009;Hildenbrand et al., 2005;Prada et al., 2016). However, the monthly rainfall sampling required for establishing altitudinal isotopic gradient (Gonfiantini et al., 2001) is challenging to perform in volcanic regions with difficult access due to dense vegetation and high slope, and has some drawbacks.
As no local isotopic monitoring exists on the study area, we first determined an altitudinal gradient of water isotopes using small local springs (Q < 1 L s−1) called “integrative springs”, located along the northern flank of the volcano. These integrative springs are characterised by small watershed (< 0,5 km²) and short flowpaths between recharge and discharge locations. The geomorphology confirmed the limited extension of their watershed such as “Seruni” (n°17;Table 2) located in a small thalweg at less than 100 m from the volcano summit or “Little spring of Tosari” (n° 14;Table 2) located under a high cliff, and no relationship with stream water infiltrated upstream. In addition, these springs show significantly stable physicochemical parameters and water isotopes suggesting a local aquifer, nevertheless sufficiently developed to smooth rain events and seasonal variations. Local anthropogenic impacts or volcanic activity dry deposits influence some of these springs, in accordance with the land use of their inferred recharge area, also confirming a local recharge. This methodology has been successfully applied on volcanic context such as in Guatemala (Mulligan et al., 2011). The isotopic value of the integrative springs was used to calculate a local meteoric water line referred as the Bromo Spring Water Line (BSWL).
The stable isotopes of rain water were also sampled at the end of March 2018, after one full year of cumulated rainfall storage, at each meteorological station (Fig. 3and section3.2.1). These samples allowed to establish a local meteoric water line (BMWL, Bromo Meteoric Water Line) calculated as a first approximation with the PWLSR precipitation weighted method (Hughes and Crawford, 2012). Due to uncomplete rainfall collection at Aqua station, we estimated water isotope values in the plain using the GNIP station of Jakarta (IAEA, 1961) determined for the same coast and elevation than Aqua station (IAEA, 1962–1998; 8 m.a.s.l.; δD‰ = 7,47 δ18O + 7,99). The BMWL is then compared to the global meteoric water line (GMWL) defined byCraig (1961), (GMWL; δD‰ = 8 δ18O + 10) and validated by the local meteoric water line (LMWL) based on GNIP of Jakarta.
3.4. Quantitative estimation of stable isotopes signature for recharge area delineation
To delineate the recharge area of the aquifer, we assume that the isotopic signature of the main spring (Umbulan) is re-presentative of the isotopic signature of the “basal” volcano-sedimentary aquifer, which is confirmed by isotopic sampling in the plain. The methodology developed in this paper combines the use of:
A the stable isotopes data: outflow at the main spring on the one hand, and local meteoric water line built from the integrative springs (BSWL) on the other hand;
B the total groundwater outflow measured from the aquifer (see Section3.2.1.), and elevation-dependent groundwater recharge computation.
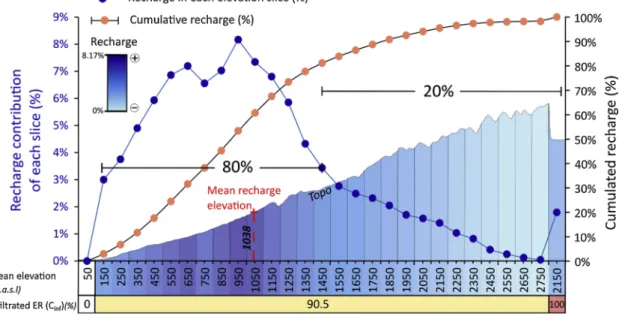
The interest of a 2D quantitative modeling developed in this paper, as compared with a simple 1D approach, allows (1) to take into account the conical shape of the volcano, and (2) to accordingly compute a recharge function (leading to the water budget) that depends not only on the elevation, but also on the shape of the volcano, which is a key point to constrain the results. These geometrical characteristics (shape) and recharge function (more precisely effective rainfall = f(elevation and shape of the volcano) are considered as fixed entry parameters, as well as the isotopic data. The infiltration rate on the contributing slices is also considered as a fixed parameter (based on hydrological measurements). Then, the only adjusted parameters are the contributing slices (which elevation for the recharge area), and the surface area of the whole recharge area. Geological and hydrogeological arguments are used to validate and ensure the reliability of the results.
Of course, such a methodology provides theoretically a non-unique solution. However, constraining a maximum of parameters from other independent methods/approaches, and using other information, such as geology and hydrogeology, helps identify the most probable one(s).
The methodology comprises 5 steps (Fig. 4).
STEPS 1–3 correspond to the preparation of the data base then of the model, STEPS 4 and 5 to its calibration to delineate the aquifer recharge area. Computations were performed with MSExcel.
- STEP 1: Discretisation of the maximum lateral and vertical extension of the potential recharge area of the aquifer: - dividing all the northern flank of the volcano into 100 m range of elevation “slices”.
=
n Slice i( )
i
( ) (2)
Where:
i = 0 to n, and each slice mean elevation is Mh(i).
(i) using morphological information to laterally (West-East) limit the extension of the recharge area.
This step enables to compute a first distribution of surface area for each slice, that may be refined later during the modeling process. The potential recharge surface area “Stotal” is computed as follows:
=
Stotal ( )i S i( ) (3)
Where:
S(i): the surface of slice i (km²) enabling aquifer recharge
- STEP2: Recharge was computed for each slice along the same range of elevation by interpolating the results (R, RET from water budget Section3.2.2obtained at the 5 meteorological stations of the northern flank of the volcano), and infiltration rate. The recharge of each slice Re i( )is given by:
= × ×
Re i( ) ER i( ) Cinf S i( ) (4)
from which the total estimated inflow to the aquifer is inferred:
=
Qtotal ( )i Re i( ) (5)
Where:
ER: the effective rainfall of the slice i (mm y−1)
Cinf: the coefficient of infiltration of the effective rainfall, initially fixed at 100% for each slice (%)
- STEP 3: the δ18O recharge signal for each slice was derived from the BSWL and used as an input in the model. The δ18O recharge signal for each slice 18Orec( )i is given by:
= = + ×
Orec( )i Orec(i 0) grad BSWL( /100 )m Mh i( )
18 18 (6)
Where: δ18O
rec(i = 0): δ18O input of the slice 0 m.a.s.l.
grad (BSWL/100 m): δ18O gradient (Bromo Spring Water Line, BSWL). Then, the δ18O contribution of each slice is given by:
= × O i Re i O i Q ( ) ( ) ( ) cont rec total 18 18 (7)
- STEP 4: First calibration phase of the model. Here, the objective is to define the elevation slices where recharge can occur with the objective to obtain the δ18O composition measured at the spring/aquifer. Calibration is performed first from the altitudinal distribution of Re imposed from STEP 2 and 3.
The computed δ18O composition of the aquifer ( O18 total) is calculated from:
= i
Ototal i Ocont( )
18
( ) 18 (8)
Based on geological or hydrogeological information (ex: low permeability layers, runoff, etc.), the coefficient of infiltration (Cinf) applied on each slice (see Eq.(4)) can be adjusted to fit with the observed δ18O composition of the aquifer/spring (A.).
- STEP 5: Second phase of the model calibration: calibration of the width of the total recharge area, and then of the total surface of the recharge area. The West-East width of the recharge area is adjusted to fit with the total outflow measured from the aquifer (B.).
The calibration process can be iterative, particularly between STEPS 4 and 5. Finally, sensitivity analyses are performed to estimate the accuracy of the calibration.
The outputs of this process are mainly the altitudinal and lateral delineation of the recharge area, and the spatial distribution of the recharge within this area.
4. Results and interpretations
4.1. Geological synthesis and hydrogeological implications
The existing geological maps (Mulyadi, 1992;Santosa et al., 1992;Zaennudin et al., 1994) have been compiled and completed with field observations (Fig. 5a).
The northern flank of the Bromo-Tengger volcanic edifice appear to be mostly composed of a thick series of calc-alkaline lava flows, mostly andesitic and unweathered. These formations outcrop in the medial zone, from 60 to 1500 m.a.s.l. (and are referenced as Olf, BRI, Klf, Nkj onFig. 5a). Some lava flows series are more than 50 m thick. Cooked paleosoils, locally covered by autobreccia of limited thickness (2–3 m max) are interstratified within the lava flows series. The upstream part of the volcano (current proximal zone), ranging from 1500 to 2700 m.a.s.l., is covered by pyroclastic materials (Wjph, Njp) mainly constituted from fall deposits (ash, lapilli) sometimes crisscrossed by lava flows. These fall deposits are unconsolidated and are deeply incised by canyons from the hydrographic network. A few slope deposits are identified at the outlet of some large valleys (Madakaripura and Sapiekerep); they are composed of lahars, pyroclastic flows and ignimbrites (Mulyadi, 1992) spread towards the North (SUig, NM).
In term of geomorphology, the volcanic edifice is scarred by 4 main super structures:
- the Sand sea caldera (SS) of the Bromo-Tengger summit with the Tengger caldera wall unit (TDK),
- the deep Sapikerep valley (Nap), located East of the volcano, related to the Bromo-Tengger caldera collapse, - the Madakaripura valley (SM, NM) due to the Ngadisari caldera collapse,
- the old caldera of Nongkojajar (Nkj) bordering the west side of the volcanic edifice.
Our observations enable to complete the geological map as follows, with the black dotted line units onFig. 5a: - the pyroclastic deposits ejected by the Ranu Grati maar explosions (RG) encircle this 120 m deep volcanic lake;
- the north hill of Pasuruan (Hng) is composed of pyroclastic deposits, lahars and possibly ignimbrites. This relief may be the distal part of the Sapikerep fan deposit (SUig);
- more than 100 m thick lahars deposits were mainly identified in the downstream part of the Madakaripura valley (SM and NM); - adventive cones (Cinder cones; AC) seem to correspond to the last lava outflows: Gunung Tinggi and Pandak, South-East of
Umbulan spring;
- the western limit of the “old lava flows” (Olf) has been extended, and is now in contact with the Nongkojajar unit (Nkj); - a SW-NE inferred fault may explain the artesian springs alignment (Umbulan, Banyu Biru, Telogo, Kali Sukun, respectively n°4, 2,
1, 3, onFig. 3) with the Ranu Grati Lake.
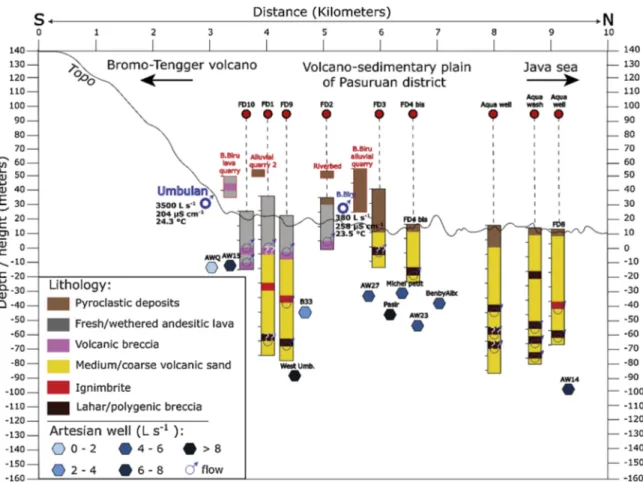
In the distal zone of the volcano (Pasuruan plain), 7 drillings (red dots onFig. 5b, Appendix Fig. A.1) enabled the identification of a superficial first unit, ranging from 0 to 30 m deep, mainly composed of weathered volcanic tuffs mixed with fluvial deposits characterized by their clayey and cinder matrix. Several cores at about 30 m deep were collected and show consolidated and clayey pyroclastic materials probably from lahars or ignimbrites deposits. The lateral variation of these materials is difficult to precise but the thickness of each unit is about 10 m. The clayey formations described in this first unit surely confine the underlying main aquifer. The second unit (top deeper than 30–40 m deep) is composed of reworked volcanoclastics (ash and lapilli materials) with ripples marks, intersected by paleochannels filled with alluvial, laharic and polygenic conglomerates mostly consolidated. This deep unit is probably contemporaneous and interstratified (at its southern limit) with the lava flows but, as these formations are difficult to drill
Fig. 5. a Geological map of the Northern flank of the Bromo Tengger, modified afterMulyadi (1992);Santosa et al. (1992);Zaennudin et al. (1994).
b Schematic geological cross section of the Northern flank of the Bromo Tengger from the Caldera summit (A) to the north coast of Pasuruan (B).
with the local engines, there is no drilling data in the transition zone. The volcano-sedimentary series thickness is still unknown but some deep artesian wells may be more than 200 m deep (from farmers oral testimonies). No artesian deep wells have been in-ventoried in the northern part of the plain (in the surroundings of the Pasuruan city). The distal zone of the stratovolcano is surely characterized by fine deltaic sediments, such as silts and clays, carried along the hydrographic network (Selles et al., 2015). This surely explains the northern ending-up of the aquifer.
4.1.1. Hydrogeological implications
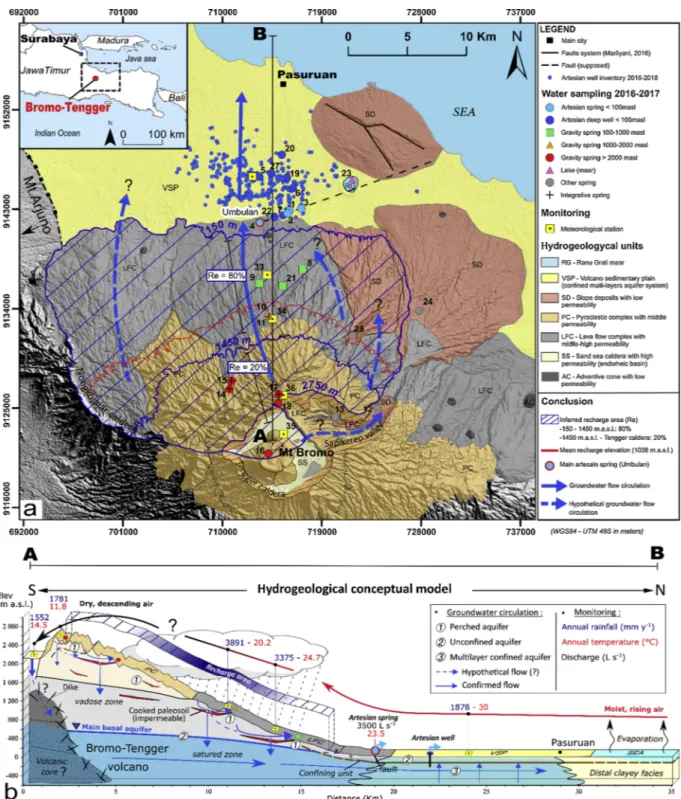
From this complex geological structure, we propose a simplified hydrogeological structure composed by 5 main hydrogeological units, from the volcano summit to the North coast:
- the central zone, constituted by the sand sea caldera (SS), is filled mostly by dark sand, with a high porosity. This large endorheic zone, with no permanent steam network, probably hosts an unconfined aquifer of unknown thickness, which outlets and re-lationships with other aquifers are unknown;
- in the proximal zone of the edifice, the thickness of the pyroclastic complex is difficult to estimate. However, the inner caldera rim outcrops (TDK) indicate that it could be several hundred meters thick. It may overlay the lava flows complex described just below. A few low discharge springs were identified in this formation, at the favour of layers of lower permeability (e.g. Seruni spring, Table 1). This formation apparently exhibits a high interstices porosity and permeability;
- the medial zone is occupied by the mostly unweathered lava flow complex (LFC, with chronologically Nkj, Olf, klf, BRI…). It constitutes a huge geological unit. Springs and rivers discharge observations show that, at the exception of the Olf lava flow unit, which exhibits a weathering profile, the LFC can be considered as homogeneous as a whole. This is demonstrated by the fact that only a few low discharge (a few L s−1) inter lava flows springs have been identified indicating few perched and local aquifers. Most of these inter lava springs flow out from clinker layers in contact with cooked paleosoils (red layers) acting as local im-permeable layers. Hydrogeological surveys along the streams during the dry season show their low specific discharge (as com-pared to the efficient rainfall), and no measurable discharge increase along the stream was observed. It suggests that, beyond these small springs, streams do not drain significant aquifers, nor loss significant amount of water, this later process being surely due to stream siltation. In addition, few adventives cones (AC) have been observed on the medial zone and may provide a laterally continuous, low permeability and high density materials, according toKereszturi and Nmeth (2012);
- In the distal zone of the volcano, the “slope deposits” (NM, SUig, Hng) most probably have a low permeability because of their clayey content;
- in the volcano-sedimentary plain (“distal zone”), the main hydrogeological feature is the confined aquifer which provides groundwater to the artesian springs and wells. According to the geological logs realized during the drilling survey, the confined aquifer is multi-layered. It is confined by a more than 10 m thick confining unit.
460 artesian wells were inventoried in the plain with an average discharge of 4.1 L s−1. Considering the density of well on the field (≈6 well km-2), we assume that 20% of the wells have not been inventoried. A maximum of about 600 wells is then estimated, corresponding to 2400 L s−1flowing out in the plain. All the artesian springs show a total discharge of about 4000 L s−1(Table 1). Assuming a mean hydraulic head difference of about 5 m between the multi-layered confined aquifer and the unconfined aquifer and a confining unit of about 10 m thickness with an hydraulic conductivity of 10-8m s−1(Breuer et al., 2000;Charlier et al., 2011), this gives a mean leakage of about 5 L s−1km2. For the whole volcano-sedimentary plain where artesianism is known (about 150 km2), it results in a discharge of about 750 L s−1due to “natural” leakage through the upper confining unit. The first estimation of the total outflow from the whole aquifer system would thus be about 7000 L s−1.
4.2. Hydro-climatological monitoring of the northern flank of the Bromo-Tengger
The new meteorological data are in agreement with the duration of the dry and wet seasons in this area: from May to October and from November to April, respectively (Fig. 6b). The minimum of the dry season occurred on August with only 3 mm of rainfall at the Temple station, and no rainfall at all at the other stations. The wet season peak occurred in February 2018 with a maximum rainfall value of 668 mm at Kronto. During both seasons, the Kronto and Wonorejo stations show higher rainfall than Aqua on one hand, but also than Seruni and Temple that are however at a higher elevation. On the basis of all data, 9 to 21% of annual rainfall occurs during the dry season while 79 to 91% of rainfall is recorded during the wet season.
An important altitudinal gradient of rainfall is observed on the volcano’s flank, from Aqua station (≈20 m.a.s.l.) in the plain, to Wonorejo station (≈1100 m.a.s.l.) with annual rainfall of 1878 mm and 3891 mm, respectively (Fig. 6c). Upstream, rainfall de-creases from Wonorejo to Seruni (≈2700 m.a.s.l.) and to Temple (≈2100 m.a.s.l.), with annual rainfall of 1781 and 1552 mm, respectively. Studies about altitudinal gradient of precipitation on high tropical or equatorial mountains also show a decrease of rainfall beyond a certain elevation, such as in Hawaii (Scholl et al., 1996,2002), or in the Martinique French West Indies island (Vittecoq et al., 2010). The air mass reaching the volcano’s summit are cooler, however they are impoverished in vapor. Based on these studies and our data, the most realistic precipitation pattern was drawn, with a peak at an elevation of about 1200 m a.s.l. (Fig. 7b).
An altitudinal gradient of temperature of about −0.6 °C/100 m was assessed, with a mean annual temperature of about 30 °C in the plain to 11.8 °C in the caldera, which is consistent with the known temperature gradient on volcanoes in such tropical en-vironment (Selles, 2014). No significant gradient is observed for the relative humidity, ranging from 75% in the plain to 83.3% in
Wonorejo station. However, cloud and fog accumulation are frequently observed below Seruni (2700 m.a.s.l.), indicating a con-densation layer below this elevation. The interception of wind-blown droplets of water by the vegetation, commonly called cloud water interception (CWI), or fog drip, is likely to increase rainfall height. In the Santa Cruz Island of the Galapagos (Ecuador), the fog drip is negligible at 400 m.a.s.l., but represents more than 20% of incident rainfall at about 650 m.a.s.l. and directly contributes to groundwater recharge (Pryet et al., 2012a,b). This parameter can thus be a significative part of the recharge, as also identified on La Gomera (Canary Island) where it represents more than 700 mm y−1according to the fog drip calculation models (Izquierdo, 2014). On the Bromo-Tengger, except some field observations, there is no measurement allowing to quantify fog drip.
As a summary, these first results indicate a precipitation pattern controlled by orographic effects occurring on the Northern flank of the volcano, under the influence of the dominant NW-SE winds. The rainfall thus increases to a maximum value at about 1200 m.a.s.l. elevation and decreases beyond.
4.2.1. Results of the climatic and hydrological analyses
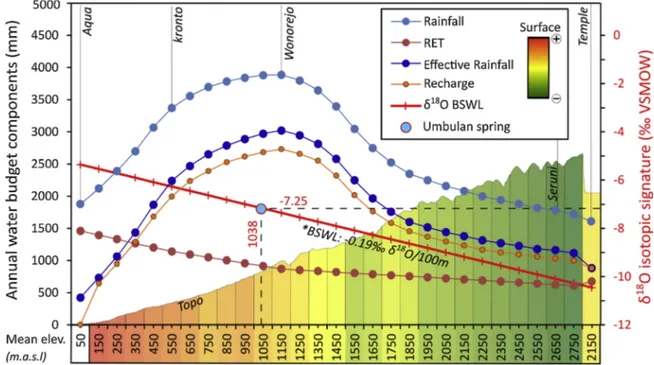
The computation of the water budget at each meteorological station allows to plot the Rainfall, RET and ER as function of the elevation (Fig. 7a, b, c). From April 2017 to March 2018, the recharge rate was also estimated on the representative Kronto watershed (Fig. 7a). All results are compiled in the table fromFig. 7c.
- PET & RET: similarly to the temperature, the potential evapotranspiration (PET) and the real evapotranspiration (RET) con-tinually decrease from the plain to the volcano summit with, for example, a RET of about 1460 mm in the Pasuruan plain, and about 620 mm at Seruni. These RET results are consistent with the GLEAM satellite data (Martens et al., 2017) with a difference of less than 6% (Fig. 1) (1153 mm y−1for the mean GLEAM interannual RET from November 1980 to October 2017 and 1223 mm computed on our site for April 2017 to March 2018).
The effective rainfall (ER) is very concomitant with the rainfall (R) variation because of the RET absolute value (much lower than R, at the exception of the lower part of the volcano) and the RET distribution along the flank of the volcano. Nevertheless, the “impact” of RET is maximum at low elevation where ER is finally rather low (about 600 mm at an elevation of 50 m.a.s.l.). Then, ER increases steeply, to reach a maximum of 3100 mm also at about 1200 m.a.s.l. At higher elevation, ER steeply decreases with 1300 mm only on the top of the volcano’s flank and 900 mm in the inner caldera.
- Re: during the period Nov-17 to Oct-18, the discharge of the Kronto representative watershed is only about 7% of the rainfall (9.5% of the effective rainfall). These data suggest that aquifer recharge is about 66% of the rainfall, and about 90.5% of the effective
Fig. 6. a Monthly rainfall monitored at the 5 meteorological stations installed during this research along the Northern flank of Bromo-Tengger. b
Annual rainfall, mean annual temperature and relative humidity for each meteorological station. The Aqua temperature and humidity have been inferred from the temperature altitudinal gradient from April 2017 to April 2018 with the following equation: y = -2904 ln(x) + 9876.1 and from humidity data of Malang and Surabaya stations fromBMKG, 2018. Right: location map of rain gauges (For interpretation of the references to colour in this figure legend, the reader is referred to the web version of this article).
rainfall (Fig. 7c). This result is consistent with the geological observations (cf. section4.1) that did not identify impermeable rocks on this experimental watershed, nor on the whole flank of the Bromo volcano. Similar results were found in tropical and andesitic (pyroclastics) context in Guadeloupe (French West Indies) where the aquifer recharge was estimated at about 85% of the annual effective rainfall (Charlier et al., 2011). This recharge rate is an average infiltration rate on the whole representative watershed (450–2600 m.a.s.l.) as the hydrological and hydrogeological field observations did not enable to identify any preferential recharge area.
4.3. Hydrochemistry
Field parameters and laboratory analyses, including major ions and stable isotopes (δ18O, δD) of groundwater samples from gravity springs, artesian springs and artesian wells are reported onTables 1 and 2and their location is plotted onFig. 3.
Electrical conductivity (EC) of groundwater ranges from 109 to 671 μS cm−1. In the plain, artesian wells and springs show relatively homogeneous conductivity values (ranging from 202 to 353 μS cm−1and 203 to 381 μS cm−1respectively). Gravity springs located on the flank of the volcano show a large range of conductivity (from 109 to 671 μS cm−1) and the highest values but no correlation was found between the conductivity and the location of the spring as high conductivity is mostly linked to anthro-pogenic impacts on each small watershed. In contrast, an increase of conductivity towards the North was found for artesian springs and wells located in the plain due to water-rock interactions.
The mean temperature of the water samples is 22.6 °C ± 3.6 °C. Groundwater temperature is well correlated with the elevation of the spring. The water temperature increases as the elevation decreases, with a minimal temperature of 12.5 °C at 2700 m.a.s.l. (Seruni
Fig. 7. a Location map of the Kronto river representative watershed and the monitoring network. b water budget parameter. c Tables of results: 1)
spring, n°17) and a maximal temperature of 26.2 °C in the plain for the deep artesian well 20 (150 m deep). The main spring of the system, Umbulan, has an intermediate temperature of 23.5 °C. Temperatures of the artesian wells and springs in the plain are not at the equilibrium with the mean local air temperature (about 30 °C) indicating a recharge at a higher elevation.
For all groundwater samples, dominant cations are Ca and Mg (Fig. 8a,Table 2), in good agreement with the andesitic bedrock composition. Three dominant anions (HCO3−, SO42-, Cl−) were found depending on the groundwater samples. Based on the dominant anions and the relative Ca vs Mg concentration of water, three groups of groundwater were identified. They are also related to various elevations (Fig. 8a):
- In the plain, water samples of artesian springs and wells are dominated by CaMg−HCO3- water type (Fig. 8a).
- On the flank of the volcano, gravity springs located higher than 1000 m.a.s.l. (Volcanic & anthropogenic group;Fig. 8a) belong to CaMg-Cl or CaMg-SO4water type. The high values of Cl−and NO3−occur in the vicinity of villages or crop fields and indicate anthropic contaminations (e.g. Banyu Ngisor n°15,Table 2). The highest SO42-contents were found in springs close to the top of the volcano at elevation ranging between 1700 and 2700 m.a.s.l. where volcanic sulphur deposits occur. They indicate the influence of the volcanic activity (e.g. Widodaren, n°16).
- A last group show an intermediate composition between the volcanic-anthropogenic type and the main basal aquifer type. Groundwater samples from intermediate and artesian plain groups show a continuous geochemical evolution through an increase of Ca/Mg towards the North (Fig. 8b), with the distance from the volcano. The conductivity increase and Mg2+enrichment in the volcano-sedimentary plain, may result from an increase of residence time triggered by an intensive water-rock interaction with clayey formations (Paternoster et al., 2010). The weathering of the volcano-sedimentary formations allows the dissolution of Mg -rich minerals like Olivine ((Mg,Fe)2SiO4) and Pyroxene (X+Y−(SiO3)2). This dissolution together with the North-South groundwater flow direction explains the Mg+trend observed on artesian wells towards the North (Fig. 8b). This relatively linear Mg enrichment for these 2 groups is well correlated with the electric conductivity and water temperature increases. This spatial evolution of water chemistry suggests that gravity springs at low elevation and artesian wells/springs belong to the same lithological and hydro-geological system with groundwater aging as it flows towards the North. Gravity springs result from perched aquifers. Direct re-charge, leaking water from these perched aquifers and surface water directly infiltrating to the main basal aquifer supply the multi-layered aquifer feeding the artesian springs and wells. As a consequence, common recharge processes can be considered for the artesian springs/wells and gravity springs of low elevation. The gravity springs above 1700 m.a.s.l. do not exactly show the same evolution as they are also influenced by different processes, and notably deposits issuing from the active volcanic vents. Regarding the Ca2+increase observed on these springs, it may correspond to water rock interaction at the surface of clay-minerals within the pyroclastic complex.
No anthropogenic and volcanic chemical components are significantly observed in the plain system. This suggest a limited contribution from the highest part of the volcano to the recharge of the main basal aquifer (SO4) and confirm the limited extension of agricultural activities compared to the total recharge area of the aquifer (dilution effect).
Two wells (n°7 and 22) follow the same Ca/Mg ratio trend. They are located between Umbulan and Banyu Biru springs and aligned on the supposed SW-NE fault (Fig. 5) which could explain a shorter transit time led by this fault.
The Ranu Grati maar could be a natural outflow from the same type of aquifer(s), at least as regards lithology, but with longer water/rock interactions.
4.4. Isotopic composition of groundwater and rainfall
Water isotopes signatures of groundwater, surface water and precipitation are reported in theTable 2and plotted inFig. 9a. The four rain gauges, from 545 to 2681 m.a.s.l., have sampled one full year of annual cumulated rainfall (April 1st2017 – March 2018). They show a large range of variation from -7.5 to -11.8‰ for δ18O and from -45.8 to -78.6‰ for δD. The observed δ18O altitude gradient for rainfall is consistent with to a Rayleigh adiabatic condensation process. The isotopic signature of groundwater samples (Fig. 9b) shows a similar range of variation (-6.6 to -10.8‰ for δ18O and from -37 to -68.8‰ for δD), for an elevation of sampling locations ranging from about 20 to 2700 m.a.s.l. In the main artesian system of the plain (springs and wells), the range of variation is narrower with variations ranging from -6.91 to -7.46‰ for δ18O and from -39.70 to -44.75‰ for δD, strongly suggesting a common recharge area. The surface water sample (Ranu Grati lake, n° 23), shows the lowest δ18O value and the highest δD (-4.9 and -33.7‰ respectively).
Most of the groundwater samples align above the global meteoric water line (GMWL) and the local meteoric water line (LMWL) calculated from the GNIP station of Jakarta (IAEA, 1961). These results show that rainwater composition undergoes the local to-pographic effects of the volcano. The sample from surface water (Ranu Grati Lake) falls below the LMWL (Fig. 9b). This position indicates an evaporation process in good agreement with the stagnation of the lake water and the high temperature in the plain (about 30 °C).
To take into account the local topographic effect on rainwater, the Bromo meteoric water line was calculated (BMWL;Fig. 9b) from the four rain gauges of the area and the GNIP station of Jakarta (with weighted mean respectively -5.63 and -36.10‰ for δ18O
![Fig. 8. a Piper diagram of major ions analysed in springs, wells and lake. b binary plot [Ca 2+ ] vs [Mg 2+ ] for same groundwater samples.](https://thumb-eu.123doks.com/thumbv2/123doknet/14792345.601951/20.816.69.749.90.385/piper-diagram-major-analysed-springs-binary-groundwater-samples.webp)