HAL Id: hal-01267943
https://hal.archives-ouvertes.fr/hal-01267943
Submitted on 19 Jun 2020HAL is a multi-disciplinary open access archive for the deposit and dissemination of sci-entific research documents, whether they are pub-lished or not. The documents may come from teaching and research institutions in France or abroad, or from public or private research centers.
L’archive ouverte pluridisciplinaire HAL, est destinée au dépôt et à la diffusion de documents scientifiques de niveau recherche, publiés ou non, émanant des établissements d’enseignement et de recherche français ou étrangers, des laboratoires publics ou privés.
Phenotyping the response of an apple tree hybrid
population to soil water constraint under field
conditions: new insights brought by high resolution
imaging
Nicolas Virlet, Valentine Lebourgeois, Sébastien Martinez, Sylvain Labbé,
Evelyne Costes, Jean-Luc Regnard
To cite this version:
Nicolas Virlet, Valentine Lebourgeois, Sébastien Martinez, Sylvain Labbé, Evelyne Costes, et al.. Phenotyping the response of an apple tree hybrid population to soil water constraint under field conditions: new insights brought by high resolution imaging. 2. Symposium on Horticulture in Europe, Université de Liège (ULiège). BEL., Jul 2012, Angers, France. �10.17660/ActaHortic.2015.1099.112�. �hal-01267943�
Phenotyping the Response of an Apple Tree Hybrid Population to Soil
Water Constraint under Field Conditions: New Insights Brought by
High Resolution Imaging
N. Virlet1, V. Lebourgeois2, S. Martinez1, S. Labbe3, E. Costes1 and J.L. Regnard1
1
UMR AGAP 1334, CIRAD, TA-A-108/03, Avenue Agropolis, Montpellier Cedex 5, F-34398, France
2
CIRAD - UMR TETIS, Station Ligne-Paradis, 7 chemin de l’IRAT, Saint-Pierre, F-97410, France
3
IRSTEA - UMRTETIS, Remote Sensing Center, 500 rue J.F. Breton, Montpellier Cedex 5, F-34093, France
Keywords: Malus × domestica, water use efficiency, image analysis, abiotic stress,
remote sensing, thermal infrared
Abstract
The genetic variability of apple tree response to drought is scarcely known because characterization of response to water constraint is usually low-throughput, which limits the possibility to take this trait into account in breeding programmes. In this research phenotypic response of apple tree scion hybrids of a ‘Starkrimson’ × ‘Granny Smith’ adult population to soil drought was considered through the leaf temperature as a proxy for transpiration, each tree being grafted onto the same rootstock genotype. The experiment was located in an experimental orchard where trees were submitted to contrasting summer irrigation treatments. The use of airborne multispectral images (in reflective and thermal infrared spectral domains) was explored as a possible approach to evaluate the hybrids’ behavior in orchard conditions. Emphasis was put on the leaf transpiration status which was approached by measuring foliage temperature in thermal infrared (TIR) and by calculation of the Water Deficit Index (WDI). Here we proposed to calculate the WDI at tree scale, to overcome limitations of TIR interpretation for non-covering vegetation by taking the crop cover fraction into account. This was performed through the calculation of the Normalized Difference Vegetation Index (NDVI). Our results highlight capacity of thermal imaging for phenotyping water stress. Spatial resolution of TIR images needs to be improved in order to refine the phenotyping data and specific image treatment is required to extract relevant leaf thermal information which can allow for effective differentiation of hybrids’ behavior in response to soil water constraint. Remote sensing thus appears promising for phenotyping varietal response of apple tree to soil drought at adult stage in field conditions.
INTRODUCTION
In the future, climate change will lead to longer periods of heat, scarce precipitation and high air vapor pressure deficits (IPCC, 2007). This will hamper temperate fruit production in particular where irrigation becomes limited. Adapting fruit trees to abiotic stresses such as water stress is thus a new challenging issue for fruit crops, whose water-use needs to be deeply re-considered (Sircelj et al., 2007). New breeding traits could be proposed and implemented, consisting in better adaptation to water stress and/or better water use efficiency (Condon et al., 2004; Bassett et al., 2011). Our previous results on an apple hybrid population at young stage have shown a genotypic variability of responses to water stress in controlled conditions (Regnard et al., 2008). Stomatal conductance and photosynthesis rate revealed to be heritable and quantitative traits loci were detected for these traits (Regnard et al., 2009). Nevertheless stomatal conductance can be positively affected by the fruit acting as a sink (Wünsche and Ferguson, 2005), or negatively affected by high vapor pressure deficits. As a consequence, in perennial crops such as fruit trees, measurements performed in controlled conditions at juvenile stage do not permit a straightforward prediction of mature tree behavior in field, and stability of
leaf traits needs to be assessed at adult stage. However, phenotyping of tree hybrid populations in the field remains challenging since most ecophysiological measurements are low-throughput.
In parallel to increasing genotyping possibilities, it thus appears necessary to develop tools and approaches which could permit high-throughput phenotyping of ecophysiological plant traits. In controlled conditions remote sensing techniques allows characterizing plant growth, plant water status or other physiological traits (Berger et al., 2010) that are useful in phenotyping purpose. In field conditions, Jones et al. (2009) have recently shown the possibilities of ground measurements of foliar temperature using infrared thermography for phenotyping relative stomatal conductance in rice inbred lines. To increase throughput phenotyping, airborne imagery can provide spatial exhaustive information on a whole experimental field, with a high spatial resolution adapted to fine observations. In field conditions high resolution TIR airborne images are currently used for detection of water stress and irrigation scheduling through the calculation of water stress indices such as the Crop Water Stress Index (CWSI; Berni et al., 2009). CWSI is however applicable to fully covering canopies, which limits its use on heterogeneous crop covers. Developed by Moran et al. (1994), the Water Deficit Index (WDI) allows for the application of the Crop Water Stress Index (CWSI; Jackson et al., 1981; Idso, 1982) to partially covering plant canopies. It is based on the Vegetation Index/Temperature concept and more precisely on a trapezoidal shape formed by the relationship between leaf surface temperature minus air temperature (Ts-Ta) and a vegetation cover fraction,
which can be represented by the spectral vegetation index NDVI.
Our study addresses the question of apple tree responses to drought, and water use efficiency, and contributes to phenotyping methodologies developed in field conditions using remote sensing techniques. The use of airborne multispectral images is explored as a possible approach to evaluate the behavior of an adult apple population grown in orchard conditions, through the application to each tree of the WDI spectral index. Our research assumed high resolution imaging and use of water stress indices could provide a relevant and sensible method for discriminating the hybrid stomatal response to water stress thanks to the collection of images on the whole tree population at the same time. In this paper, the procedure for image acquisition and processing to obtain phenotypic information associated with the plant response to water stress is detailed, with emphasis on some crucial parameters to consider in order to obtain reliable phenotyping data.
MATERIALS AND METHODS Plant Materials and Field Set-Up
The study was performed on an apple orchard located at INRA Mauguio experimental farm (43°36’35 N; 3°58’52 E) and is part of Diaphen phenotyping platform. The plant material consisted in an apple progeny of 122 hybrids (‘Starkrimson’ × ‘Granny Smith’), repeated 4 times. Trees were grafted on M9 rootstock, and distributed along 10 rows within the plot. The field plot was irrigated with a microsprayer system located in the row. Five rows supported a summer drought treatment: water-stressed trees (without irrigation, hereafter referred to as S treatment), while 5 rows were well watered during the whole vegetation period (not stressed trees, hereafter referred to as NS treatment). The S and NS rows alternated within the experimental set-up (Fig. 1), and each treatment was applied to 2 trees per genotype. For well watered trees irrigation was scheduled according to soil water potential (soil, 30 and 60 cm) measured at a representative area of the field.
Environmental conditions were monitored by meteorological sensors recording global and photosynthetically active solar radiation, soil and air temperatures, air humidity, wind speed and rainfalls. These data were averaged at a 10-min step-time and stored into a Campbell Scientific CR10X data logger.
Airborne Image Acquisition, Field Measurement
CMOS sensor) commercial digital cameras each equipped with a 35-mm lens, and one FLIR B20HS (320×240 matrix) thermal infrared camera for the acquisitions of TIR images (8.5 to 14.0 µm). One digital camera acquired visible images in Red, Green and Blue bands (RGB) while the second was modified according to Lebourgeois et al. (2008) to obtain images in the Near Infrared (NIR). The acquisition of airborne images was performed by L’Avion Jaune® Company. The cameras were set-up on an ultra-light aircraft (ULA) and three flights were performed during summer 2010. One flight (July 16) was scheduled at the beginning of water stress and two flights occurred during the mid-summer soil water stress (August 3 and 17). Acquisitions took place between 9:00 and 11:00 GMT, at times corresponding to the diurnal water stress development at each date (Table 1).
To correct atmospheric effects in airborne TIR images, temperature measurements of cold and hot reference surfaces were performed with a Heitronics® KT19 radio-thermometer during each airborne acquisition. Nine aluminum targets were distributed within the experimental field for image geo-location (Fig. 1). The low emissivity of aluminum leads to easily apparent cold points in thermal images, and a differential GPS (DGPS) was used to obtain the precise position of each target.
Images taken at 300 m elevation had a 5-cm resolution in RGB and NIR, and 30 cm in TIR. At this height, the orchard (100×60 m) was covered by 1 to 2 images, which allowed for analysis of full orchard without data losses during the image processing due to an excessive number of photos (Table 1).
Image Processing
Before extraction of phenotypic information from images, several corrections were performed with Erdas Imagine® software. First step was realized by L’Avion Jaune® and consisted mainly in ortho-rectification, geo-location and vignetting correction as described in Lebourgeois et al. (2008). When the plot was covered by more than one photo, a mosaic image was generated thanks to the geo-referenced targets allowing minimizing the maximum offsets between the two parts of the orchard. Two informations were extracted from the corrected images:
- NDVI, which is a spectral index linked to leaf area index, and gives information about plant cover density and nitrogen supply as well as vegetation coverage. It was computed from red (R) and near infrared (NIR) bands according to Rouse et al. (1973): NDVI=(NIR-R)/(NIR+R).
- Surfaces temperatures (Ts) whose values were extracted from TIR images measured at
aircraft level and corrected by the atmospheric interference, via the use of temperatures of cold and hot targets. The Ts-Ta value was obtained by difference between leaf surface
temperature and air temperature.
Water Deficit Index calculation
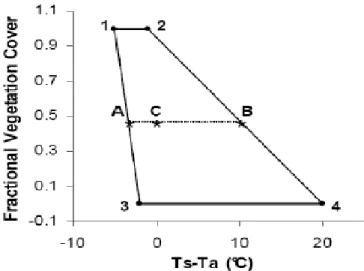
The WDI computation is based on the trapezoidal shape formed by the relationship between (Ts-Ta) and vegetation cover fraction (Fig. 2), which can be
represented by a spectral vegetation index such as NDVI. Theoretical equations for computation of the trapezoid vertices are given in Moran et al. (1994). WDI can be defined empirically (Clarke, 1997) by calculation of the trapezoid limits based on the image data. However, defining empirical WDI boundaries is not easy when the scenes viewed by the airborne optical and thermal infrared sensors do not contain the dry and wet bare soil and vegetation states corresponding to the vertices of the trapezoid (Fig. 2). Therefore, the WDI boundaries were defined using a statistical method by calculating the 1 and 99% quantiles of NDVI for the upper and lower limits, according to Koenker (2008). Lines (1-3) and (2-4) (Fig. 2) were defined by calculating the 1 and 99% quantile regressions of (Ts-Ta) as a function of NDVI. WDI, which reflects water stress intensity
through the ratio between actual evapotranspiration (ETactual) and maximal
evapotranspiration (ETmax), was computed for each point C of the scatter plot using the
WDI=1-[ETactual/ETmax]=[(Ts-Ta)-(Ts-Ta)min]/[(Ts-Ta)max-(Ts-Ta)min]=AC/AB (1)
where (Ts-Ta)min, (Ts-Ta)max and (Ts-Ta) correspond to points A, B and C, respectively
(Fig. 2). WDI was calculated from Ts-Ta and NDVI mean values, which were extracted at
tree scale in a 60-cm buffer zone at the center of each tree.
Statistical Analysis
All statistical analyses were performed using R software. Genotype and drought effects were analyzed by a two-way ANOVA after ensuring the data were normally distributed and the variances homogeneous.
RESULTS
Figure 3 presents the scatter plot of couples of (Ts-Ta; NDVI) points obtained for
each pixel of the experimental field (grey points). The (Ts-Ta; NDVI) average values for
each individual tree are represented by black and white points (superimposed over the grey) for NS and S trees, respectively. Differences appear clearly between NS and S tree groups on the (Ts-Ta) axis. The NS/S distance rose from July 16 to August 17,
corresponding to significantly higher WDI values, highlighting an increase of water stress in S trees (Table 2). Scatter plots of NS and S treatments on August 3 seemed less spread than on July 16. This was confirmed by the differences between WDI mean values for NS and S treatments, which were lower on August 3 than July 16, 0.177 and 0.218, respectively. Rainfall that occurred two days before the August 3 ULA flight (data not shown) could account for this result.
Table 2 presents the results of a two-way ANOVA on NDVI, Ts-Ta and WDI
values, testing the effects of genotype, drought, and possible interaction. This analysis revealed a decrease in the significance of the genotype effect for the 3 variables, between the first and third acquisition dates, as shown by F and p-values. However, Ts-Ta became
statistically non-significant on August 3. Conversely, drought effect increased with stress intensity for each factor as shown by F values, which rose from 0.6 to 18 for NDVI, from 307 to 1739 for Ts-Ta and from 506 to 1672 for WDI. Drought effect was not significant
for NDVI at the first date and increased with stress intensity. These results can be related to the increase in soil water constraint shown by the progressively lower values of soil
(Table 1). No interaction was revealed between genotype and drought factors.
DISCUSSION AND CONCLUSIONS
With a phenotyping purpose, we investigated remote sensing approach and a methodological background previously used for irrigation scheduling (Berni et al., 2009). This method was here applied to individual trees. In this context, high resolution images are needed to be able to discriminate between pixels. In this research, 30 cm resolution thermal images were obtained and analyzed, in which pixels reflect the transpiration status of well-exposed leaves, but also include shaded leaves, soil, trunk and branches. Values of NDVI and Ts-Ta were extracted from a 60-cm buffer at the center of each tree
and these values were averaged without distinguishing soil and vegetation. Because of large variability of architecture and tree size observed in the hybrid population (data not shown), the adequacy of a 60-cm buffer zone varies depending on the tree size: if this zone is relevant for analyzing large trees, it clearly includes more soil for smaller trees. As a consequence, buffer definition could be improved by delimiting a zone of interest within the image. Another improvement could be obtained by filtering the images using a NDVI threshold to disentangle bare soil and vegetation. However, the spatial resolution of the thermal images is presently too coarse to differentiate soil and plant foliage temperatures within the tree crown. Thus, for increasing the relevancy of WDI in the study of apple trees response to water constraint, resolution of thermal imaging will be raised in future experiment by loading the cameras in an unmanned aerial vehicle (UAV).
Furthermore, the estimation of WDI values must be validated by an independent and robust method. For this, we also explored plant water status measured at tree level
(stem and/or gsw). This highlighted a good correlation between classical measurement of
tree water status (stem and/or gsw) and infrared leaf temperature (data not shown),
consistently with previous studies (Berni et al., 2009; Jones et al., 2009).
In the perspective of genetic studies, the results of ANOVA analyses demonstrated that we can differentiate between stress and non-stress conditions, and between hybrids (since genotypic effect was significant). The absence of interaction between the genotype and drought factors suggests that their effects were purely additive. The decrease in genotype effect along with the stress increase, suggests that the best period to reveal genotype-dependent behavior differences in response to stress corresponds to the beginning of stress application. Finally, our results are promising regarding the use of remote sensing techniques for high-throughput phenotyping of adult apple tree varietal response to soil water constraint in field conditions.
ACKNOWLEDGEMENTS
Ph.D. scholarship of Nicolas Virlet is granted by Montpellier SupAgro and Languedoc Roussillon Region. The flight program benefited from the European Interreg IIIb program Telerieg SOE1/P2/E082. The authors also thank Stephan Feral for his technical support in orchard management.
Literature Cited
Bassett, C.L., Glenn, D.M., Forsline, P.L., Wisniewski, M.E. and Farrell, R.E. Jr. 2011. Characterizing water use efficiency and water deficit responses in apple (Malus ×
domestica Borkh. and Malus sieversii Ledeb.). M. Roem. HortScience 46:1079-1084.
Berger, B., Parent, B. and Tester, M. 2010. High-throughput shoots imaging to study drought responses. J. Exp. Bot. 61:3519-3528.
Berni, J.A.J., Zarco-Tejada, P.J., Sepulcre-Canto, G., Fereres, E. and Villalobos, F. 2009. Mapping canopy conductance and CWSI in olive orchards using high resolution thermal remote sensing imagery. Remote Sens. Env. 113:2380-2388.
Clarke, T.R. 1997. An empirical approach for detecting crop water stress using multispectral airborne sensors. HortTechnology 7(1):9-16.
Condon, A.G., Richards, R.A., Rebetzke, G.J. and Farquhar, G.D. 2004. Breeding for high water-use efficiency. J. Exp. Bot. 55:2447-2460.
Idso, S.B. 1982. Non-water-stressed baselines: a key to measuring and interpreting plant water stress. Agric. Meteorol. 27:59-70.
IPCC (Intergovernmental Panel on Climate Change). 2007. Summary for policy makers. In: Climate Change 2007: The Physical Science Basis. Contribution of Working Group I to the Fourth Assessment Report of the Intergovernmental Panel on Climate Change. www.ipcc.ch.
Jackson, R.D., Idso, S.B., Reginato, R.J. and Pinter, P.J. 1981. Canopy temperature as a crop water stress indicator. Water Resource Res. 17:1133-1138.
Jones, H.G., Serraj, R., Loveys, B., Xiong, L., Wheaton, A. and Price, A. 2009.Thermal infrared imaging of crop canopies for the remote diagnosis and quantification of plant responses to water stress in the field. Funct. Plant Biol. 36:978-989.
Koenker, R. 2008. Censored quantile regression redux. J. Stat. Softw. 27(6):1-25.
Lebourgeois, V., Bégué, A., Labbé, S., Mallavan, B., Prévot, L. and Roux, B. 2008. Can commercial digital cameras be used as multispectral sensors? A crop monitoring test. Sensors 8:7300-7322.
Moran, M.S., Clarke, T.R., Inoue, Y. and Vidal, A. 1994. Estimating crop water deficit using the relation between surface-air temperature and spectral vegetation index. Remote Sens. Env. 49:246-263.
Regnard, J.L., Ducrey, M., Porteix, E., Segura, V. and Costes, E. 2008. Phenotyping apple progeny for ecophysiological traits: how and what for? Acta Hortic. 772:151-158.
Regnard, J.L., Segura, V., Merveille, N., Durel, C.E. and Costes, E. 2009. QTL analysis for leaf gas exchange in an apple progeny grown under atmospheric constraints. Acta Hortic. 814:369-374.
Rouse, J.W., Hass, R.H., Schell, J.A. and Deering, D.W. 1973. Monitoring vegetation systems in the great plains with ERTS. In 3rd ERTS Symposium. p.309-317.
Sircelj, H., Tausz, M., Grill, D. and Batic, F. 2007. Detecting different levels of drought stress in apple trees (Malus × domestica Borkh.) with selected biochemical and physiological parameters. Scientia Hort. 113:362-369.
Wünsche, J.N. and Ferguson, I.B. 2005. Crop load interactions in apple. Hort. Reviews 31:231-290.
Tables
Table 1. Image spatial resolution and soil water status for each airborne acquisition date. Soil water potential is an average between values obtained at 30 and 60 cm depths.
07-16-2010 08-03-2010 08-17-2010
Flight altitude (m) 350 330 480
Number of photos to cover the orchard RGB 1 1 1
TIR 1 2 1
Pixel size (cm) RGB 5×5 3×3 5×5
TIR 30×30 30×30 30×30
Soil water potential (MPa) NS -0.019 -0.011 -0.021
S -0.093 -0.121 -0.188
Table 2. Effect of genotype, drought and their interaction on NDVI, Ts-Ta and WDI, for
each acquisition date.
Date Variables Genotype (G) Drought (D) G * D Post-hoc test (D effect) F p-value F p-value F p-value Mean NS Mean S 07-16 NDVI 3.6 <10-15 0.6 n.s. 0.9 n.s. 0.108a 0.106b Ts-Ta 2 <10 -5 307 <10-15 0.5 n.s. 4.149b 6.402a WDI 1.8 <10-4 506 <10-15 0.5 n.s. 0.277b 0.495a 08-03 NDVI 3.3 <10-14 15 <10-3 0.9 n.s. 0.238a 0.225b Ts-Ta 1.1 n.s. 902 <10 -15 0.6 n.s. 0.935b 2.902a WDI 1.9 <10-4 775 <10-15 0.5 n.s. 0.228b 0.405a 08-17 NDVI 2.5 <10-8 18 <10-4 0.8 n.s. 0.224a 0.208b Ts-Ta 1.3 0.052 1739 <10 -15 0.6 n.s. 7.969b 11.832a WDI 1.5 <10-2 1672 <10-15 0.6 n.s. 0.227b 0.542a 1
In ANOVA p-values less than 0.05 indicate significant effects and n.s. non-significant p-values. In Newman-Keuls post-hoc test, means followed by different letters differ significantly at P=0.05.
Figures
Fig. 1. Plan of the experimental field (ca. 6000 m2). Aluminum targets (9 black points) located at the middle and periphery of the field were DGPS localized for accurate image geo-location. Non stressed (NS) rows are represented in dark grey and stressed (S) rows colored in clear grey. Soil water potential sensors are located in the area delimited by a dotted line.
Fig. 2. Illustration of Moran’s VIT concept and WDI calculation. Vertices of the trapeze represent: 1, well watered and fully covering vegetation; 2, water stressed and fully covering vegetation; 3, saturated bare soil; 4, dry bare soil. For any point C, WDI is equal to the ratio between AC/AB. Source: Moran et al., 1994.
Fig. 3. Graphic representation of WDI values estimated from all pixels of TIR and NDVI images (grey points) and from pixels of a buffer zone delimited at the center of each apple tree. Black points represent NS trees and white ones S trees. Ts-Ta is