HAL Id: tel-02784928
https://hal.inrae.fr/tel-02784928
Submitted on 4 Jun 2020
HAL is a multi-disciplinary open access
archive for the deposit and dissemination of sci-entific research documents, whether they are pub-lished or not. The documents may come from teaching and research institutions in France or abroad, or from public or private research centers.
L’archive ouverte pluridisciplinaire HAL, est destinée au dépôt et à la diffusion de documents scientifiques de niveau recherche, publiés ou non, émanant des établissements d’enseignement et de recherche français ou étrangers, des laboratoires publics ou privés.
Assessment of yield and economic losses caused by pests
and diseases in a range of management strategies and
production situations in coffee agroecosystems
Rolando Cerda
To cite this version:
Rolando Cerda. Assessment of yield and economic losses caused by pests and diseases in a range of management strategies and production situations in coffee agroecosystems. Life Sciences [q-bio]. Institut National d’Etudes Supérieures Agronomiques de Montpellier, 2017. English. �tel-02784928�
Délivré par Montpellier SupAgro
Préparée au sein de l’école doctorale GAIA
Et des unités de recherche :
UMR SYSTEM Fonctionnement et conduite des systèmes de
culture tropicaux et méditerranéens
UR 106 du CIRAD Bioagresseurs : analyse et maîtrise du risque
Spécialité : EFSA - Écologie Fonctionnelle et Sciences
Agronomiques
Présentée par Rolando CERDA
Soutenue le 21 Février 2017 devant le jury composé de
M. Fabrice DE CLERCK, Ph.D., Bioversity Rapporteur Mme. Muriel VALANTIN-MORISON, Ph.D., INRA Grignon Rapporteuse
Mme. Marie-Laure DESPREZ-LOUSTAU, Ph.D., INRA Bordeaux Examinatrice M. Stéphane DE TOURDONNET, Ph.D., Montpellier SupAgro Examinateur
M. Jacques AVELINO, Ph.D., CIRAD Costa Rica Examinateur
M. Christian GARY, Ph.D., INRA Montpellier Directeur
Assessment of yield and economic losses
caused by pests and diseases in a range of
management strategies and production
situations in coffee agroecosystems
iii
FOREWORD
This Thesis was developed from February 2014 to February 2017. The doctoral program and the grant agreement for the student (Rolando Cerda B.) were developed under the convention framework among Institute de Recherche pour Développement (IRD), CIRAD/UMR-SYSTEM laboratory, and Centro Agronómico Tropical de Investigación y Enseñanza (CATIE).
The doctoral student (Rolando Cerda B) was registered in:
Doctoral school: GAIA - Biodiversité, Agriculture, Alimentation, Environnement, Terre, Eau. SupAgro, Montpellier, France
Specialty: EFSA - Écologie Fonctionnelle et Sciences Agronomiques
Research unit: UMR-SYSTEM - Fonctionnement et conduite des systèmes de cultures tropicaux et méditerranéens
Members of the Thesis committee were:
Christian Gary – Director of the Thesis (UMR System)
Jacques Avelino – Co-director of the Thesis (UPR Bioagresseurs) Clémentine Allinne – Co-director of the Thesis (UMR System) Philippe Tixier – External member (UPR Système bananes et ananas) Jean Noel Aubertot – External member (UMR Agir)
iv
ACKNOWLEDGMENTS
To my local directors, Jacques Avelino and Clementine Allinne, for their constant support and dedication for the success of this doctoral research, and for their noble friendship.
To my director, Christian Gary, for his constant supervision and time dedicated to ensure the good development of my Ph.D. studies, from the design of the study to the finalization of the Thesis.
To the members of the Thesis committee, my advisors, Phillipe Tixier and Jean-Noel Aubertot, for their advises and help in the statistical analysis and in the improvement of the manuscripts of the Thesis.
To Celia Harvey, coordinator of the CASCADE project, for their high valuable revisions and contributions for the publications of the manuscripts of this Thesis.
To the internship students, Esther Lechevallier, Louise Krolczyk, Charlie Mathiot, Eugenie Clement and Coralie Welsch, for their help in both the intensive field work and in the exploration of the best statistical techniques for analyzing the data. My good friends!
To the field assistants, my friends, Hugo Mendez, Steven Cerdas, David Mora, Adrian Arce, for their excellent collaboration, work, and initiative during the field work. Without the help of this noble persons, we wouldn’t have the enormous amount of data for this research.
To the IRD, France, for giving me the grant for the studies, and therefore the possibility to do grow professionally in this Ph.D. program.
To the project CASCADE, for funding the two years of field work, making possible to establish a research plot network and obtain the necessary data for the research.
To the project CoLosses, funded by the French National Institute for Agricultural Research (INRA), DAMAGE key action, for funding the field work of the experimental parcel under controlled situations during three years. And for funding my registration in the graduate school of Montpellier SupAgro.
To CATIE, for giving us permission to establish an experimental parcel in their commercial farm, and for funding the basic management of coffee plants in such parcel.
A very special thanks to all the farmers who were owners of the coffee plots of the research plot network in Turrialba. For their permission to conduct measurements in their coffee plots during two years, and for their patience and willing to answer questions in the interviews. And most important, for their highly kind friendship. I learned a lot from their conversations and the management/problems/desires regarding coffee, when we walked many times in their coffee plots, or when they shared with me a goof cup of coffee while talking.
v
CONTENTS
THESIS SUMMARY
... 1
PART I. INTRODUCTION
... 2
Chapter 1. Problematic/Definitions/Research questions ...3
1.1 Crop losses worldwide ... 3
1.2 Coffee crisis in America ... 4
1.3 Research needs ... 5
1.4 Definitions to state the scope of this research ... 5
1.4.1 Injury profile ... 6 1.4.2 Crop loss ... 6 1.4.3 Yield loss ... 6 1.4.4 Attainable yield ... 6 1.4.5 Actual yield ... 7 1.4.6 Economic loss ... 7
1.4.7 Primary and secondary crop losses ... 8
1.4.8 Production situations ... 8
1.4.9 Management strategies ... 10
1.5 The importance of injury profiles for crop loss assessments ... 10
1.6 How to assess crop losses... 11
1.7 Regulation of pests and diseases and other ecosystem services ... 12
1.8 Justification of the research ... 13
1.9 Research questions and hypotheses ... 13
PART II. MATERIALS AND METHODS
... 15
Chapter 2. Materials and methods ...16
2.1 General strategy to respond the research questions ... 16
2.2 Coffee Losses Experiment (CoLosses) ... 17
2.2.1 Location and establishment ... 17
2.2.2 Experimental design ... 18
2.2.3 Measurement of the studied variables ... 19
2.3 Coffee Research Plot Network (CASCADE) ... 21
2.3.1 Location and establishment ... 21
vi
2.3.3 Experimental design ... 23
2.3.4 Measurements of the studied variables ... 25
2.4 Statistical methods ... 26
PART III. RESULTS
... 29
Chapter 3. Multiple ecosystem services provided by coffee agroecosystems ...30
Manuscript 1: Effects of shade, altitude and management on multiple ecosystem services in coffee agroecosystems... 30
Chapter 4. Modelling coffee yield losses caused by pests and diseases ...53
Manuscript 2: Primary and secondary yield losses caused by pests and diseases: assessment and modeling in coffee ... 53
Chapter 5. Coffee yield losses due to injury profiles under different management strategies and production situations ...71
Manuscript 3: Primary and secondary yield losses caused by injury profiles under different management strategies and production situations in coffee agroecosystems ... 71
Chapter 6. Reduction of coffee losses and provision of multiple ecosystem services ... 101
Manuscript 4: Coffee agroforestry systems for reducing crop losses while providing multiple ecosystem services ... 101
PART IV. GENERAL DISCUSSION
... 123
Chapter 7. General discussion ... 124
7.1 Scientific contributions of this Ph.D. Thesis in the fields of crop losses research and assessment of ecosystem services ... 124
7.1.1 Both production situations and management strategies determine coffee yield and pest and disease injuries ... 124
7.1.2 In perennial crops such as coffee, injury profiles affect yield losses not only during the same year but also during the following year(s) ... 125
7.1.3 Diversified agroforestry systems have better chances to regulate pests and diseases and provide multiple ecosystem services simultaneously ... 128
7.2 Conceptual models and definitions regarding crop losses adapted to perennial crops ... 129
7.3 Implications for the design and management of tropical agroecosystems oriented towards the reduction of crop losses and provision of multiple ecosystem services ... 130
vii
LITERATURE
... 134
LIST OF FIGURES
Chapter 1. Problematic/Definitions/Research questions ...3Fig. 1.1. Scheme of the variables and relationships studied in order to respond the main and intermediary research questions ...14
Chapter 2. Materials and methods ...16
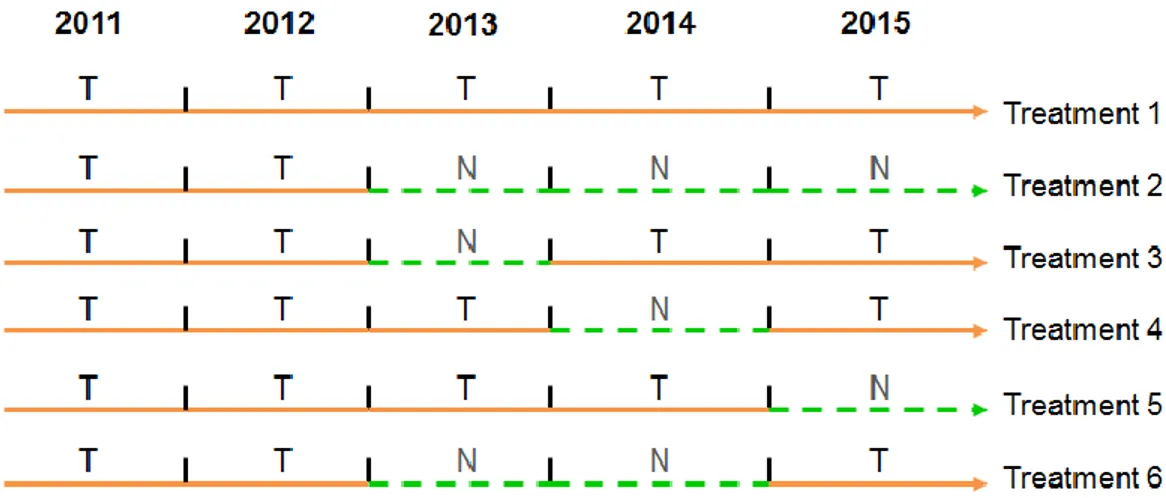
Fig. 2.1. Treatments (T1 to T6) for the primary and secondary yield losses assessment ...18
Fig. 2.2. Sketch and picture of the Coffee Losses experiment in CATIE farm, Turrialba, Costa Rica ...20
Fig. 2.3. Illustration of marked branches in coffee plants for measurements ...20
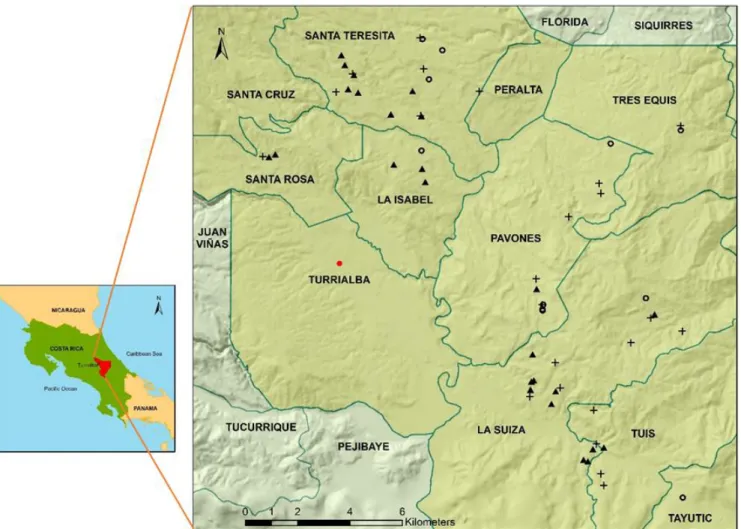
Fig. 2.4. Location of coffee plots in the Coffee Research Plot Network (CASCADE), Turrialba, Costa Rica ..21
Fig. 2.5. The final main three types of shade considered in the Coffee Research Plots Network, Turrialba, Costa Rica ...24
Fig. 2.6. Sketch of the coffee plots in the coffee research plots network ...26
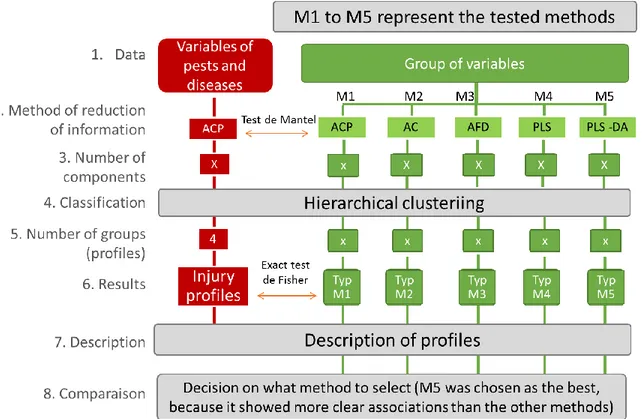
Fig. 2.7. Simple illustration of five methods (multivariate techniques) tested for the assessment of associations between typologies of injury profiles and production situations, management strategies, and categories of yield and yield losses. ...28
Chapter 3. Multiple ecosystem services provided by coffee agroecosystems ...30
Fig. 3.1. Effects of the double interaction altitude x type of shade on the sAUDPC of coffee leaf rust (A), and of the triple interaction altitude x type of shade x management intensity on the number of dead branches (B1 and B2). The two double interactions altitude x type of shade (B1) and shade x management intensity (B2) are represented for simplification. ...42
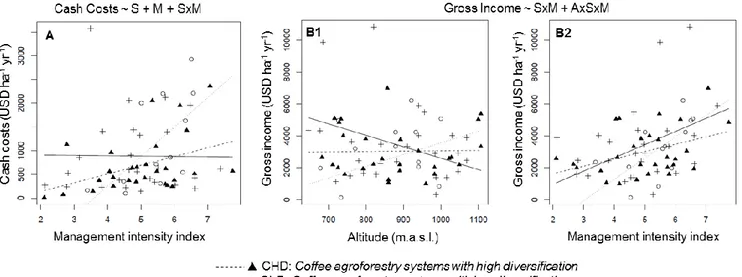
Fig. 3.2. Effects of the double interaction type of shade x management intensity on cash costs (A), and of the triple interaction altitude x type of shade x management intensity on gross income (B1 and B2). The two double interactions altitude x type of shade (B1) and shade x management intensity (B2) are represented for simplification ...43
Fig. 3.3. Single effects of type of shade on soil acidity (A) and soil K (B) ...43
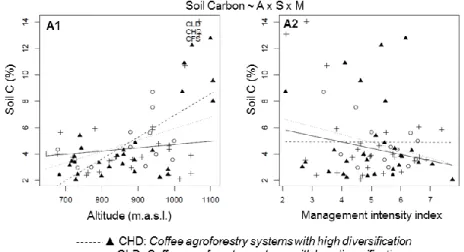
Fig. 3.4. Effects of the triple interaction altitude x type of shade x management intensity on soil C. The two double interactions altitude x type of shade (A1) and shade x management intensity (A2) are represented for simplification ...44
Fig. 3.5. Effects of the types of shade on the total aboveground biomass carbon ...44
Fig. 3.6. Relationships between ecosystem services and biodiversity; and percentage of different types of coffee plots achieving the most desirable values of ecosystem services. ...46
viii Chapter 4. Modelling coffee yield losses caused by pests and diseases ...53 Fig. 4.1. Conceptual model for the assessment of coffee yield losses caused by pests and diseases ...57 Fig. 4.2. Scheme of the treatments applied in the coffee experimental parcel ...58 Fig. 4.3. Yields and primary and secondary yield losses resulting from the sequences of chemical treatments
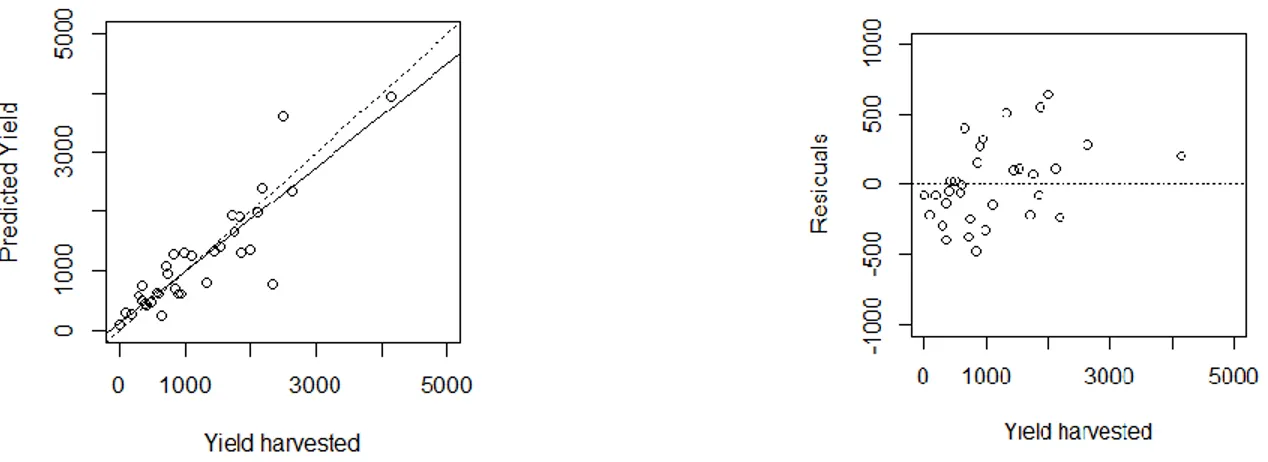
TTT, TTN, TNT, TNN ...63 Fig. 4.4. Structural equation models for the estimation of actual coffee yield for Piecewise List 1 (A) and
Piecewise List 2 (B) presented in Table 4.4...65 Fig. 4.5. Evolution of coffee production in Central America as a percentage of the production in the harvest
year 2011/2012 ...67
Chapter 5. Coffee yield losses due to injury profiles under different management strategies and production situations ...71 Fig. 5.1. Conceptual model describing the associations between components of production situations and
management strategies with injury profiles leading to coffee yield losses ...76 Fig. 5.2. Description of the typologies of injury profiles obtained in 2014 and 2015. Typologies in 2014 and in
2015 were built independently. ...82 Fig. 5.3. Description of the typologies and profiles representing the physiological characteristics of coffee
plants: (A) Coffee productive characteristics; (B) Nutrient deficiencies; and (C) Nutrient in leaves, obtained in 2014 and 2015. Typologies in 2014 and in 2015 were built independently. ...84 Fig. 5.4. Description of the typologies and profiles representing production situations (A) Topoclimate; (B) Type
of shade; and (C) Soil fertility, obtained in 2014 and 2015. Typologies in 2014 and in 2015 were built independently. ...85 Fig. 5.5. Description of the typologies and profiles of management strategies, obtained in 2014 and 2015.
Typologies in 2014 and in 2015 were built independently. ...86 Fig. 5.6. Categories of (A) Attainable yield; (B) Actual yield; (C) Primary yield loss; and (D) Secondary yield
loss, obtained in 2014 and 2015. Typologies in 2014 and in 2015 were built independently. ...87 Fig. 5.7. Graphical representations of the simple correspondence analysis of injury profiles, estimated yields
and yield losses, physiological characteristics of coffee plants, management strategies and production situations in 2014. ...89 Fig. 5.8. Graphical representations of the simple correspondence analysis of injury profiles, estimated yields
and yield losses, physiological characteristics of coffee plants, management strategies and production situations in 2015 ...90 Fig. 5.9. Graphical representations of the simple correspondence analysis of injury profiles, yields and yield
losses of 2015 in association with profiles of 2014 ...92 Fig. 5.10. Summary of the management strategies and production situations leading to severe injury profiles
and then to primary and secondary yield losses ...93
Chapter 6. Reduction of coffee losses and provision of multiple ecosystem services ... 101 Fig. 6.1. Relationships between indicators of crop losses and indicators of presence of diseases; and different
ix Fig. 6.2. Relationships between indicators of crop losses and indicators of provisioning of agroforestry products; and different types of coffee plots achieving the most desirable levels of ecosystem services. .... 111 Fig. 6.3. Relationships between indicators of crop losses and indicators of maintenance of soil fertility; and
different types of coffee plots achieving the most desirable levels of ecosystem services. ... 112 Fig. 6.4. Relationships between indicators of crop losses and indicators of carbon sequestration; and different
types of coffee plots achieving the most desirable levels of ecosystem services. ... 113 Fig. 6.5. Options for the main types of coffee agroecosystems in the tropics to move to one of the most
promising agroforestry systems identified in this study ... 120
Chapter 7. General discussion ... 124 Fig. 7.1. Qualitative representation of the ecosystem services provided by successful agroforestry systems in
x
LIST OF TABLES
Chapter 1. Problematic/Definitions/Research questions ...3
Table 1.1. Definitions of attainable yield ...7
Table 1.2. Definitions of production situation ...9
Chapter 2. Materials and methods ...16
Table 2.1. Climate characteristics in Turrialba, Costa Rica (2011-2015) ...17
Table 2.2. Characteristics of the chemical pesticides, dosages and applications during the experiment CoLosses ...19
Table 2.3. Characteristics of the chemical fungicides, dosages and applications during the experiment in ten coffee plots of CASCADE ...25
Chapter 3. Multiple ecosystem services provided by coffee agroecosystems ...30
Table 3.1. Management descriptors of coffee agroecosystems in the coffee plot network (n= 69 plots) in Turrialba, Costa Rica ...35
Table 3.2. Structure and plant diversity, age, planted area, management intensity and altitude of the three types of shade (CFS: Coffee monocultures in full sun; CLD: Coffee agroforestry systems with low diversification; CHD: Coffee agroforestry systems with high diversification) in the coffee plot network, Turrialba, Costa Rica ...36
Table 3.3. List of indicators of ecosystem services (ES) and the methods used for measuring them in the coffee plot network, Turrialba, Costa Rica ...38
Table 3.4. General statistical measures and effects of altitude (A), type of shade (S) and management intensity (M) on indicators of four ecosystem services provided by coffee agroecosystems in Turrialba, Costa Rica (n=69 plots) ...41
Chapter 4. Modelling coffee yield losses caused by pests and diseases ...53
Table 4.1. Variables characterized in the coffee experimental parcel, Turrialba, Costa Rica ...59
Table 4.2. Number of plots and plants considered in the analysis, according to different three-year sequences of chemical treatments and quantification of yield losses ...60
Table 4.3. Basic statistics of the variables studied in the coffee experimental parcel, Turrialba, Costa Rica ..62
Table 4.4. Models for the estimation of actual coffee yields in 2015 (g of fresh coffee cherries per plant) with data of 2014 and 2015, through Piecewise structural equation modeling ...64
Chapter 5. Coffee yield losses due to injury profiles under different management strategies and production situations ...71
Table 5.1. List of variables per typology, and methods used for measurements during two years (2014-2015) in the coffee plot network, Turrialba, Costa Rica ...78
Table 5.2. Models and equations to estimate attainable yields actual yields, and primary and secondary yield losses of coffee ...79
xi Table 5.3. Associations between injury profile and typologies of yields, yield losses, management strategies,
production situations and physiological characteristics of coffee plants in 2014 ...88
Table 5.4. Associations between injury profile and typologies of yields, yield losses, management strategies, production situations and physiological characteristics of coffee plants in 2015 ...90
Table 5.5. Fisher test between injury profile of 2015 and typologies of 2014 ...91
Chapter 6. Reduction of coffee losses and provision of multiple ecosystem services ... 101
Table 6.1. Equations to estimate coffee yields and primary and secondary losses ... 106
Table 6.2. List of indicators of ecosystem services (ES) measured during two years (2015-2015) in the coffee plot network, Turrialba, Costa Rica ... 107
Table 6.3. Characteristics of the structure, diversity and shade cover of the most promising coffee agroforestry systems (CAF) to provide multiple ecosystem services ... 115
Table 6.4. Characteristics of cropping practices and costs for the management of coffee plants in the most promising coffee agroforestry systems (CAF) to provide multiple ecosystem services ... 116
Table 6.5. Indicators of ecosystem services of the most promising coffee agroforestry systems (CAF) to provide multiple ecosystem services ... 117
1
THESIS SUMMARY
Crop losses due to pests and diseases are a major threat to incomes and food security of thousands of rural families worldwide. The assessment of crop losses (yield and economic losses) and their causes is needed to improve the development of agroecosystems capable to offer good crop yields, regulation of pests and diseases, and other ecosystem services. This doctoral research aimed to contribute to the research field of crop losses, by providing experimental and modeling approaches that could be used in perennial crops to estimate primary and secondary losses and analyze their causes. We worked in a perennial crop such as coffee, in Turrialba, Costa Rica, where coffee is grown in plantations from monocultures at full sun exposure to highly diversified agroforestry systems, and under a range of production situations (topoclimate, soil fertility, types of shade) and management strategies (agricultural practices and inputs). The three main research questions were: What is the impact of management strategies and production situations on pests and diseases and coffee yields? How do coffee yield losses caused by injury profiles vary in function of management strategies and production situations? Which types of coffee agroecosystems are capable to obtain the lowest coffee losses (yield and economic) and highest overall benefits (ecosystem services)?
This research was developed through two experimental designs. The first was an experimental coffee parcel under controlled conditions (three-year experiment) to quantify primary and secondary yield losses by comparison of treatments, and to identify the main predictors of yield losses by structural equation modeling. The second experimental design was based on surveys in a coffee research plot network (coffee plots of smallholder farmers), where, during two years, we measured indicators of yields and indicators of four ecosystem services: regulation of pests and diseases, provisioning of agroforestry products, maintenance of soil fertility, and carbon sequestration. Yield losses in this network were estimated through modeling using the predictors identified in the experimental coffee parcel. Analyses of data included several statistical techniques, from analysis of variances, linear regressions to multivariate techniques.
The results were organized in four manuscripts, and then discussed integrally. The main findings were: i) Both production situations and management strategies determine coffee yield and pest and disease injuries, effects of interactions altitude x management x types of shade must be considered; ii) Injury profiles depend on particular combinations of production situations and management strategies, with impacts on yield losses especially in a year of high coffee production (primary yield losses), but compromising also the yields of the next year (secondary yield losses); iii) Diversified agroforestry systems have better chances to regulate pests and diseases (reduce yield and economic losses), and simultaneously provide goods for family benefits, maintain soil fertility, and increase carbon sequestration, without implying trade-offs among these ecosystem services.
The main prospects of this research are related to perform similar studies in coffee and other perennials at regional levels, develop an injury profile simulator for coffee, and prototyping of coffee agroforestry systems to optimize the provision of multiple ecosystem services.
2
PART I. INTRODUCTION
3
Chapter 1. Problematic/Definitions/Research questions
1.1 Crop losses worldwide
Crop losses are a major threat to the wellbeing of rural families, to the economy of traders and governments, and to food security worldwide (Zadoks and Schein, 1979; Savary and Willocquet, 2014; Avelino et al., 2015). Crop losses due to pests and diseases for major food and cash crops (rice, wheat, barley, maize, potatoes, soybeans, cotton, and coffee) were estimated between 20 and 40% at country and regional levels in different continents (Oerke et al., 1994; Oerke, 2006). Attacks of pests and diseases can occur in the agricultural land during the production cycle (pre-harvest) and/or during the storage (post-harvest). In both stages, the yield of the crop product as well as its quality can be reduced (Savary et al., 2006b), which implies that financial returns will be also compromised because of less production to sell and/or less quality to offer to buyers (Nutter et al., 1993). Furthermore, implications of crop losses can reach levels far beyond farms, given that a reduced production can affect entire rural communities and regions, national markets and exportations, and at broadest level, the food availability for the world population.
Given the negative implications of crop losses, strategies and measures at different levels (from farms to governments) are needed to reduce them, and must be based on reliable assessments. Quantification of crop product losses and a better understanding of their drivers have been mentioned as essential to (i) evaluating the efficacy of crop protection practices (Oerke, 2006), (ii) making better decisions for integrated pest management (Savary et al., 2006a), (iii) assessing the sustainability of agricultural production systems (Cooke, 2006), (iv) evaluating the effectiveness of pest and disease regulation as an ecosystem service (Avelino et al., 2011; Allinne et al., 2016), and (v) guiding government agencies and other potential donors about where, how and when allocate resources for better control of pests and diseases, and therefore avoid crop losses (Cooke, 2006). The results of these evaluations and guidance could contribute to the design of better practices to reduce the incidences of pests and diseases, as well as to the design of agroecosystems with characteristics (structure-composition-management) aimed to reduce crop losses (Avelino et al., 2015).
Despite the importance of the assessment of crop losses, efforts to quantify them and analyze their causes are considered still scant (Cheatham et al., 2009; Avelino et al., 2011; Savary and Willocquet, 2014). This is an issue for all crops in general, and specially for perennial crops. The most remarkable efforts in the last two decades were concentrated in the quantification of relative yield losses due to pests and diseases through experiments and surveys. In annual crops, for instance, yield losses of: rice ranged from 24% to 41% in Asia (Savary et al., 2000a), potatoes from 5% to 96% in France (Rakotonindraina et al., 2012), cotton up to 100% in Thailand (Castella et al., 2007). In perennial crops, such estimations are really scarce: on apple and other stone fruits yield losses reached up to 5% in the Netherlands (van Leeuwen et al., 2000), in coffee yield losses ranged from 13% to 45% in Brazil (Barbosa et al., 2004). Explicit monetary valorizations of yield losses due to pests and diseases is even scarcer; at least in the scientific literature, they cannot be found.
Chapter 1. Problematic/Definitions/Research questions
4 The scarcity of quantifications of crop losses and analyses of their causes is related mainly to the difficulty of their assessment. Most attempts to measure yield reductions (losses) were based on relationships between yields and an indicator of a given pest or disease. However, farmers usually do not face only one pest or disease, and their crops can be exposed to different conditions (Savary et al., 2006a). Such relationships therefore can be masked by several confounding factors such as interactions with other pests and diseases, and interactions with other factors such as environment (temperature, rainfall), soil fertility and others (Avelino et al., 2006; Cooke, 2006). Apart from the yield reduction of a specific year, there can be reduction of the yielding capacity in the future, which in annual crops, for instance, is given by the negative effects of pathogens inoculum that remains in soil; whereas in perennial crops is given by the death of tissues and/or reduction of reserves (Zadoks and Schein, 1979). The economic valorization of losses needs basically the data of yield losses, but also other variables such as the costs of production, prices and other economic drivers (Nutter et al., 1993; Avelino et al., 2011) which may make difficult the task. To overcome these difficulties an holistic view is needed, involving multidisciplinary research (ecology, epidemiology, biology, agronomy, economics and others) (Savary et al., 2012).
1.2 Coffee crisis in America
The coffee sector in Latin America and the Caribbean is currently suffering one of its worse crises ever, due to the combination of negative climatic, biophysical and socioeconomic factors. Since 2012, there has been a noticeable reduction of coffee production caused especially by the outbreak of coffee leaf rust (Hemileia vastarix Berkeley and Broome); considered as a result of the combination of economic and climatic factors: the decreasing coffee prices and increasing production costs lead to a suboptimal management of coffee plantations, and at the same time, an important reduction of the diurnal thermal amplitude apparently favored the development of the pathogen (Avelino et al., 2015). Other reported problems were the use of susceptible coffee varieties to the disease; inadequate policies and lack of investment; and the lack of efficient research and extension services, which resulted in a deficient technical assistance and training to farmers (PROMECAFE, 2013). The decrease of production was estimated from 2% to 28% for the year 2012-2013, around 30% for 2013-2014, and the production continued low the following years since many plantations were stumped (Baker, 2014). This situation has reduced incomes of household economies for several years in a row and still threatens the food security of rural families direct and indirectly involved in coffee production, and almost broke several industries (FEWS-NET, 2014; Avelino et al., 2015).
Pests and diseases represent one of the main problems of coffee production, as the unexpected outbreak of coffee leaf rust. Although this disease is considered the most important in American coffee growing regions nowadays, there are also other diseases such as American leaf spot (Mycena citricolor Berk. and Curtis), brown eye spot (Cercospora coffeicola Berk. and Curtis), anthracnoses/dieback (Colletotrichum spp.) and others, and pests such as coffee berry borer (Hypothenemus hampei Ferrari) and leaf miner (Leucoptera coffeella Guérin-Mèneville), which constantly threaten the coffee production and even more since they were forgotten in order to attend in urgency coffee leaf rust (PROMECAFE, 2013).
Chapter 1. Problematic/Definitions/Research questions
5 Along with the decrease of coffee production, there is also a risk of degradation of biodiversity and ecosystem services in coffee growing areas. Important ecosystem services that agroforestry systems with perennial crops are capable to provide are: provision (coffee, fruits, timber, others), carbon sequestration, soil conservation, and regulation of pests and diseases (Beer et al., 1998b; Rice, 2011; Jha et al., 2014; Pumariño et al., 2015). However, since 1990 to the present, globally the areas for coffee have decreased in 8% and the intensification of coffee production has increased, involving the elimination of shade trees for simplification of agroforestry systems (Jha et al., 2014). For instance, 50% of coffee areas have disappeared in the Volcan Central Talamanca Biological Corridor in Costa Rica (Bosselmann, 2012), and 35% in southern Guatemala (Haggar et al., 2013). These reductions includes also the loss of trees and other vegetation, consequently involving the loss of biodiversity and ecosystem services (De Beenhouwer et al., 2013).
1.3 Research needs
From the scientific point of view, first there is a need to increase the knowledge on crop losses and their causes for making better decisions for integrated pest management (IPM), and for developing agroecosystems capable to balance good yields and regulate the impacts of pests and diseases through ecosystem services (Savary et al., 2006a; Avelino et al., 2011). The recent coffee rust crisis also highlighted the difficulty to assess the seriousness of the crisis due to the lack of knowledge on losses due to diseases; this lack of knowledge can explain that the responses in aid for farmers were slow in coming, particularly economic responses from international funding agencies (Avelino et al., 2015).
The main regional coffee organizations, technicians and scientific community in Latin America have demanded several actions to cope with the production decrease due to the current coffee crisis. Among them, there is a necessity to analyze the long term viability of the coffee crop, based on new studies on risks, costs, benefits and alternative production models, from full sun coffee to diverse coffee agroforestry systems; with the aim to develop adequate strategies for coffee production in the long term (PROMECAFE, 2013). There is also an urgent need to ensure that farming systems not only provide high yields, but also provide ecosystem services on which agriculture and farmer households depend (Cheatham et al., 2009; Vignola et al., 2015).
1.4 Definitions to state the scope of this research
The study of crop losses and their causes involves several key terms and concepts, which need to be clearly defined in order to facilitate the understanding of the objectives, the main results and their implications. In this research, the most recognized definitions in the literature related to crop losses were used; in case of important variations in the definition of a given term from different sources, the author established the most suitable definition according to the research questions and purposes. The key definitions for this research are described below.
Chapter 1. Problematic/Definitions/Research questions
6 1.4.1 Injury profile
An injury is any symptom or sign caused by a pathogen or pest, then, is any observable alteration of the normal healthy crop development (Nutter et al., 1993). An injury profile is a given combination of injury levels caused by a set of pests and diseases in a crop cycle (Savary et al., 2006b).
1.4.2 Crop loss
For some authors, crop loss is the reduction in quantity and/or quality of the crop yield (yield loss) due to biotic or abiotic factors, which can occur in the field (pre-harvest) or in the storage (post-harvest) (Oerke, 2006). Such reductions are also known as crop damage (Savary et al., 2012). For others, crop loss also includes the reduction in value and/or financial returns due to yield loss (Nutter et al., 1993).
This research is focused on pre-harvest losses caused mainly by biotic factors. Here therefore, crop loss is considered to involve yield losses caused by pests and diseases, as well as the monetary valorization of such losses.
1.4.3 Yield loss
Yield loss is the quantitative decrease of the crop yield caused by a single injury or by an injury profile. The yield loss is the difference between attainable yield and actual yield, and can be expressed in terms of weight or volume, or as relative yield loss (%) with respect to the attainable yield (Nutter et al., 1993; Savary et al., 2006b).
1.4.4 Attainable yield
Attainable yield is the yield without the negative effects of yield reducing factors (especially pests and diseases), limited only by yield defining factors (radiation, temperature, crop phenology and physiology) and limiting factors (water and soil nutrients) (Zadoks and Schein, 1979; Rabbinge, 1993; Savary and Willocquet, 2014). Under this broad definition, some authors define the attainable yield as the maximum yield registered at community or regional levels (Mueller et al., 2012; Wang et al., 2015). Others define attainable yield as the site-specific yield achieved under the environmental conditions of the site and with the best available production techniques to avoid biotic stress caused by pests (Nutter et al., 1993; Oerke et al., 1994). Others define the attainable yield as the yield achieved in a given production situation when the crop was not exposed to reducing factors such as pests, taking into account that for these authors the production situation is site-specific and includes a specific management (Savary et al., 2006b). Textual definitions of production situations are given in Table 1.1.
In this research, it is considered that the definitions of attainable yield given by Nutter et al. (1993) and Oerke et al. (1994), have two important similitudes: both consider that attainable yield is site specific and is achieved with the local production techniques, and both consider that it should be achieved in absence of pests. These
Chapter 1. Problematic/Definitions/Research questions
7 definitions are considered the most suitable for the approaches and objectives of the present research, and therefore are accepted.
Thus, for this research, an adapted definition of attainable yield is: the site-specific yield achieved under the local environmental conditions in combination with the available cropping practices (labors and inputs), trying to minimize the negative effects of pests and diseases. This definition implies that each plantation has its own attainable yield.
It is important to mention that the achievement of an attainable yield can involve high costs to control any pest or disease, and thus, would not be always the best economic yield; that is why this yield is considered to be theoretically independent from economic factors (Avelino et al., 2011).
Table 1.1. Definitions of attainable yield
Definition Source
“The attainable yield is the site-specific maximum yield that can be obtained under the geographic and ecological conditions at a location, using the best production techniques to avoid biotic stress. It is determined by, among other factors, climate, latitude and the variety grown. For the purposes of this study, it is defined as the yield attainable in the absence of pests using the site-specific methods of cultivation (‘no loss scenario’)”
(Oerke et al., 1994)
Attainable yield: “the site-specific yield obtained when crops are using all available pest control technologies to minimize biotic stress”
(Nutter et al., 1993) “Attainable yield: a reflection of a given production situation; the yield performance of a crop that
has not been exposed to yield-reducing factors, especially pests”
(Savary et al.,
2006b)
“Attainable yield (Yatt)—the highest yield in the surveyed region obtained from on-farm surveys” (Wang et al., 2015)
1.4.5 Actual yield
The definition of actual yield is consistent in the most important literature on crop losses, and so is also accepted in this research: the actual yield is the site-specific yield achieved using the available resources and current practices (labor and inputs) of the farmer, generally affected by pests and diseases (Nutter et al., 1993; Savary et al., 2006b; Savary and Willocquet, 2014). In this research, as well as for attainable yield, it is considered that each plantation has its own actual yield.
1.4.6 Economic loss
Economic loss, basically, is any reduction in economic benefits due to crop damage; the economic loss should also consider the costs of labor, materials and inputs for the control of pests and diseases applied to reduce damages (Savary et al., 2006b; Cheatham et al., 2009; Avelino et al., 2011). It is also mentioned that the economic loss should be calculated as the difference between the maximum economic profit and the economic profit obtained with the actual yield (Zadoks and Schein, 1979; Avelino et al., 2011). However, the assessment of the maximum economic profit (economic yield) is rather difficult because it is not necessarily determined by a maximum yield or by an attainable yield.
In this research, the scope of the estimation of economic losses goes up to the monetary valorization of the reduced yields (yield losses) due to pests and diseases.
Chapter 1. Problematic/Definitions/Research questions
8 1.4.7 Primary and secondary crop losses
Primary crop loss is the reduction of yield and/or quality of the crop product caused by pests and diseases in the current crop cycle; this loss may result in a loss of income and/or in increased production costs (Zadoks and Schein, 1979; Nutter et al., 1993).
Secondary crop loss is the “loss in yielding capacity of future crops” (Zadoks and Schein, 1979). In annual crops, secondary losses are caused by inoculums of pathogens that remained in soil, seeds or tubers which are going to reduce the yields of the new crop sowed in the same terrain; whereas in perennial crops, secondary losses are caused by defoliations and other negative physiological effects caused by pests and diseases, which lead to loss of vigor of plants and therefore reduce the production in the next years (Zadoks and Schein, 1979). For instance, in a perennial crop such as coffee, dead branches resulting from the attack of pests and diseases in a given year, are not going to bear fruits anymore, representing that way secondary losses (Avelino et al., 2015). In economic terms, secondary losses should include the loss of income and/or the costs to manage soil and seeds, costs of production and renewal of plantations if necessary (Nutter et al., 1993).
In this research, therefore, for a perennial crop such as coffee, it is considered that each year there are primary and secondary crop losses, with these definitions: primary crop loss is the loss caused by pest and disease injuries in the current harvesting year of coffee; and secondary crop loss is the loss resulting from negative impacts of pests and diseases injuries caused in the previous year.
1.4.8 Production situations
The production situation is a broad concept because it involves several conditions under which the crop is grown, which leads to some differences in its definition. Some authors consider that the production situation includes the social, physical, biological, economic and technical context where an agricultural production takes place; this definition includes the management (cropping system), in the sense that farmer´s skills are part of the production situation (Savary et al., 2006b). That means that a specific biophysical context may comprise several production situations and, as a consequence, that there is no necessarily a geographic continuity among plots belonging to the same production situation. Other authors consider that a production situation is defined by the biological, chemical, physical, socioeconomic and environmental conditions under which a crop is grown, excluding the management from the definition [(Aubertot and Robin, 2013) adapted from (Breman and de Wit, 1983)] but recognizing that in a given context of production, farmers do not apply the same management. Textual definitions of production situations are given in Table 1.2. Although including or excluding management from the definition of production situation may appear as being mostly part of a semantic debate, there are some key implications, particularly when defining the attainable yield. The attainable yield actually is the yield obtained in a given production situation with no pests and diseases. Depending on authors, crop management will be included or not when calculating attainable yield. In addition, pest and disease attack levels which are the result of the interaction between the physical and the biological environment (including the host plant and the pest or pathogen) and actions conducted by the farmer (Zadoks and Schein, 1979), a reflection
Chapter 1. Problematic/Definitions/Research questions
9 of socio-economic conditions, are then dependent on a production situation, or on a combination of a production situation and a particular management, depending on authors.
We retained the second meaning of production situation, i.e. with no crop management included, as used recently is studies related to the topic (Aubertot and Robin, 2013; Robin et al., 2013; Aouadi et al., 2015). The definition of production situation given by Aubertot and Robin (2013) adapted from Breman and de Wit (1983), enabled us to put the same emphasis in both production situations and management strategies. Besides, we considered that injury profiles, physiological conditions of coffee plants, yield and yield losses, are affected by a given combination of a production situation and a management strategy in each plantation. However, we maintained the idea that the attainable yield is dependent on crop management, which seems particularly true in perennial crops as coffee, where some characteristics of the plantation (plantation distances, shade type, aged the coffee tree) cannot or are difficult to be changed.
Thereby, in this research, the production situation is defined as the set of biological, chemical and physical components of the agroecosystem, and the socioeconomic and environmental (climate and topography) conditions under which the agroecosystem takes place. Soil fertility was considered as a chemical component. And, given that this research dealt with agroforestry systems, the type of shade (shade canopy) was included as an important biological component. A type of shade includes the botanical composition (species richness of herbaceous plants, bushes, palms and trees) and the structure (abundances, basal areas and shade cover) of the coffee shade canopy in this case. Given that this research was focused on the study of the crop (yields) and of injury profiles, both were excluded from the biological component of production situations. This latter decision is convenient when such components are the objects of study in order to put more emphasis on them, and to well differentiate them from other components in the study (Savary et al., 2006b).
Table 1.2. Definitions of production situation
Definition Source
“Production situation: the physical, biological, technical, social, and economic context in which
agricultural production takes place” (Savary 2006b) et al.,
We characterize the production situation of each field, that is, the set of factors—physical, biological, and socioeconomic—that determine agricultural production (7,22). The latter group of (socioeconomic) variables is assumed to be indirectly reflected by several characteristics of the patterns of cropping practices, such as inputs (fertilizers and pesticides), the method of crop establishment, weed control practices, and crop rotation
(Savary et al.,
2000b)
“A production situation has been defined as the bio-physical and socio-economic environment where agricultural production takes place (Penning de Vries & Van Laar 1982; Breman & De Wit 1983; Rabbinge & De Wit 1989). A production situation may thus be decomposed into components which account for the physical, biological, economic, social, and technological environment of agriculture”
(Savary et al.,
2016)
“Production situation is defined by the physical, chemical and biological components, except for the crop, of a given field (or agroecosystem) and its environment, as well as socio-economic drivers that affect farmer’s decisions (adapted from Breman & De Wit 1983)”
“In a given production situation, a farmer can design several cropping systems according to his goals, his perception of the socio-economic context and his environment, farm organization, knowledge and his cognition”
(Aubertot and Robin, 2013)
“The concept of production situation (PS) was defined as “the physical, chemical and biological components of a given field and its environment that are not directly managed by the farmer, as well as socio-economic drivers that affect his decisions (Aubertot and Robin, 2013 adapted from Breman and de Wit, 1983)”
(Aouadi et al.,
Chapter 1. Problematic/Definitions/Research questions
10 1.4.9 Management strategies
Each farmer makes decisions on what components he will establish/maintain in his plantation, and what cropping system he will apply according to his preferences, objectives and socioeconomic conditions. Therefore, in this research, it is considered that a management strategy is composed mainly by the agricultural practices and inputs (cropping system) applied to the agroecosystem; and that a management strategy can affect components of the system such as the crop, injury profile, soil, and the type of shade in the case of agroforestry systems. The management strategy can easily change from one year to another in terms of agricultural practices and inputs applied to the main crop of the system (coffee in this case); whereas it is difficult that the management affects the type of shade from one year to another. The strategy of maintaining a given type of shade usually is a long-term decision made by the farmer.
Related to management, the term management intensity was also used in this research. It was considered that: the more practices and inputs applied to the main crop (coffee), the more intensive the system.
1.5 The importance of injury profiles for crop loss assessments
It is assumed that each cropping system, which depends on the farmer´s decisions under a given production situation, leads to a particular injury profile (Aubertot and Robin, 2013); and each injury profile can have a specific impact on crop losses (Avelino et al., 2011). Both important statements mention the injury profile and not individual injuries, suggesting that analyzing the incidences or severity of only one pathogen and its impact on yields separately from other pathogens would not be enough for comparing different agroecosystems and determining which the best is for avoiding crop losses. For instance, an agroecosystem A could have less attack of a given disease than an agroecosystem B, but its crop loss could be higher due to other set of pathogens. Therefore, it is necessary to identify and analyze all the pests and diseases involved (injury profile), the management strategy and the production situation; and then, translate the impact of that injury profile in a crop loss data.
The study of injury profiles involves multiple pathosystems, and requires the intervention of several disciplines to be successful on giving the scientific bases for designing and implementing IPM (Savary et al., 2006a). For understanding and explaining injury profiles, it is necessary to study a range of cropping systems and production situations. Pest and disease outbreaks strongly depend on rainfall patterns and altitude which determines temperatures. In coffee agroecosystems, outbreaks also depend on important practices such as fertilization, pruning and regulation of shade, which are capable to modify the microclimate and the physiology of the crop (Avelino et al., 2004). Biophysical factors such as topography (inclination and orientation of the slope, altitude), distance between coffee rows, coffee tree height, type of shade (structure and composition) and shade percentage must be also measured, because they have effects on the development of pathogens (Avelino et al., 2007). The soil fertility can affect the nutritional status and vigor of coffee plants, and consequently has relationships with injury levels (Avelino et al., 2006). The relationship between biodiversity and pest and disease regulation is particularly important since there can be positive effects but also negative;
Chapter 1. Problematic/Definitions/Research questions
11 for this matter, it is important to determine both the functional diversity and the botanical composition of the system (Cheatham et al., 2009).
1.6 How to assess crop losses
Currently, there are several approaches and methods suggested to quantify, estimate, model, and to generate different types of knowledge on crop losses; they can be combined and applied for coffee losses research. Several types of knowledge are empirical environment-disease relationships, empirical disease-crop loss relationships, mechanistic simulation models–single disease, mechanistic simulation models–multiple diseases, risk zoning–disease prevalence, and production situation-based models; these types of knowledge are useful for making decisions of different categories: tactical–during season decisions, strategic–between season decisions, strategic–domains for management, and strategic–research priorities (Thornley and Johnson, 1990; Cooke, 2006; Savary et al., 2006b). Important tools for modeling such as the Injury Profile Simulator (IPSIM) using qualitative data (Aubertot and Robin, 2013), or the XPEST platform for modeling yield losses caused by injury profiles with quantitative data (Aubertot et al., 2014) are currently available for generating knowledge and predictions useful for designing innovative cropping systems as part of strategies for a better control of pests and diseases.
The assessment of crop losses becomes more complex in perennial crops such as coffee due to indirect effects of several diseases and their outbreaks impacts on the yields of following years. Crop losses caused by leaf diseases such as coffee leaf rust, American leaf spot or brown eye spot for instance, are harder to quantify because they do not affect directly the fruits like other pathogens do (e.g. coffee berry borer, anthracnose), but they do affect indirectly the production of fruits through alterations of the plant physiology (Avelino et al., 2006).
Besides, when quantifying crop losses in perennial crops, there can be involved together primary and secondary losses due to the effect of a pest or disease outbreak in previous years (Zadoks and Schein, 1979). Therefore, several methods should be utilized in order to assess the overall direct and indirect effects of injury profiles and to determine correctly what primary or secondary losses are.
Surveys, experiments and modeling are the most important methods to quantify crop losses. Results combining these methods could be stronger and more reliable than individual results of each one. Results of surveys and experiments can be incorporated in the modeling. The modeling of yield losses involving multiple pests and diseases rises as one of the main methods for a full understanding of the system and to hierarchize pathogens according to the damage they cause; such understanding is a key aspect for developing long-term strategies in order to determine where an IPM is needed, and for prioritizing the pests and/or diseases which needs further research (Savary et al., 2006b; Savary and Willocquet, 2014). That kind of models for assessing losses of tropical crops, including coffee, does not exist at the moment.
Chapter 1. Problematic/Definitions/Research questions
12 1.7 Regulation of pests and diseases and other ecosystem services
The regulation of pests and diseases is an ecosystem service that biodiversity can provide (MEA, 2005). However, in the case of coffee agroforestry systems, the associated plant biodiversity could have either positive or negative effects on the regulation of pathogens. On one hand, shade trees can hamper noxious pathogens by favoring their natural enemies, by forming barriers to the movement of infectious propagules or pests, and by modifying microclimate of the understory (Staver et al., 2001). Trees could also be capable to increase nutrients in soil, which are important to increase plant resistance to pests and diseases (Avelino et al., 2011). On the other hand, shade conditions (especially high dense shade) could favor the development of given pathogens including fungi and insects, and some trees and plants could be hosts of other pathogens (Avelino et al., 2007; López-Bravo et al., 2012).
The positive or negative effects of shade therefore could depend on the type of pathogen and on the structure of the shade canopy. The management of trees/bushes/palms could become a key aspect depending on the injury profile that is aimed to prevent or control. The effects of the heterogeneity of different trees or plant species on the presence of pathogens and their severities, can be determined by comparing the ecosystem services provision between coffee agroforestry systems and intensive coffee monocultures (Cheatham et al., 2009). Furthermore, the regulation of pests and diseases should be assessed through the quantification of avoided crop losses, which includes both yield losses and economic losses (Avelino et al., 2011).
Using biodiversity for pests and diseases control can provide other benefits crucial for future perspectives. For instance, the environment health and water quality of farms and communities would be better due to the reduction of the use of pesticides, along with better conditions for farm workers, animal biodiversity and even increase in carbon sequestration (Avelino et al., 2011). The reduction of farmer´s dependence on pesticides could also be achieved through the “vertical integration” (use of several control methods) and “horizontal integration” (management of a set of pests and diseases simultaneously) (Aubertot and Robin, 2013); regulation of pests and diseases can be part of both types of integration. Another reason for understand the role of biodiversity and ecosystem services is related to the situation of coffee farmers in the face of climate change. It is suggested that, among the adaptation measures of rural families’ livelihoods, it would be necessary to implement highly diversified coffee agroforestry systems, in order to regulate microclimates, to protect coffee plants from strong winds, high temperatures and long dry periods, and to diversify the source of products and incomes (Schroth et al., 2009; Jha et al., 2014).
Apart from the regulation of pests and diseases, there are other major ecosystem services of interest for farmers and for the society in general. For instance, diversified production in agroforestry systems become an important provisioning service, given that such systems, apart from the main crop product, can provide fruits, timber, firewood and others (Rice, 2008). The maintenance of soil fertility is another service of interest for the land owners, given that their production depends in great part on the state of this resource. For the society in general, the carbon sequestration is an essential service to contribute to the mitigation of climate change (MEA, 2005; Müller et al., 2015)
Chapter 1. Problematic/Definitions/Research questions
13 1.8 Justification of the research
This doctoral research has developed and combined methods original or suggested by the scientific literature in order to quantify and analyze coffee yield and economic losses, caused by injury profiles, in a range of management strategies and production situations. Experiments, surveys and modeling were combined to achieve that goal. The research took place in Turrialba, Costa Rica, an important coffee growing area where it is possible to find coffee being cultivated under different conditions of topography and altitudes, types of shade and management intensities. The main results were expected to be useful for a better understanding on how coffee losses occur, and to identify the combinations of management strategies and production situations in which coffee agroecosystems are capable to regulate pests and diseases, while providing other ecosystem services for smallholder farmers. This knowledge is necessary to design and manage sustainable agroecosystems.
1.9 Research questions and hypotheses
Major research question: What is the impact of injury profiles on coffee yield and economic losses under different management strategies and production situations?
Major hypothesis: Pests and diseases can be the same in coffee agroecosystems, but the management strategies and production situations affect the injury profile and its impact on yield and economic losses.
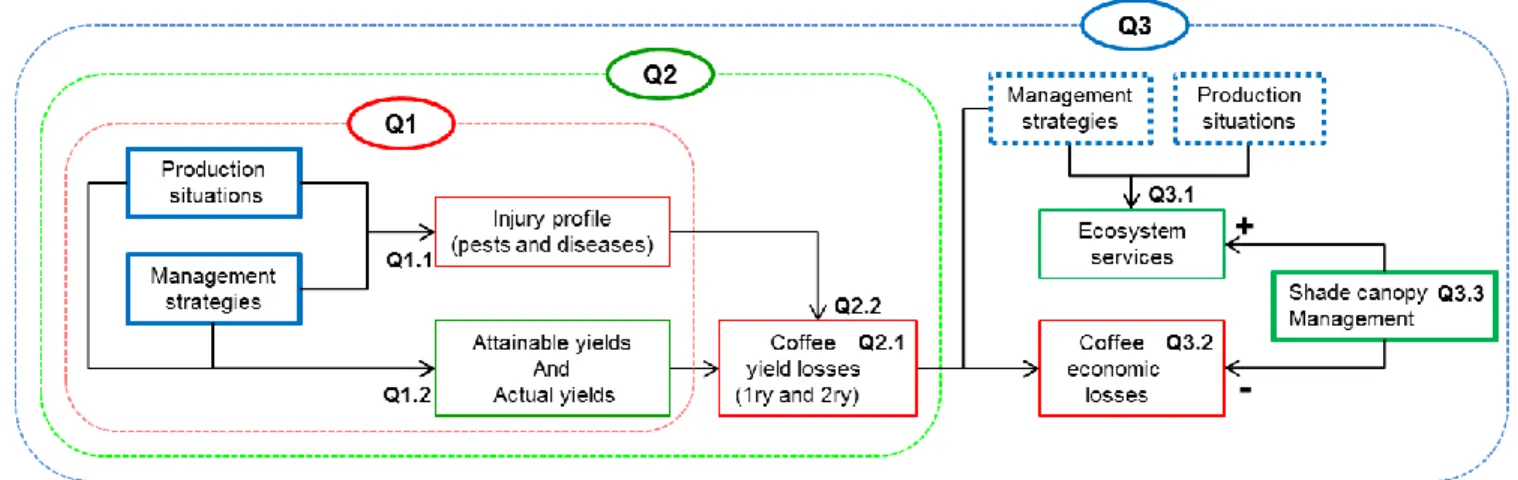
The main research questions and intermediary questions are listed here and they can also be located in a scheme showing the variables and relationships studied in this research (Fig. 1.1):
Q1 What is the impact of management strategies and production situations on pests and diseases and coffee yields?
The following hypothesis and intermediary questions are addressed in chapters 3 and 5
Hypothesis: The levels of pests and diseases injuries, and coffee yields, depend mainly on the interactions between management intensity and the type of shade of coffee agroecosystems
Q1.1 What is the impact of management strategies and production situations on pests and diseases injuries? chapter 3
Q1.2 What is the impact of management strategies and production situations on actual yields and attainable yields? chapters 3 and 5
Q2 How do coffee yield losses caused by injury profiles vary in function of management strategies and production situations?
The following hypothesis and intermediary questions are addressed in chapters 4 and 5
Hypothesis: The impacts of injury profiles on coffee yield losses differ from one year to another, depending on various combinations of management strategies and production situations
Q2.1 How to estimate, by experimentation and modeling, primary and secondary coffee yield losses caused by pests and diseases? chapter 4
Chapter 1. Problematic/Definitions/Research questions
14 Q2.2 What is the impact of injury profiles on primary and secondary coffee yield losses from one year
to another, under different management strategies and production situations? chapter 5
Q3 Which types of coffee agroecosystems are capable to obtain the lowest coffee losses (yield and economic) and highest overall benefits (ecosystem services)?
The following intermediary questions are addressed in chapters 3 and 6
Q3.1 What is the effect of management strategies and production situations on the provision of ecosystem services (provisioning of agroforestry products, carbon sequestration, soil fertility, regulation of pests and diseases)? chapter 3
Q3.2 What are the economic losses caused by pests and diseases? chapter 6
Q3.3 What are the shade canopy and management characteristics of the coffee agroecosystems capable to obtain the lowest coffee losses and highest ecosystem services? chapter 6
See the main questions and intermediary questions (Q) in section 1.9
Fig. 1.1. Scheme of the variables and relationships studied in order to respond the main and intermediary research questions
15
PART II. MATERIALS AND METHODS
16
Chapter 2. Materials and methods
2.1 General strategy to respond the research questions
This research was developed through two experimental designs whose results were articulated in order to respond the research questions. The first was an experimental coffee parcel at full sun, with different controlled treatments to control pests and diseases during three years. This experiment was funded by the project DAMAGE (INRA, SMaCH metaprogram) and was called Coffee Losses (CoLosses). The second experimental design was based on surveys in different coffee plots of small farmers under a range of production situations and management strategies during two years. Such plots conformed a coffee research plots network, which was called CASCADE, given that it was part of the CASCADE project (“Ecosystem-based Adaptation for Smallholder Subsistence and Coffee Farming Communities in Central America”) funded by the International Climate Initiative (ICI). Results of both experimental designs derived from several analyses and modeling enabled to respond the research questions one and two (Q1 and Q2); analysis of ecosystem services in CASCADE permitted to respond research question three (Q3).
CoLosses was dedicated to:
Calculate primary and secondary yield losses jointly and separately through the comparison of different treatments, and determine the proportions of primary and secondary losses (Q2.1).
Identify, through modeling techniques, the most important and easily measurable predictors of yields and yield losses (Q2.1).
Articulating the findings in CoLosses with the analyses in CASCADE:
CoLosses offered key insights and recommendations to develop models for the estimation of primary and secondary coffee yield losses caused by pests and diseases. The most important predictors of yield and yield losses identified in Colosses, were used in CASCADE to develop statistical models for the estimation of primary and secondary yield losses in each plot of this network.
Observations and learnings from the field work in both CoLosses and CASCADE, combined with information in the scientific literature and with the knowledge of the author and advisors of this research, permitted to develop conceptual models to guide the analysis of data to respond all research questions. Such conceptual models (in chapters 4 and 5) also became an important contribution to the field of crop loss research.
CASCADE was dedicated to:
CASCADE was useful to determine, in conditions of small farmers, the relationships of a range of production situations and management strategies with individual injury levels of pests and diseases,
Chapter 2. Materials and methods
17 injury profiles, coffee yields and yield losses. Results were useful to discuss and respond Q1.1, Q1.2.and Q2.2.
Data on cropping practices (labor, inputs, costs), overall agroforestry production (coffee, bananas, other fruits, timber, and their prices) and biophysical measurements were used to assess several ecosystem services as overall benefits (provisioning of products for families, carbon sequestration, maintenance of soil fertility, regulation of pests and diseases). Then, analysis of effects of management strategies and production situations on ecosystem services were performed to respond Q3.1.
Based on yield losses and the local prices of coffee, it was possible to estimate the economic yield losses in conditions of small farmers, in order to respond Q3.2.
Using the data of yield and economic losses, and on ecosystem services, the most promising coffee agroecosystems were identified and described, in order to respond Q3.3.
2.2 Coffee Losses Experiment (CoLosses)
2.2.1 Location and establishment
A coffee experimental parcel at full sun exposure (960 m2 in total) was established in a flat terrain in the farm
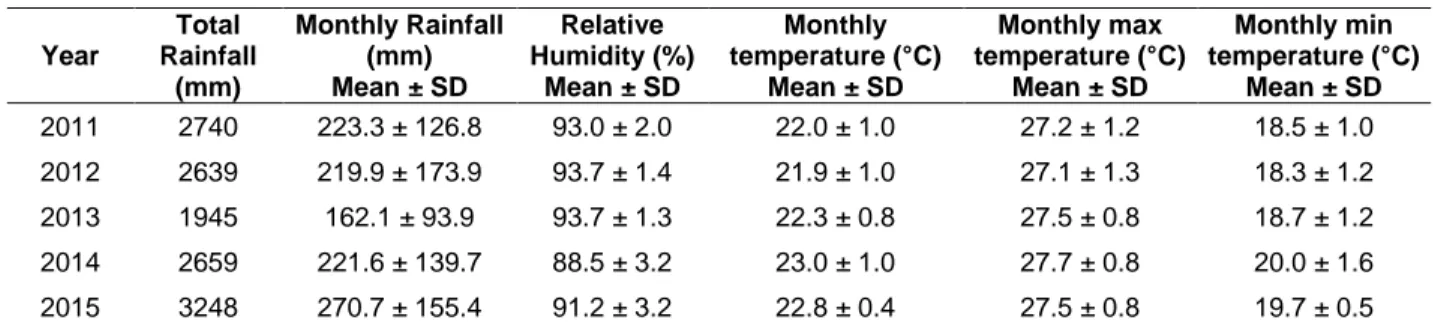
of the Tropical Agricultural Research and Higher Education Center (CATIE), Turrialba, Costa Rica (Lechevallier, 2013). The parcel was planted in 2010, and the experiment began in year 2013 and lasted until 2015. The parcel was located in the coordinates 9°53’11.24’’N and 83°40’07.94’’O, at 648 meters above sea level (m.a.s.l.). Turrialba is a rainy area all year long, with slightly dry periods in March and April, and highly rainy periods in June and July. In the last ten years, the mean total annual rainfall was 2781 mm and the mean annual temperature was 22.2°C. In the years on the experiment, there were more noticeable differences in the amounts of rainfall (especially in 2015), while temperatures and relative humidity were similar (Table 2.1).
Table 2.1. Climate characteristics in Turrialba, Costa Rica (2011-2015)
Year Total Rainfall (mm) Monthly Rainfall (mm) Mean ± SD Relative Humidity (%) Mean ± SD Monthly temperature (°C) Mean ± SD Monthly max temperature (°C) Mean ± SD Monthly min temperature (°C) Mean ± SD 2011 2740 223.3 ± 126.8 93.0 ± 2.0 22.0 ± 1.0 27.2 ± 1.2 18.5 ± 1.0 2012 2639 219.9 ± 173.9 93.7 ± 1.4 21.9 ± 1.0 27.1 ± 1.3 18.3 ± 1.2 2013 1945 162.1 ± 93.9 93.7 ± 1.3 22.3 ± 0.8 27.5 ± 0.8 18.7 ± 1.2 2014 2659 221.6 ± 139.7 88.5 ± 3.2 23.0 ± 1.0 27.7 ± 0.8 20.0 ± 1.6 2015 3248 270.7 ± 155.4 91.2 ± 3.2 22.8 ± 0.4 27.5 ± 0.8 19.7 ± 0.5
SD: standard deviation; max: maximum; min: minimum. Source: Weather station of the Tropical Agricultural and Higher Education Center (CATIE).
Chapter 2. Materials and methods
18 2.2.2 Experimental design
All coffee plants (Coffea arabica L.) in the experimental parcel were of the dwarf variety Caturra, with a density of 5000 plants per hectare (2m between coffee rows and 1m between plants). The first two years of coffee plants growth, the entire parcel received the same adequate management: three fertilizations, three applications of chemical fungicides and three applications of herbicides yearly. During the experiment, only the fungicide applications varied, the fertilizations and herbicide applications were always the same, and one pruning per year was done (leaving between two and four productive stems each year).
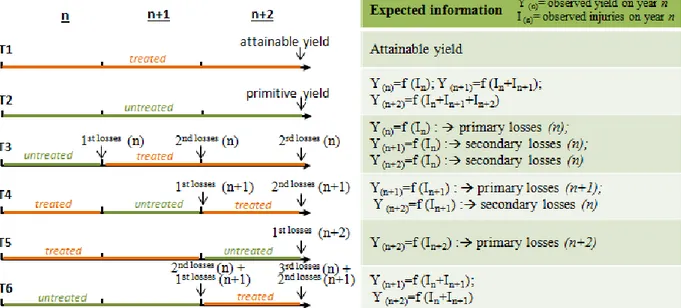
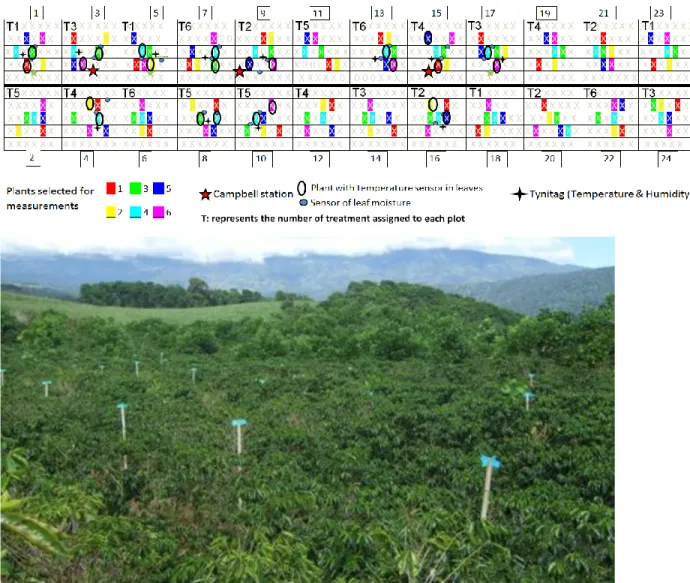
The experiment had six treatments, each one consisting in the application (treated) or not application (untreated) of chemical pesticides yearly, during three years (Fig. 2.1). The chemical pesticides, the dosages and times of applications each year are described in Table 2.2. The experimental design was composed by 24 plots in total (40 m2 each plot): six randomized treatments and each one with four replicates.
Treatments consisted in pesticide applications in order to avoid injuries caused by pests and diseases. Y(n) is the observed yield in year n,
and I(n) is the observed injuries in year n