DES16C3cje: A low-luminosity, long-lived supernova
C. P. Guti´errez,
1?M. Sullivan,
1L. Martinez,
2,3M. C. Bersten,
2,3,4C. Inserra,
5M. Smith,
1J. P. Anderson,
6Y.-C. Pan,
7A. Pastorello,
8L. Galbany,
9P. Nugent,
10C. R. Angus,
11C. Barbarino,
12D. Carollo,
13T.-W. Chen,
14T. M. Davis,
15M. Della Valle,
16,17R. J. Foley,
18M.
Fraser,
19C.
Frohmaier,
20S.
Gonz´alez-Gait´an,
21M.
Gromadzki,
22E.
Kankare,
23R. Kokotanekova,
17J. Kollmeier,
24G. F. Lewis,
25M. R. Magee,
26K. Maguire,
26A. M¨oller,
27N. Morrell,
28M. Nicholl,
29,30M. Pursiainen,
1J. Sollerman,
12N. E. Sommer,
31E. Swann,
20B. E. Tucker,
31P. Wiseman,
1M. Aguena,
32,33S. Allam,
34S. Avila,
35E. Bertin,
36,37D. Brooks,
38E. Buckley-Geer,
34D. L. Burke,
39,40A. Carnero Rosell,
41,33M. Carrasco Kind,
42,43J. Carretero,
44M. Costanzi,
45,46L. N. da Costa,
33,47J. De Vicente,
41S. Desai,
48H. T. Diehl,
34P. Doel,
38T. F. Eifler,
49,50B. Flaugher,
34P. Fosalba,
51,52J. Frieman,
34,53J. Garc´ıa-Bellido,
35D. W. Gerdes,
54,55D. Gruen,
56,39,40R. A. Gruendl,
42,43J. Gschwend,
33,47G. Gutierrez,
34S. R. Hinton,
15D. L. Hollowood,
18K. Honscheid,
57,58D. J. James,
59K. Kuehn,
60,61N. Kuropatkin,
34O. Lahav,
38M. Lima,
32,33M. A. G. Maia,
33,47M. March,
62F. Menanteau,
42,43R. Miquel,
63,44E. Morganson,
43A. Palmese,
34,53F. Paz-Chinch´on,
42,43A. A. Plazas,
64M. Sako,
62E. Sanchez,
41V. Scarpine,
34M. Schubnell,
55S. Serrano,
51,52I. Sevilla-Noarbe,
41M. Soares-Santos,
65E. Suchyta,
66M. E. C. Swanson,
43G. Tarle,
55D. Thomas,
20T. N. Varga,
14,67A. R. Walker,
68R. Wilkinson
69(DES Collaboration)
Affiliations are listed at the end of the paperAccepted XXX. Received YYY; in original form ZZZ
ABSTRACT
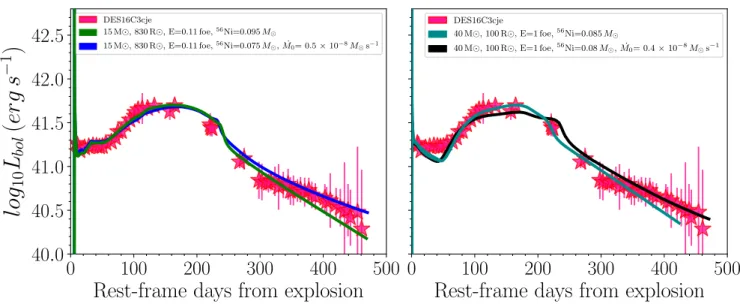
We present DES16C3cje, a low-luminosity, long-lived type II supernova (SN II) at red-shift 0.0618, detected by the Dark Energy Survey (DES). DES16C3cje is a unique SN. The spectra are characterized by extremely narrow photospheric lines corresponding to very low expansion velocities of . 1500 km s−1, and the light curve shows an initial peak that fades after 50 days before slowly rebrightening over a further 100 days to reach an absolute brightness of Mr ∼ −15.5mag. The decline rate of the late-time light curve is then slower than that expected from the powering by radioactive decay of56Co, but is comparable to that expected from accretion power. Comparing the bolometric light curve with hydrodynamical models, we find that DES16C3cje can be explained by either i) a low explosion energy (0.11 foe) and relatively large 56Ni production of 0.075 M from a ∼ 15 M red supergiant progenitor typical of other SNe II, or ii) a relatively compact ∼ 40 M star, explosion energy of 1 foe, and 0.08 M of56Ni. Both scenarios require additional energy input to explain the late-time light curve, which is consistent with fallback accretion at a rate of ∼ 0.5 × 10⁻⁸M
s−1.
Key words: supernovae: general — supernovae: individual (DES16C3cje)
1 INTRODUCTION
Recent wide-field sky surveys have revealed a significant diversity in the observed properties of supernovae (SNe).
? E-mail: [email protected]
These events have covered a wide range of observed charac-teristics: transients with extremely bright luminosities (e.g., superluminous SNe,Gal-Yam 2012); transients with a rapid temporal evolution spanning a range of luminosities (e.g.,
Perets et al. 2010;Kasliwal et al. 2012;Drout et al. 2014;
Pursiainen et al. 2018), and a heterogeneous population of
transients with a slow temporal evolution (e.g.,Taddia et al. 2016;Arcavi et al. 2017; Terreran et al. 2017). These new SN discoveries have in turn created new challenges for the SN field, particularly concerning the SN progenitor and the physics of the explosion.
In the canonical picture of a core-collapse SN, the explo-sion releases ∼ 1051erg of energy (1 foe), and a fraction of the
progenitor’s material is burned into various intermediate-mass and iron-peak elements. The early emission from SNe, defined as the cooling phase, is powered by the release of shock deposited energy, while the power source from the peak to late-phases is provided by the decay of56Ni into56Co
and subsequently56Fe. In slow- and fast-declining hydrogen-rich SNe (historical SNe IIP and SNe IIL, respectively), the cooling phase is followed by a hydrogen recombination phase, where the luminosity evolves more slowly until it be-comes dominated by the energy released during the decay of radioactive material. However, some core-collapse SNe have larger luminosities, which typically require an addi-tional source of energy to explain them (see review, and references therein, of Moriya et al. 2018a). Pair-Instability SNe (PISNe; e.g. Heger & Woosley 2002; Gal-Yam et al. 2009), magnetars (e.g.Kasen & Bildsten 2010; Bersten & Benvenuto 2016), accretion power (e.g.Moriya et al. 2010;
Dexter & Kasen 2013), and pulsational pair-instability (PPI; e.g.Woosley et al. 2007;Woosley 2017) have all been pro-posed as a source of additional energy, but as yet there is no clear consensus about the relative importance of each source nor associations to specific transients.
Recently, two peculiar type II SNe (SNe II) have been studied in detail: iPTF14hls (Arcavi et al. 2017;Sollerman et al. 2019) and OGLE-2014-SN-073 (Terreran et al. 2017). iPTF14hls is a SN with very little spectral evolution over ∼ 600days, and with a light curve that shows multiple re-brightening events. OGLE-2014-SN-073 is a very bright SN with an unusually broad light curve, combined with high ejecta velocities in its spectra. Both objects exploded in low-luminosity galaxies and require an extra source of power (beyond shock energy and radioactivity) to explain their un-usual evolution.
Popular scenarios invoked to explain the peculiar be-haviour of these two transients are a magnetar (Dessart 2018;Orellana et al. 2018;Woosley 2018), PISNe (Woosley 2018), circumstellar interaction (Andrews & Smith 2018;
Woosley 2018) and fallback accretion (Arcavi et al. 2017;
Moriya et al. 2018b;Wang et al. 2018).Moriya et al.(2018b) found the latter scenario can reproduce the shape of the light curve, luminosity and photospheric velocities of OGLE-2014-SN-073, while Arcavi et al. (2017) and Wang et al.
(2018) proposed that iPTF14hls may be powered by inter-mittent fallback accretion. The idea of fallback in SNe was introduced byColgate(1971), and has been broadly studied to determine its effects on the central remnant (e.g. Cheva-lier 1989;Woosley & Weaver 1995;Fryer 1999), and on SN light curves (e.g.Fryer et al. 2009;Moriya et al. 2010; Dex-ter & Kasen 2013).Dexter & Kasen(2013) showed that the accretion power may be relevant to explain peculiar and rare SNe.
In this paper, we present the photometry and spectra of DES16C3cje, an unusual SN II discovered by the Dark En-ergy Survey Supernova Program (DES-SN;Bernstein et al. 2012). We discuss its peculiar characteristics and examine
the late-time light curve under the fallback scenario. In Sec-tion2we describe our observations of DES16C3cje and mea-surements. We analyse the spectral and photometric proper-ties and compare them with other similar events in Section3, and then discuss the progenitor scenarios that could explain the event in Section4. We discuss and conclude in Section5. Throughout, we assume a flat ΛCDM universe, with a Hub-ble constant of H0= 70 km s−1Mpc−1, and Ωm=0.3.
2 OBSERVATIONS
DES16C3cje was detected by DES using the wide-field Dark Energy Camera (DECam; Flaugher et al. 2015) in-strument in an r-band image taken on 2016 October 11 (JD = 2457673.3) with an apparent magnitude of r = 23.26mag. The transient was located at α = 03h28m35.s29, δ = −27◦
09006.006 (J2000.0) in a faint host galaxy (Mr ∼
−18.5mag) at a redshift of 0.0616. The previous non-detection with DES was obtained on 2016 October 7 (MJD= 57667.6), with a detection limit of z ∼ 25.1 mag. This limit places a constraint on the explosion epoch of ±2.6 days; we adopt 2016 October 9 (the intermediate epoch; MJD= 57670.2 ± 2.6 d) as the explosion date. Further infor-mation on the DES-SN difference-imaging search pipeline and machine-learning algorithms to identify transient ob-jects can be found in Kessler et al. (2015) and Goldstein et al.(2015).
Photometric coverage of DES16C3cje was acquired by DES-SN in griz filters from 2016 October until 2017 Febru-ary, and then from 2017 August to 2018 February. Between 2017 February and 2017 July, additional photometric data were obtained by the extended Public European Southern Observatory (ESO) Spectroscopic Survey for Transient Ob-jects (ePESSTO; Smartt et al. 2015) and other collabora-tors with the ESO Faint Object Spectrograph and Cam-era 2 (EFOSC2; Buzzoni et al. 1984) at the 3.6m ESO New Technology Telescope (NTT), with the FOcal Re-ducer/low dispersion Spectrograph 2 (FORS2;Appenzeller et al. 1998) at the ESO Very Large Telescope (VLT), with the Low Dispersion Survey Spectrograph 3 (LDSS3; Osip et al. 2004) on the Magellan Clay 6.5-m telescope, and with the the Gamma-Ray Burst Optical/Near-Infrared Detector (GROND;Greiner et al. 2008), at the 2.2-m MPG telescope at the European Southern Observatory (ESO) La Silla Ob-servatory.
The NTT data were reduced using the PESSTO pipeline (Smartt et al. 2015), while for the FORS2 images we used the esoreflex pipeline (Freudling et al. 2013). Reduc-tions for data obtained with LDSS3 were performed with Im-age Reduction and Analysis Facility (iraf;Tody 1986) using standard routines. Images from the MPG were reduced with the GROND pipeline (Kr¨uhler et al. 2008). The DES photo-metric measurements were made using the pipeline discussed byPapadopoulos et al.(2015) andSmith et al.(2016), which has also been extensively used in the literature (e.g.,Firth et al. 2015, and references therein). This pipeline subtracts a deep template image from each individual DES image to remove the host-galaxy light using a point-spread-function (PSF) matching routine. SN photometry is then measured from the difference image using a PSF-fitting technique. The photometry of DES16C3cje is reported in AppendixA1.
DES16C3cje was observed spectroscopically on six epochs from +47 to +403 days (throughout the paper, we give all epochs relative to the explosion epoch). These obser-vations were obtained with four different instruments: The AAOmega spectrograph at the Anglo-Australian Telescope (AAT), X-SHOOTER (Vernet et al. 2011) and FORS2 at the VLT, and Gemini Multi-Object Spectrograph (GMOS-S; Hook et al. 2004) at the Gemini Observatory. A log of the spectroscopic observations of DES16C3cje is reported in Table1. Spectroscopic reductions for X-SHOOTER were performed using the esoreflex pipeline, FORS2 data were reduced with iraf using standard routines, while for GMOS-S we used the Gemini iraf package, combined with idl rou-tines to flux calibrate the data and remove telluric lines.
3 CHARACTERIZING DES16C3CJE 3.1 Host galaxy properties
The host galaxy of DES16C3cje was identified as PGC3243310, a low-luminosity galaxy (MhostB = −18.26 ± 0.50mag1) at a redshift of 0.06182. Adopting the reces-sional velocity corrected into the CMB frame3 (v= 18465 ± 89km s−1), we obtain a distance of 275.95 Mpc, which
cor-responds to µ = 37.20. The galactic reddening in the di-rection of PGC3243310 is E(B − V)= 0.17 mag (Schlafly & Finkbeiner 2011). Due to the faintness of the galaxy and the absence of the absorption Na i D lines in the SN spectra, we assume the host extinction negligible.
Using a spectrum obtained by OzDES with the AAOmega at the AAT (see Sec.3.4) and a spectrum from the 2dF Galaxy Redshift Survey (Colless et al. 2003), we es-timate the integrated oxygen abundance. The lack of [N ii] suggests a very low metallicity. Setting the upper limits of the flux ratio of Hα/[[N ii]λ6583 and measuring the ra-tio of [O iii]λ5007/Hβ, we estimate the upper limit of the metallicity. Applying the O3N2 diagnostic method from
Marino et al. (2013), we obtain an oxygen abundance of 12+ log(O/H) < 8.19 ± 0.02. With the luminosity of Hα and the equation ofKennicutt & Evans(2012), we calculate the SFR to be 0.042 M yr−1.
3.2 Light curves
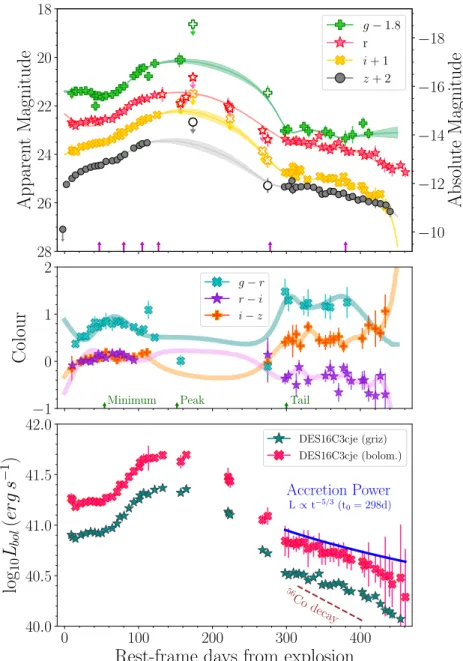
The unusual photometric evolution of DES16C3cje from ∼ +2 to +450 days is presented in Figure 1 (top panel). The light curves show an initial increase in brightness for the first 20 days followed by a decrease, particularly in the bluer filters, as observed in some SNe II (e.g., SN 2004em, SN 2004ek;Taddia et al. 2016). In the redder bands, the lu-minosity increase monotonically, with a change in the slope at ∼ 60 days. After 60 days, the g-band increases ∼ 1.4 mag over 70 days versus ∼ 1.0 mag in riz.
We use Gaussian processes (GPs) to interpolate the observed light curves (see de Jaeger et al. 2017; Inserra
1 http://leda.univ-lyon1.fr/
2 Redshift obtained from the narrow emission lines of the host galaxy
3 http://ned.ipac.caltech.edu/
et al. 2018b;Angus et al. 2019, for more details). The in-terpolation was performed with the Python package GEORGE (Ambikasaran et al. 2016) using the Matern 3/2 kernel. We find that DES16C3cje reaches a peak brightness of ∼ −15.75 ± 0.10mag at 152 ± 5 days in the r-band. The long rise is reminiscent of SN 1987A, but over a longer scale; this behavior has not previously been observed in a SN II light curve. During the later phases (after ∼ 300 days), the light curves show a linear decline in riz and a flat evolution in the g-band. The slope of the decline in the r-band light curve is 0.70 mag per 100 days, smaller than that expected from the full trapping of gamma-ray photons and positrons from the decay of56Co (0.98 mag per 100 days;Woosley et al. 1989).
In the middle panel of Figure 1, the colour curves are presented. During the first 65 days (in the plateau), DES16C3cje becomes redder, changing from g − r= 0.37 to g − r= 0.85. The SN then evolves to bluer colours. At late-phases (> +300 days), the object has a redder colour than during the first two months, but its evolution is relatively flat.
3.3 Bolometric luminosity and Nickel mass
Using the griz photometric data, we compute the pseudo-bolometric and pseudo-bolometric light curves for DES16C3cje (Fig-ure 1, bottom panel) following the prescriptions presented byInserra et al.(2018a). In this method, the griz bands are converted into fluxes at the effective filter wavelengths, and then corrected for the Milky Way extinction (presented in Section3.1). A spectral energy distribution (SED) is then computed over the wavelengths covered and the flux under the SED is integrated assuming zero flux beyond the inte-gration limits. Fluxes are converted to luminosities using the adopted distance (275.95 Mpc). We determined the points on the pseudo-bolometric light curves at epochs when griz were available simultaneously. Magnitudes from the missing bands were generally estimated by interpolating or extrap-olating the light curves using low-order polynomials (n≤3) and assuming constant colours from nearest epochs. There-fore, we obtain a peak luminosity of Lbol = (4.96 ± 0.10) ×
1041erg s−1, and L
gr iz = (2.33 ± 0.08) × 1041erg s−1.
As expected based on the photometric data, the bolo-metric light curves decline slowly at late phases. This decline rate is slower than the radioactive decay of56Co, but
com-parable to that expected from accretion power. Although the light curve tail does not follow the56Co decay, we can still use the luminosity at late times to estimate an upper limit to the56Ni mass. Comparing the bolometric light curve of DES16C3cje to that of SN 1987A, we estimate the56Ni
mass, M(56Ni)
16cje, as follows:
M(56Ni)16cje≈ M(56Ni)87A×
L16cje
L87A M ,
(1)
where M(56Ni)
87A= 0.075 ± 0.005 M is the56Ni mass
syn-thesised by SN 1987A (Arnett 1996) and L87A is the
bolo-metric luminosity at a comparable epoch. This comparison gives M(56Ni)16cje ≈ 0.068M , a comparatively large value for typical SN II, but within the range of SN 1987A-like ob-jects (M¨uller et al. 2017;Anderson 2019).
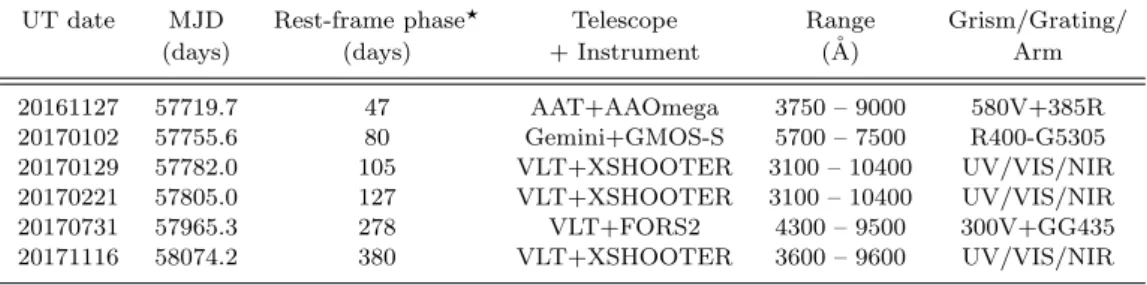
Table 1.Spectroscopic observations of DES16C3cje.
UT date MJD Rest-frame phase? Telescope Range Grism/Grating/
(days) (days) + Instrument (˚A) Arm
20161127 57719.7 47 AAT+AAOmega 3750 – 9000 580V+385R 20170102 57755.6 80 Gemini+GMOS-S 5700 – 7500 R400-G5305 20170129 57782.0 105 VLT+XSHOOTER 3100 – 10400 UV/VIS/NIR 20170221 57805.0 127 VLT+XSHOOTER 3100 – 10400 UV/VIS/NIR 20170731 57965.3 278 VLT+FORS2 4300 – 9500 300V+GG435 20171116 58074.2 380 VLT+XSHOOTER 3600 – 9600 UV/VIS/NIR
?The phase is relative to the estimated explosion date, MJD= 57670.2 ± 2.6 d.
3.4 Spectral evolution
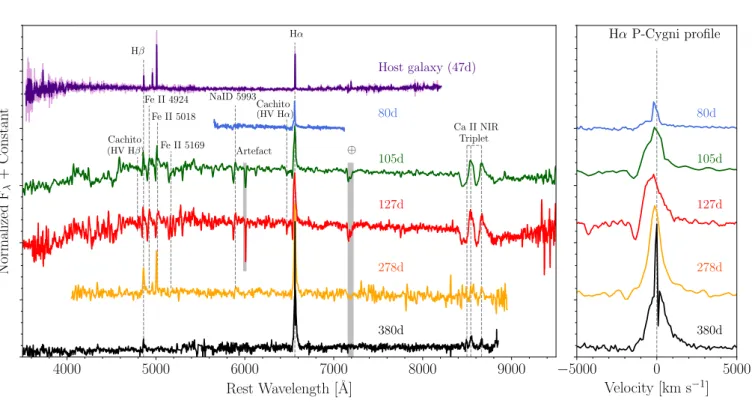
In Figure 2, we present the optical spectra obtained for DES16C3cje between +47 d and +380 d. At 47 d, the spec-trum is completely dominated by the emission lines from the host galaxy, with no traces of the SN. From 80 d, the spectra show that DES16C3cje is a SN II with very narrow photospheric lines. At 80 d and 127 d, DES16C3cje presents characteristic P-Cygni profiles of Hα, Hβ, Fe ii λ4924, Fe ii λ5018, Fe ii λ5169, Na i D λ5893 and the Ca ii near-IR triplet, together with a lack of Sc ii and Ba ii lines. The ‘Cachito’ feature, related to high velocity (HV) spectra components (Guti´errez et al. 2017), are also visible at these epochs, sug-gesting an interaction between the SN ejecta and circum-stellar material (CSM). The later spectra are dominated by Hα, with a weak contribution of the Ca ii near-IR triplet in emission. There is no evidence of forbidden lines (e.g., [O i] λλ6300, 6363, [Fe ii] λ7155 and [Ca ii] λ7291, 7323), which are typical of core-collapse SNe at late phases. The lack of these lines could suggest either a high density associated with a large mass and low-velocity or an interaction between the SN ejecta and the CSM (Sec.5).
DES16C3cje shows a complex Hα P-cygni profile (Fig-ure2, right panel). At early times (spectra between 80 d and 127 d), the absorption component increases in strength with time, from 3.8 ± 0.5 ˚A to 8.5 ± 1.2 ˚A; however, at 278 d and 380 d, this component is absent. The emission component at earlier times shows a Gaussian profile with an extra nar-row emission line, caused by a contaminating H ii region. At late times, the Hα emission has a Lorentzian profile with a FWHM velocity of 815 ± 65 km s−1 at 295 d, increasing to 980 ± 55km s−1at 403 d. The absence of the absorption
com-ponent, and the Lorentzian profile in emission, further in-dicate interaction between the ejecta and the CSM (Chugai et al. 2004). At 380 d, on the top of the emission component of the Hα, a small notch is observed; upon close examination this was revealed to be residuals from the galaxy subtrac-tion4.
Based on the width of the lines observed in the SN spectra, we infer very low expansion velocities. The ve-locity obtained for Hα decreases from ∼ 1500 km s−1 at
80 d, to ∼ 1300 km s−1 at 127 d. The velocities found for other lines show a similar behavior: low expansion veloci-ties (< 2000 km s−1), and little evolution.
4 The expansion velocities and the pseudo-equivalent-widths were measured removing the contribution of the host galaxy.
3.5 Comparison to other supernovae
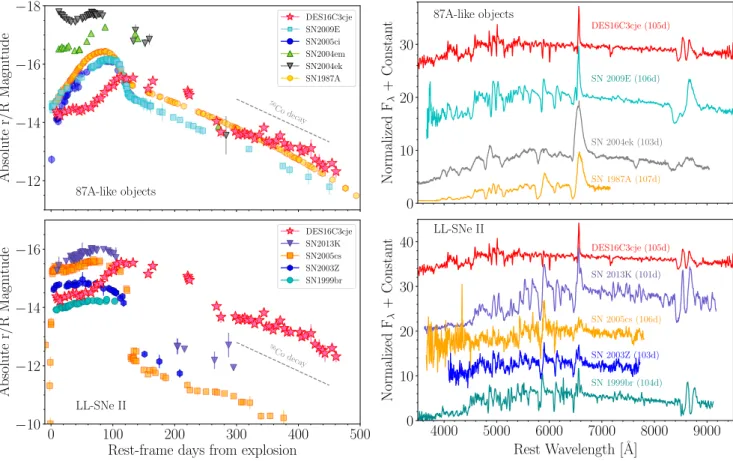
The slow rise of DES16C3cje is reminiscent of SN 1987A-like objects, whereas its low luminosity and low expansion velocities are a common characteristic in low luminosity (LL) SNe II. In Figure3, we show the photometric and spectral comparison of DES16C3cje with these two classes of events. For the SN 1987A-like objects we compared with SN 1987A (Bouchet et al. 1989;Hamuy & Suntzeff 1990), which is the best observed and studied SN II; SN 2004ek (Taddia et al. 2016) and SN 2004em (Taddia et al. 2016), which both show a plateau before the main peak; SN 2005ci (Taddia et al. 2016) and SN 2009E (Pastorello et al. 2012), which are the faintest clones of SN 1987A. For the LL SNe II, we select objects with spectra at around 110 days: SN 1999br ( Pas-torello et al. 2004;Galbany et al. 2016;Guti´errez et al. 2017), which is the faintest slowly-declining SN II; SN2003Z (Spiro et al. 2014;Faran et al. 2014), SN 2005cs (Pastorello et al. 2006, 2009), and SN 2013K (Tomasella et al. 2018), which all have good photometric coverage in the first 150 days. The long rise to peak is common between the SN1987A-like events and DES16C3cje; however, the rise is even longer for DES16C3cje.
The full light curve evolution shows that DES16C3cje, from explosion to 60 d, exhibits a initial ‘plateau’. Although this plateau is not common in SN1987A-like objects, two other SNe do show it: SN 2004ek (in the V and R-bands) and SN 2004em (in the I−band,Taddia et al. 2016).Taddia et al. (2016) suggest that these two SNe are an intermedi-ate case between SN 1987A and normal SNe II.Pastorello et al.(2012) argue that these plateaus are due to shock cool-ing. DES16C3cje also has the lowest luminosity within the SN1987A-like group, around 1 mag fainter than SN 1987A and ∼ 0.5 mag fainter than the low-luminosity SN 2009E.
Comparing to the LL-SNe II sample, the initial evo-lution of DES16C3cje is consistent with typical SNe II for ∼ 60d; however a sudden increase in luminosity transforms a ‘typical SN II’ to a SN1987A-like event. The post-peak light curve evolution also differs, where all SN1987A-like and LL-SNe follow the rate of56Co decay. In the case of DES16C3cje,
the decay at late-times is slower, again suggesting an extra source of energy is needed. We also note that SN 2005cs shows a slow decline soon after the plateau (between 140 and ∼ 320 days;Pastorello et al. 2009). One possible expla-nation for this flattening was given byUtrobin(2007), who suggested that it is produced by a residual contribution from radiation energy. Giving that this effect is predicted for typ-ical slow-declining SNe II soon after the plateau phase, we
18
20
22
24
26
28
Apparen
t
Magnitude
g− 1.8 r i + 1 z + 2−18
−16
−14
−12
−10
Absolute
Magnitude
0
100
200
300
400
Rest-frame days from explosion
40.0
40.5
41.0
41.5
42.0
log
10L
bol(er
g
s
− 1)
Accretion Power
L∝ t−5/3(t 0= 298d) 56 Co deca y DES16C3cje (griz) DES16C3cje (bolom.)−1
0
1
2
Colour
Peak Minimum Tail g− r r− i i− zFigure 1. Upper: griz light curves of DES16C3cje. Filled symbols represent the data obtained with DES, while open stars show the data obtained with EFOSC2, LDSS3, FORS2 and GROND. Only corrections for Milky Way extinction have been made. The last non-detection is presented as a green arrow. Vertical purple arrows represent epochs of optical spectroscopy. Solid lines show the Gaussian process (GP) interpolation. Middle: Colour curves of DES16C3cje. Solid lines show the GP interpolation. Vertical green arrows represent epochs of minimum, peak and the beginning of the tail in the optical light curves. Lower: Bolometric (pink) and pseudo-bolometric (dark cyan) light curves of DES16C3cje. The dashed line shows the luminosity expected from56Co (assuming full trapping) and the solid line the luminosity expected from accretion power.
explore an alternative scenario to explain the decay at the late-times in DES16C3cje.
To distinguish between the scenarios of 56Co decay
and accretion power (L ∝ t−5/3) as explanations for the light curves, we compare the reduced chi-squared ( χ2)
val-ues (shown in Table A2) of the corresponding fits to the SNe with data at late-time (between 280 and 500 days; DES16C3cje, SN 1987A, SN 2005cs and SN 2009E). Out of these, only for DES16C3cje does the power law provides a better fit ( χ2= 0.71), supporting the idea of an extra source of energy. Because of the large uncertainties in the bolomet-ric light curve of DES16C3cje, we test this result using a
Monte Carlo resampling with 105 random draws (assuming a Gaussian distribution). The results obtained support our previous findings.
Figure 3 also presents the spectral comparison at ∼ 105d from explosion. The comparison with SN1987A-like objects and LL-SNe II again shows that DES16C3cje is a unique object. None of the other SNe have lines as narrow as DES16C3cje. SN 1999br has the narrowest lines, but its spectrum also shows Ba ii and Sc ii, together with a multiple component Hα P-Cygni profile, characteristic of LL-SNe II.
4000
5000
6000
7000
8000
9000
Rest Wavelength [˚
A]
Normalized
F
λ+
Constan
t
80d 105d 127d 278d 380d Host galaxy (47d) Hα Hβ Fe II 4924 Fe II 5018 Fe II 5169 NaID 5993 Cachito (HV Hα) Cachito (HV Hβ) Ca II NIR Triplet ⊕ Artefact−5000
0
5000
Velocity [km s
−1]
80d 105d 127d 278d 380d Hα P-Cygni profileFigure 2. Left:Optical spectra of DES16C3cje from 80 to 380 days after explosion. Each spectrum has been corrected for Milky Way reddening and shifted by an arbitrary amount for presentation. The phases are labelled on the right. Right: Zoom around the Hα P-Cygni profile in velocity space.
4 LIGHT CURVE MODELLING
We now consider some models that can be used to under-stand and explain the physical origin and unusual features of DES16C3cje. For these models, we use the one-dimensional Lagrangian hydrodynamical code presented inBersten et al.
(2011). This code simulates a SN explosion, and produces bolometric light curves and photospheric velocities to char-acterize the progenitor and explosion properties. There are two particular challenges to this modelling: the early pho-tometric behavior (before peak) and the low expansion ve-locities, and the late-time decline rate. We begin with the former.
There is a degree of degeneracy between the progenitor (pre-SN) mass and radius (M, R) and the explosion energy (E), which can be partially reduced by modeling the lumi-nosity evolution together with the expansion velocity evolu-tion. For DES16C3cje, the expansion velocities imply a low E/Mratio. We found that for a progenitor with similar char-acteristics to those used for SN 1987A (i.e., a blue supergiant star with R ∼ 50 R , MZAMS= 20 M and E = 1 foe), there
is no model that simultaneously matches the light curve and velocity evolution, as a low energy is needed to reproduce the latter. The low energy required leads to a much fainter and broader light curve than that observed. We found that explosion energies of ∼ 0.1 foe are needed to reproduce the expansion velocities of DES16C3cje.
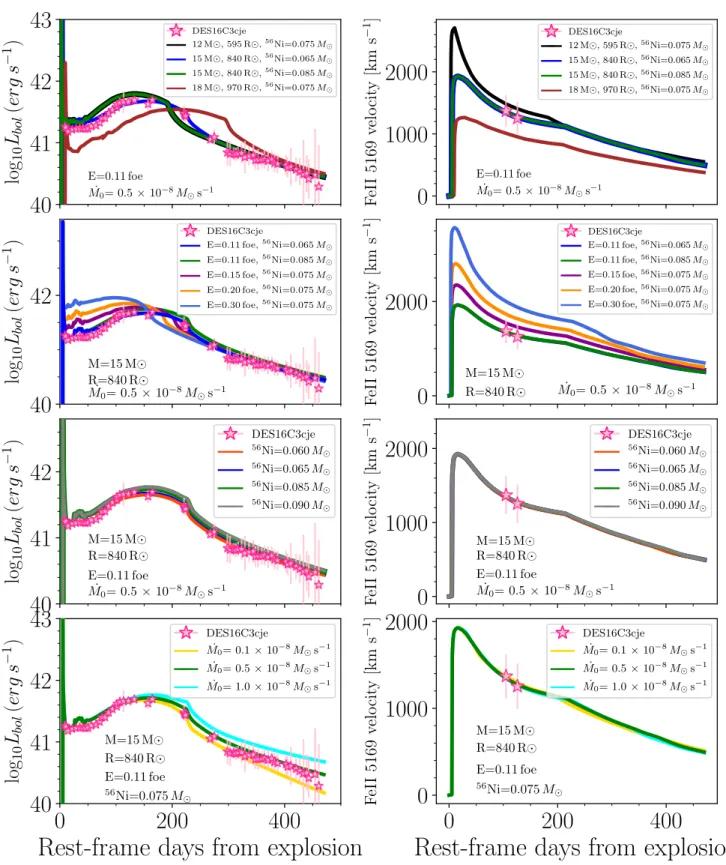
Therefore, we calculated a grid of hydrodynamical mod-els with values of E close to 0.1 foe. Our pre-SN modmod-els were computed using the stellar evolution code MESA version 10398 (Paxton et al. 2011,2013,2015,2018). The stars were evolved from the pre-main-sequence to the time of core
col-lapse, defined as when any part of the collapsing core exceeds an infall velocity of 1000 km s−1, and assuming solar
metal-licity. Our models cover the MZAMS range of 9 − 25 M in
intervals of 1 M (which corresponds to progenitor radii be-tween 480 and 1050 R ), and explosion energies bebe-tween 0.1 and 0.5 foe with the exception of the largest masses and lower energies due to numerical difficulties.
After exploring several configurations (see FigureB.1in the Appendix), we found a model that reproduced the ob-servations relatively well. This model is presented on the left panel of Figure4and has the following physical parameters: a MZAMS = 15 M , a pre-SN mass of 13.3 M , R = 830 R
and E= 0.11 foe. We also consider56Ni masses in the range
of 0.01 and 0.1 M and find that a relatively large 56Ni mass of 0.095 M is required to reproduce the light curve observed after the initial plateau. This material was mixed up to 0.75 of the pre-SN mass, and therefore a not too ex-treme mixing was required as is common in several 87A-like objects in order to produce the initial plateau and the long rise to the peak. In this scenario, the peculiar light curve shape of DES16C3cje can be understood as a combination of a low explosion energy and a relatively large 56Ni
pro-duction, while its progenitor has a red supergiant (RSG) structure typical of other SN II objects.
We now turn to the late-time light curve. Despite the good agreement between the model and observations at early times, there are clear differences in the slopes during the light curve tail (green curve in Figure4). As discussed above, DES16C3cje does not follow the behavior expected by ra-dioactive decay of 56Co, but instead is consistent with a
−18
−16
−14
−12
Absolute
r/R
Magnitude
87A-like objects 56 Co deca y DES16C3cje SN2009E SN2005ci SN2004em SN2004ek SN1987A0
100
200
300
400
500
Rest-frame days from explosion
−16
−14
−12
−10
Absolute
r/R
Magnitude
LL-SNe II 56 Codeca y DES16C3cje SN2013K SN2005cs SN2003Z SN1999br0
10
20
30
Normalized
F
λ+
Constan
t
DES16C3cje (105d) SN 2009E (106d) SN 2004ek (103d) SN 1987A (107d) 87A-like objects4000
5000
6000
7000
8000
9000
Rest Wavelength [˚
A]
0
10
20
30
40
Normalized
F
λ+
Constan
t
DES16C3cje (105d) SN 2005cs (106d) SN 2013K (101d) SN 2003Z (103d) SN 1999br (104d) LL-SNe IIFigure 3.Left: Comparison of the r/R-band light curve of DES16C3cje with well-observed SNe II. Upper panel: Comparison with 87A-like objects: SN 1987A (Bouchet et al. 1989;Hamuy & Suntzeff 1990), SN 2004ek (Taddia et al. 2016), SN 2004em (Taddia et al. 2016), SN 2005ci (Taddia et al. 2016) and SN 2009E (Pastorello et al. 2012). Lower panel: Comparison with LLSNe II: SN 1999br (Pastorello et al. 2004;Galbany et al. 2016), SN2003Z (Spiro et al. 2014;Faran et al. 2014), SN 2005cs (Pastorello et al. 2009), and SN 2013K (Tomasella et al. 2018). Right: Spectral comparison around 110 d for DES16C3cje. Upper panel: Comparison with SN1987A-like objects: SN 1987A (Phillips et al. 1988), SN 2004ek (Taddia et al. 2016), and SN 2009E (Pastorello et al. 2012). Lower panel: Comparison with LLSNe II: SN 1999br (Guti´errez et al. 2017), SN2003Z (Spiro et al. 2014), SN 2005cs (Pastorello et al. 2009), and SN 2013K (Tomasella et al. 2018).
from accretion power (or ‘fallback’5;Michel 1988;Chevalier 1989). Under some conditions, for example if the SN explo-sion is not powerful enough, some material may not acquire sufficient energy to escape and will eventually be accreted onto the compact remnant. These accretions are usually as-sociated with powerful energy outflows. A fraction of this energy can be thermalised within the SN ejecta and thus power the light curve (Dexter & Kasen 2013).
We have included this extra energy in our 1D La-grangian code to explore if this can improve the differences between the model and observations during the latter part of the light curve. The rate input of energy due to the ac-cretion can be written as: Lfb = ÛE = η ÛM c2 where ÛM is the
fallback accretion rate, c is the speed of light and η is the ef-ficiency factor, estimated to be of the order of 10−3 (Dexter & Kasen 2013). Analytic estimates (Chevalier 1989), as well
5 The canonical power-law index, n = −5/3, is produced by a simple ballistic fallback model (Rees 1988). However, standard viscous disc descriptions extend the duration of the emission, with an index closer to n= −1.2 (seeBalbus & Mummery 2018, and references therein). This suggests that the index value n changes depending on the conditions of the disc.
as numerical simulations (Zhang et al. 2008;Dexter & Kasen 2013), have shown that the accretion rate can be assumed to be ÛM= ÛM0(t/t0)−5/3, where ÛM0is the accretion rate onto
the remnant at a time t0 when the fallback episode begins.
The fallback energy is instantaneously deposited after the explosion, near the center of the progenitor, and we assume full trapping.
In our treatment, ÛM0 and t0 are free parameters to be
determined by comparison with the observations. We again calculate a grid of simulations, but this time vary ÛM in the range of 10−7− 10−9 and t
0 between 0.1 d and 50 d
after the onset of the simulation, finding a set of parame-ters that can reproduce the behaviour of the light-curve tail of DES16C3cje. In the lower panel of FigureB.1, we show the effect on the light curve and velocities as a result of the variation of ÛM0, while in FigureB.2, the changes in the light curve produced by different t0 are presented. The fallback
parameters found are: ÛM0 = 0.5 × 10⁻⁸M s−1 and t0 = 1 d.
These calculations were performed assuming the same pro-genitor and explosion energy as the RSG model presented above, and the combined model is shown in Figure4(left panel). The inclusion of fallback energy clearly improves the modelling during the tail, with almost no effect in other
0
100
200
300
400
500
Rest-frame days from explosion
40.0
40.5
41.0
41.5
42.0
42.5
log
10
L
bol
(er
g
s
−
1
)
DES16C3cje15 M , 830 R , E=0.11 foe,56Ni=0.095 M 15 M , 830 R , E=0.11 foe,56Ni=0.075 M
, ˙M0= 0.5× 10⁻⁸M s−1
0
100
200
300
400
500
Rest-frame days from explosion
DES16C3cje40 M , 100 R , E=1 foe,56Ni=0.085 M 40 M , 100 R , E=1 foe,56Ni=0.08 M
, ˙M0= 0.4× 10⁻⁸M s−1
Figure 4.Bolometric light curve of DES16C3cje (stars) compared with the results of the light curve calculations from hydrodynamic models (Section4). A core-collapse explosion (powered only by56Ni) is presented in green on the left panel and in cyan on the right. Explosions powered by both56Ni and fallback (i.e., with an extra contribution of energy coming from accretion in the central region) are presented in blue and black in each panel. The parameters used for each model are given in the legends.
phases. However, we note a slightly smaller amount of56Ni
is needed when fallback energy is added; a good match is found using 0.075 M of56Ni. The value of ÛM0is small
com-pared with that usually found in the literature (Zhang et al. 2008;Moriya et al. 2018a). The reason is the low luminos-ity of this SN: larger accretion rates inject more energy and produce brighter light curves.
We emphasise that even though we try to model the light curve peak assuming that it was powered by fallback accretion instead of 56Ni, we are unable to find any set of fallback parameters that can reproduce it. Larger accre-tion rates produce more luminous light curves and earlier plateaus than observed. In addition, a delayed deposition of the fallback energy is not a solution as despite the low accretion rate, a time delay factor produces an extremely luminous plateau (similar to figure 2 ofMoriya et al. 2019) and a brighter light curve tail.
The parameters of our preferred model point to a nor-mal RSG progenitor that has experienced a low energy ex-plosion leading to the fallback process. The peculiar light curve shape of DES16C3cje can then be explained as a com-bination of a low explosion energy, a relatively large 56Ni mass but not extremely mixing, and extra energy due to the accretion of material onto the compact remnant.
There is strong evidence of the existence of a correlation between the explosion energy and the amount of56Ni (see
for example Pejcha & Prieto 2015), in the sense that more energetic events produce larger amount of56Ni. This relation
is also supported by theoretical studies. The low explosion energy and the relatively large56Ni production found in our
modelling does not follow the expected correlation. We note a low explosion energy was mainly required to reproduce the low-expansion velocities.
DES16C3cje has only two measurements of the expan-sion velocity available at ∼ 105 d and ∼ 127 d, and thus the expansion velocity during the first weeks of evolution
is not unambiguously known, and the measurements around ∼ 100d may not represent the photospheric velocities of the ejecta. We experiment with relaxing the condition to repro-duce the expansion velocity, and find an alternative model that reproduces relatively well the observed light curve with a progenitor with ∼40 M , an explosion energy of 1 foe and 0.08M of56Ni (Figure4). Here, we used a polytropic model to describe the structure of the star before explosion. The fallback parameters needed to reproduce the tail are similar to that in the previous model, i.e, ÛM0 = 0.4 × 10⁻⁸M s−1
and t0 = 1 d. The higher energy of this model is then more consistent with known correlations between56Ni production
and explosion energy. FigureB.3shows the different configu-rations explored for this case. The parameters of the best-fit models are presented in TableA3.
5 DISCUSSION AND CONCLUSIONS
DES16C3cje is a low-luminosity and low-velocity type II su-pernova (SN II). Its light curves show a plateau for ∼ 60 days, followed by a long rise time, reminiscent of SN 1987A, but on a longer time-scale. The initial faint plateau can be explained by hydrogen recombination, while the broad peak is powered by radioactive decay. After 300 days, the tail presents a decline rate comparable to that expected from accretion power (∝ t−5/3). The narrow lines observed in the
spectra imply low expansion velocities, and thus, low explo-sion energies. Taken together, these characteristics suggest an unusual explosion.
Modelling the light curve of DES16C3cje and its ve-locity evolution with hydrodynamical calculations, we have shown that the SN is consistent with the explosion of a RSG star with a mass of 15 M , an energy of 0.11 foe, and synthe-sising a56Ni mass of 0.075 M . Because of the low energy
remnant with an accretion rate of ∼ 0.5 × 10⁻⁸ M s−1. Al-though this scenario reproduces the light curve and veloci-ties, at first sight the required56Ni mass appears relatively large for two main reasons: 1) low energy explosions are observed to produce small amounts of 56Ni, and 2) in the
fallback scenario, some amount of the56Ni is expected to be
accreted on to the central remnant.
However, Chevalier (1989) discussed the expectation that an ejection of substantial56Ni would imply little mass fallback, and showed this is not valid for accretion after the passage of the reverse shock wave, when the56Ni is expected to mix with outer core layers.Heger & Woosley(2010) fur-ther showed that a considerable amount of 56Ni comes out
when mixing precedes fallback. The mixing in RSGs is larger than in compact objects as perturbations have more time to grow before freezing out. Under these considerations, it is not unusual to find SNe that both experienced some fall-back and have a relatively large amount of56Ni.
Nonetheless, we also consider an alternative scenario by assuming that the velocities measured from the absorption lines at 105 and 126 days do not represent the photospheric velocities of the ejecta. We then find that DES16C3cje can be modelled as the explosion of a relatively compact star (R= 100 R ), with a mass of ∼ 40 M , an explosion energy of 1 foe, and a56Ni mass of 0.08 M .
Both models can reproduce the overall evolution of the light curve of DES16C3cje; however, the low-energy explo-sion of a RSG fits the early part of the light curve better, and provides a good agreement with expansion velocities.
A further possibility to explain the late-time light curve of DES16C3cje is interaction with CSM. Interacting objects (e.g. SNe IIn, SN 2009ip-like objects;Stritzinger et al. 2012;
Fraser et al. 2015; Elias-Rosa et al. 2016; Pastorello et al. 2018) often have flattened late-time light curves, with de-cline rates slower than that expected for 56Co decay. The
flat evolution in the light curves of DES16C3cje, together with the lack of [O ii] λλ6300, 6363, [Fe ii] λ7155 and [Ca ii] λ7291, 7323 emission lines, offer some support for this sce-nario. However, this evidence for interaction only appears at around 300 days from explosion with no evidence for inter-action prior to this epoch, in turn suggesting a significant mass loss during the progenitor star evolution.
Theoretical models have also shown that stars with masses below 40 M at low-metallicities undergo very lit-tle mass loss due to stellar winds (e.g.Woosley et al. 2007;
Meynet et al. 2013). Assuming that the progenitor mass fa-vored by our hydrodynamical models (15 and 40M ) is cor-rect, we would expect a low mass loss. The location of our object supports this argument: DES16C3cje exploded in a low-luminosity (low-metallicity, Sec. 3.1) host, and models predict low-metallicity stars have less mass loss and big-ger hydrogen envelopes when they explode (e.g.Heger et al. 2003).
While the late-time light curve of DES16C3cje is follow-ing a decline rate close to t−5/3, we cannot rule out a scenario involving interaction with CSM.Moriya et al.(2019) briefly discuss the possibility of CSM interaction in fallback SN and the need to study this issue in the future.
In summary, we have shown that the fallback SN sce-nario can naturally explain the slow decline in the late-time light curve. However, further investigations are needed to interpret the origin of these peculiar objects, the signatures
required to identify the explosion scenario, and the role of the56Ni mass and interaction with CSM.
ACKNOWLEDGEMENTS
We are grateful to Pedro Lacerda for performing some of the observations used in this work. We thank the anonymous referee for useful suggestions.
CPG and MS acknowledge support from EU/FP7-ERC grant No. [615929]. LG was funded by the European Union’s Horizon 2020 research and innovation programme under the Marie Sk lodowska-Curie grant agreement No. 839090. TWC acknowledgments the funding provided by the Alexander von Humboldt Foundation. MF is supported by a Royal So-ciety – Science Foundation Ireland University Research Fel-lowship. MG is supported by the Polish NCN MAESTRO grant 2014/14/A/ST9/00121. MN is supported by a Royal Astronomical Society Research Fellowship.
This work used data collected at the European Organ-isation for Astronomical Research in the Southern Hemi-sphere, Chile, under program IDs: 5040(A), 299.D-5040(B), 0100.D-0461(A), 194.C-0207(I), and as part of PESSTO, (the Public ESO Spectroscopic Survey for Tran-sient Objects Survey) ESO program 197.D-1075, 199.D-0143.
Some of the data presented here were obtained at the Gemini Observatory, which is operated by the Association of Universities for Research in Astronomy, Inc., under a co-operative agreement with the NSF on behalf of the Gem-ini partnership: the National Science Foundation (United States), the National Research Council (Canada), CONI-CYT (Chile), Ministerio de Ciencia, Tecnolog´ıa e Innovaci´on Productiva (Argentina), and Minist´erio da Ciˆencia, Tecnolo-gia e Inova¸c˜ao (Brazil). Gemini observations were obtained under programme NOAO GS-2016B-Q-9.
Funding for the DES Projects has been provided by the U.S. Department of Energy, the U.S. National Sci-ence Foundation, the Ministry of SciSci-ence and Education of Spain, the Science and Technology Facilities Council of the United Kingdom, the Higher Education Funding Council for England, the National Center for Supercomputing Applica-tions at the University of Illinois at Urbana-Champaign, the Kavli Institute of Cosmological Physics at the University of Chicago, the Center for Cosmology and Astro-Particle Physics at the Ohio State University, the Mitchell Institute for Fundamental Physics and Astronomy at Texas A&M University, Financiadora de Estudos e Projetos, Funda¸c˜ao Carlos Chagas Filho de Amparo `a Pesquisa do Estado do Rio de Janeiro, Conselho Nacional de Desenvolvimento Cient´ı-fico e Tecnol´ogico and the Minist´erio da Ciˆencia, Tecnologia e Inova¸c˜ao, the Deutsche Forschungsgemeinschaft and the Collaborating Institutions in the Dark Energy Survey.
The Collaborating Institutions are Argonne National Laboratory, the University of California at Santa Cruz, the University of Cambridge, Centro de Investigaciones Energ´eticas, Medioambientales y Tecnol´ogicas-Madrid, the University of Chicago, University College London, the DES-Brazil Consortium, the University of Edinburgh, the Ei-dgen¨ossische Technische Hochschule (ETH) Z¨urich, Fermi National Accelerator Laboratory, the University of Illi-nois at Urbana-Champaign, the Institut de Ci`encies de
l’Espai (IEEC/CSIC), the Institut de F´ısica d’Altes Ener-gies, Lawrence Berkeley National Laboratory, the Ludwig-Maximilians Universit¨at M¨unchen and the associated Ex-cellence Cluster Universe, the University of Michigan, the National Optical Astronomy Observatory, the University of Nottingham, The Ohio State University, the University of Pennsylvania, the University of Portsmouth, SLAC National Accelerator Laboratory, Stanford University, the University of Sussex, Texas A&M University, and the OzDES Member-ship Consortium.
Based in part on observations at Cerro Tololo Inter-American Observatory, National Optical Astronomy Obser-vatory, which is operated by the Association of Universi-ties for Research in Astronomy (AURA) under a cooperative agreement with the National Science Foundation.
Part of the funding for GROND (both hardware as well as personnel) was generously granted from the Leibniz-Prize to Prof. G. Hasinger (DFG grant HA 1850/28-1).
This paper includes data gathered with the 6.5 meter Magellan Clay Telescope located at Las Campanas Obser-vatory, Chile under the programme 100type IA Supernovae (100IAS) survey.
This work has been partially supported by the Spanish grant PGC2018-095317-B-C21 within the European Funds for Regional Development (FEDER).
The DES data management system is supported by the National Science Foundation under Grant Numbers AST-1138766 and AST-1536171. The DES participants from Spanish institutions are partially supported by MINECO under grants AYA2015-71825, ESP2015-66861, FPA2015-68048, SEV-2016-0588, SEV-2016-0597, and MDM-2015-0509, some of which include ERDF funds from the Euro-pean Union. IFAE is partially funded by the CERCA pro-gram of the Generalitat de Catalunya. Research leading to these results has received funding from the European Re-search Council under the European Union’s Seventh Frame-work Program (FP7/2007-2013) including ERC grant agree-ments 240672, 291329, and 306478. We acknowledge support from the Brazilian Instituto Nacional de Ciˆenciae Tecnologia (INCT) e-Universe (CNPq grant 465376/2014-2).
This research used resources of the National Energy Re-search Scientific Computing Center (NERSC), a U.S. De-partment of Energy Office of Science User Facility operated under Contract No. DE-AC02-05CH11231.
This manuscript has been authored by Fermi Research Alliance, LLC under Contract No. DE-AC02-07CH11359 with the U.S. Department of Energy, Office of Science, Of-fice of High Energy Physics. The United States Government retains and the publisher, by accepting the article for pub-lication, acknowledges that the United States Government retains a non-exclusive, paid-up, irrevocable, world-wide li-cense to publish or reproduce the published form of this manuscript, or allow others to do so, for United States Gov-ernment purposes.
REFERENCES
Ambikasaran S., et al., 2016, IEEE Trans. Pattern Anal. Mach. Intell., 38
Anderson J. P., 2019,A&A,628, A7
Andrews J. E., Smith N., 2018,MNRAS,477, 74
Angus C. R., et al., 2019,MNRAS,p. 1302 Appenzeller I., et al., 1998, The Messenger,94, 1 Arcavi I., et al., 2017,Nature,551, 210
Arnett D., 1996, Supernovae and Nucleosynthesis: An Investiga-tion of the History of Matter from the Big Bang to the Present Balbus S. A., Mummery A., 2018,MNRAS,481, 3348
Bernstein J. P., et al., 2012,ApJ,753, 152
Bersten M. C., Benvenuto O. G., 2016, Boletin de la Asociacion Argentina de Astronomia La Plata Argentina,58, 246 Bersten M. C., Benvenuto O., Hamuy M., 2011,ApJ,729, 61 Bouchet P., Moneti A., Slezak E., Le Bertre T., Manfroid J., 1989,
A&AS,80, 379
Buzzoni B., et al., 1984, The Messenger,38, 9 Chevalier R. A., 1989,ApJ,346, 847
Chugai N. N., et al., 2004,MNRAS,352, 1213 Colgate S. A., 1971,ApJ,163, 221
Colless M., et al., 2003, VizieR Online Data Catalog,p. VII/226 Dessart L., 2018,A&A,610, L10
Dexter J., Kasen D., 2013,ApJ,772, 30 Drout M. R., et al., 2014,ApJ,794, 23 Elias-Rosa N., et al., 2016,MNRAS,463, 3894 Faran T., et al., 2014,MNRAS,442, 844 Firth R. E., et al., 2015,MNRAS,446, 3895 Flaugher B., et al., 2015,AJ,150, 150 Fraser M., et al., 2015,MNRAS,453, 3886
Freudling W., Romaniello M., Bramich D. M., Ballester P., Forchi V., Garc´ıa-Dabl´o C. E., Moehler S., Neeser M. J., 2013,A&A, 559, A96
Fryer C. L., 1999,ApJ,522, 413 Fryer C. L., et al., 2009,ApJ,707, 193 Gal-Yam A., 2012,Science,337, 927 Gal-Yam A., et al., 2009,Nature,462, 624 Galbany L., et al., 2016,AJ,151, 33 Goldstein D. A., et al., 2015,AJ,150, 82 Greiner J., et al., 2008,PASP,120, 405 Guti´errez C. P., et al., 2017,ApJ,850, 89 Hamuy M., Suntzeff N. B., 1990,AJ,99, 1146 Heger A., Woosley S. E., 2002,ApJ,567, 532 Heger A., Woosley S. E., 2010,ApJ,724, 341
Heger A., Fryer C. L., Woosley S. E., Langer N., Hartmann D. H., 2003,ApJ,591, 288
Hook I. M., Jørgensen I., Allington-Smith J. R., Davies R. L., Metcalfe N., Murowinski R. G., Crampton D., 2004, PASP, 116, 425
Inserra C., et al., 2018a,MNRAS,475, 1046
Inserra C., Prajs S., Gutierrez C. P., Angus C., Smith M., Sullivan M., 2018b,ApJ,854, 175
Kasen D., Bildsten L., 2010,ApJ,717, 245 Kasliwal M. M., et al., 2012,ApJ,755, 161
Kennicutt R. C., Evans N. J., 2012,ARA&A,50, 531 Kessler R., et al., 2015,AJ,150, 172
Kr¨uhler T., et al., 2008,ApJ,685, 376 Marino R. A., et al., 2013,A&A,559, A114
Meynet G., Eggenberger P., Ekstr¨om S., Georgy C., Groh J., Maeder A., Saio H., Moriya T., 2013, in Alecian G., Lebreton Y., Richard O., Vauclair G., eds, EAS Publications Series Vol. 63, EAS Publications Series. pp 373–383 (arXiv:1308.5797), doi:10.1051/eas/1363042
Michel F. C., 1988,Nature,333, 644
Moriya T., Tominaga N., Tanaka M., Nomoto K., Sauer D. N., Mazzali P. A., Maeda K., Suzuki T., 2010,ApJ,719, 1445 Moriya T. J., Sorokina E. I., Chevalier R. A., 2018a,
Space Sci. Rev.,214, 59
Moriya T. J., Terreran G., Blinnikov S. I., 2018b,MNRAS,475, L11
Moriya T. J., M¨uller B., Chan C., Heger A., Blinnikov S. I., 2019, ApJ,880, 21
M¨uller T., Prieto J. L., Pejcha O., Clocchiatti A., 2017,ApJ,841, 127
Orellana M., Bersten M. C., Moriya T. J., 2018,A&A,619, A145 Osip D. J., et al., 2004, in Moorwood A. F. M., Iye M., eds, Society of Photo-Optical Instrumentation Engineers (SPIE) Conference Series Vol. 5492, Proc. SPIE. pp 49–59, doi:10.1117/12.552414
Papadopoulos A., et al., 2015,MNRAS,449, 1215 Pastorello A., et al., 2004,MNRAS,347, 74 Pastorello A., et al., 2006,MNRAS,370, 1752 Pastorello A., et al., 2009,MNRAS,394, 2266 Pastorello A., et al., 2012,A&A,537, A141 Pastorello A., et al., 2018,MNRAS,474, 197
Paxton B., Bildsten L., Dotter A., Herwig F., Lesaffre P., Timmes F., 2011,The Astrophysical Journal Supplement Series,192, 3
Paxton B., et al., 2013, The Astrophysical Journal Supplement Series,208, 4
Paxton B., et al., 2015,ApJS,220, 15 Paxton B., et al., 2018,ApJS,234, 34 Pejcha O., Prieto J. L., 2015,ApJ,799, 215 Perets H. B., et al., 2010,Nature,465, 322
Phillips M. M., Heathcote S. R., Hamuy M., Navarrete M., 1988, AJ,95, 1087
Pursiainen M., et al., 2018, preprint, (arXiv:1803.04869) Rees M. J., 1988,Nature,333, 523
Schlafly E. F., Finkbeiner D. P., 2011,ApJ,737, 103 Smartt S. J., et al., 2015,A&A,579, A40
Smith M., et al., 2016,ApJ,818, L8 Sollerman J., et al., 2019,A&A,621, A30 Spiro S., et al., 2014,MNRAS,439, 2873 Stritzinger M., et al., 2012,ApJ,756, 173 Taddia F., et al., 2016,A&A,588, A5
Terreran G., et al., 2017,Nature Astronomy,1, 713
Tody D., 1986, in Crawford D. L., ed., Society of Photo-Optical Instrumentation Engineers (SPIE) Conference Se-ries Vol. 627, Instrumentation in astronomy VI. p. 733, doi:10.1117/12.968154
Tomasella L., et al., 2018,MNRAS,475, 1937 Utrobin V. P., 2007,A&A,461, 233
Vernet J., et al., 2011,A&A,536, A105 Wang L. J., et al., 2018,ApJ,865, 95 Woosley S. E., 2017,ApJ,836, 244 Woosley S. E., 2018,ApJ,863, 105
Woosley S. E., Weaver T. A., 1995,ApJS,101, 181
Woosley S. E., Pinto P. A., Hartmann D., 1989,ApJ,346, 395 Woosley S. E., Blinnikov S., Heger A., 2007,Nature,450, 390 Zhang W., Woosley S. E., Heger A., 2008,ApJ,679, 639 de Jaeger T., et al., 2017,MNRAS,472, 4233
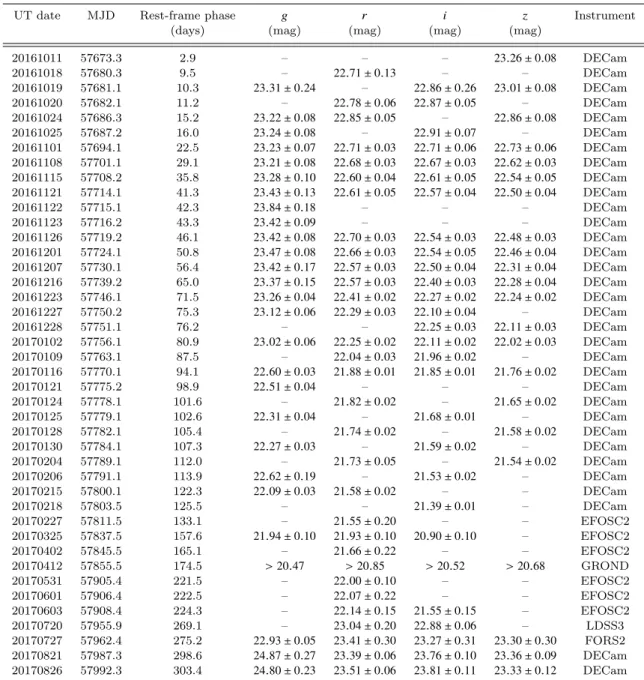
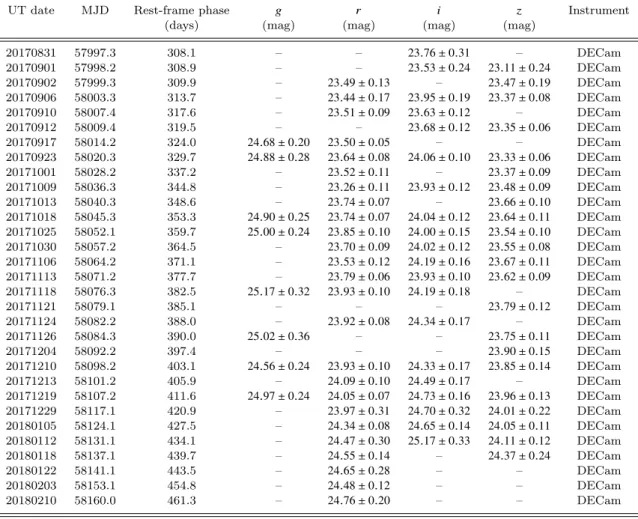
Table A1.Photometry of DES16C3cje
UT date MJD Rest-frame phase g r i z Instrument
(days) (mag) (mag) (mag) (mag)
20161011 57673.3 2.9 – – – 23.26 ± 0.08 DECam 20161018 57680.3 9.5 – 22.71 ± 0.13 – – DECam 20161019 57681.1 10.3 23.31 ± 0.24 – 22.86 ± 0.26 23.01 ± 0.08 DECam 20161020 57682.1 11.2 – 22.78 ± 0.06 22.87 ± 0.05 – DECam 20161024 57686.3 15.2 23.22 ± 0.08 22.85 ± 0.05 – 22.86 ± 0.08 DECam 20161025 57687.2 16.0 23.24 ± 0.08 – 22.91 ± 0.07 – DECam 20161101 57694.1 22.5 23.23 ± 0.07 22.71 ± 0.03 22.71 ± 0.06 22.73 ± 0.06 DECam 20161108 57701.1 29.1 23.21 ± 0.08 22.68 ± 0.03 22.67 ± 0.03 22.62 ± 0.03 DECam 20161115 57708.2 35.8 23.28 ± 0.10 22.60 ± 0.04 22.61 ± 0.05 22.54 ± 0.05 DECam 20161121 57714.1 41.3 23.43 ± 0.13 22.61 ± 0.05 22.57 ± 0.04 22.50 ± 0.04 DECam 20161122 57715.1 42.3 23.84 ± 0.18 – – – DECam 20161123 57716.2 43.3 23.42 ± 0.09 – – – DECam 20161126 57719.2 46.1 23.42 ± 0.08 22.70 ± 0.03 22.54 ± 0.03 22.48 ± 0.03 DECam 20161201 57724.1 50.8 23.47 ± 0.08 22.66 ± 0.03 22.54 ± 0.05 22.46 ± 0.04 DECam 20161207 57730.1 56.4 23.42 ± 0.17 22.57 ± 0.03 22.50 ± 0.04 22.31 ± 0.04 DECam 20161216 57739.2 65.0 23.37 ± 0.15 22.57 ± 0.03 22.40 ± 0.03 22.28 ± 0.04 DECam 20161223 57746.1 71.5 23.26 ± 0.04 22.41 ± 0.02 22.27 ± 0.02 22.24 ± 0.02 DECam 20161227 57750.2 75.3 23.12 ± 0.06 22.29 ± 0.03 22.10 ± 0.04 – DECam 20161228 57751.1 76.2 – – 22.25 ± 0.03 22.11 ± 0.03 DECam 20170102 57756.1 80.9 23.02 ± 0.06 22.25 ± 0.02 22.11 ± 0.02 22.02 ± 0.03 DECam 20170109 57763.1 87.5 – 22.04 ± 0.03 21.96 ± 0.02 – DECam 20170116 57770.1 94.1 22.60 ± 0.03 21.88 ± 0.01 21.85 ± 0.01 21.76 ± 0.02 DECam 20170121 57775.2 98.9 22.51 ± 0.04 – – – DECam 20170124 57778.1 101.6 – 21.82 ± 0.02 – 21.65 ± 0.02 DECam 20170125 57779.1 102.6 22.31 ± 0.04 – 21.68 ± 0.01 – DECam 20170128 57782.1 105.4 – 21.74 ± 0.02 – 21.58 ± 0.02 DECam 20170130 57784.1 107.3 22.27 ± 0.03 – 21.59 ± 0.02 – DECam 20170204 57789.1 112.0 – 21.73 ± 0.05 – 21.54 ± 0.02 DECam 20170206 57791.1 113.9 22.62 ± 0.19 – 21.53 ± 0.02 – DECam 20170215 57800.1 122.3 22.09 ± 0.03 21.58 ± 0.02 – – DECam 20170218 57803.5 125.5 – – 21.39 ± 0.01 – DECam 20170227 57811.5 133.1 – 21.55 ± 0.20 – – EFOSC2 20170325 57837.5 157.6 21.94 ± 0.10 21.93 ± 0.10 20.90 ± 0.10 – EFOSC2 20170402 57845.5 165.1 – 21.66 ± 0.22 – – EFOSC2 20170412 57855.5 174.5 > 20.47 > 20.85 > 20.52 > 20.68 GROND 20170531 57905.4 221.5 – 22.00 ± 0.10 – – EFOSC2 20170601 57906.4 222.5 – 22.07 ± 0.22 – – EFOSC2 20170603 57908.4 224.3 – 22.14 ± 0.15 21.55 ± 0.15 – EFOSC2 20170720 57955.9 269.1 – 23.04 ± 0.20 22.88 ± 0.06 – LDSS3 20170727 57962.4 275.2 22.93 ± 0.05 23.41 ± 0.30 23.27 ± 0.31 23.30 ± 0.30 FORS2 20170821 57987.3 298.6 24.87 ± 0.27 23.39 ± 0.06 23.76 ± 0.10 23.36 ± 0.09 DECam 20170826 57992.3 303.4 24.80 ± 0.23 23.51 ± 0.06 23.81 ± 0.11 23.33 ± 0.12 DECam
UT date MJD Rest-frame phase g r i z Instrument
(days) (mag) (mag) (mag) (mag)
20170831 57997.3 308.1 – – 23.76 ± 0.31 – DECam 20170901 57998.2 308.9 – – 23.53 ± 0.24 23.11 ± 0.24 DECam 20170902 57999.3 309.9 – 23.49 ± 0.13 – 23.47 ± 0.19 DECam 20170906 58003.3 313.7 – 23.44 ± 0.17 23.95 ± 0.19 23.37 ± 0.08 DECam 20170910 58007.4 317.6 – 23.51 ± 0.09 23.63 ± 0.12 – DECam 20170912 58009.4 319.5 – – 23.68 ± 0.12 23.35 ± 0.06 DECam 20170917 58014.2 324.0 24.68 ± 0.20 23.50 ± 0.05 – – DECam 20170923 58020.3 329.7 24.88 ± 0.28 23.64 ± 0.08 24.06 ± 0.10 23.33 ± 0.06 DECam 20171001 58028.2 337.2 – 23.52 ± 0.11 – 23.37 ± 0.09 DECam 20171009 58036.3 344.8 – 23.26 ± 0.11 23.93 ± 0.12 23.48 ± 0.09 DECam 20171013 58040.3 348.6 – 23.74 ± 0.07 – 23.66 ± 0.10 DECam 20171018 58045.3 353.3 24.90 ± 0.25 23.74 ± 0.07 24.04 ± 0.12 23.64 ± 0.11 DECam 20171025 58052.1 359.7 25.00 ± 0.24 23.85 ± 0.10 24.00 ± 0.15 23.54 ± 0.10 DECam 20171030 58057.2 364.5 – 23.70 ± 0.09 24.02 ± 0.12 23.55 ± 0.08 DECam 20171106 58064.2 371.1 – 23.53 ± 0.12 24.19 ± 0.16 23.67 ± 0.11 DECam 20171113 58071.2 377.7 – 23.79 ± 0.06 23.93 ± 0.10 23.62 ± 0.09 DECam 20171118 58076.3 382.5 25.17 ± 0.32 23.93 ± 0.10 24.19 ± 0.18 – DECam 20171121 58079.1 385.1 – – – 23.79 ± 0.12 DECam 20171124 58082.2 388.0 – 23.92 ± 0.08 24.34 ± 0.17 – DECam 20171126 58084.3 390.0 25.02 ± 0.36 – – 23.75 ± 0.11 DECam 20171204 58092.2 397.4 – – – 23.90 ± 0.15 DECam 20171210 58098.2 403.1 24.56 ± 0.24 23.93 ± 0.10 24.33 ± 0.17 23.85 ± 0.14 DECam 20171213 58101.2 405.9 – 24.09 ± 0.10 24.49 ± 0.17 – DECam 20171219 58107.2 411.6 24.97 ± 0.24 24.05 ± 0.07 24.73 ± 0.16 23.96 ± 0.13 DECam 20171229 58117.1 420.9 – 23.97 ± 0.31 24.70 ± 0.32 24.01 ± 0.22 DECam 20180105 58124.1 427.5 – 24.34 ± 0.08 24.65 ± 0.14 24.05 ± 0.11 DECam 20180112 58131.1 434.1 – 24.47 ± 0.30 25.17 ± 0.33 24.11 ± 0.12 DECam 20180118 58137.1 439.7 – 24.55 ± 0.14 – 24.37 ± 0.24 DECam 20180122 58141.1 443.5 – 24.65 ± 0.28 – – DECam 20180203 58153.1 454.8 – 24.48 ± 0.12 – – DECam 20180210 58160.0 461.3 – 24.76 ± 0.20 – – DECam
Notes:The magnitudes have not been corrected for extinction. DECam: Dark Energy Camera at Blanco 4-m telescope; EFOSC2: ESO Faint Object Spectrograph and Camera at the 3.5-m ESO New Technology Telescope (NTT); GROND: Gamma-Ray Burst Optical/Near-Infrared Detector at the 2.2-m MPG telescope; LDSS3: Low Dispersion Survey Spectrograph at the Magellan Clay 6.5-m telescope; FORS2: FOcal Reducer/low dispersion Spectrograph 2 at the ESO Very Large Telescope (VLT).
Table A2.χ2for the power-law and exponential fits at late-time (between 280 and 500 days from explosion).
SN χ2Power-law χ2Exponential (accretion power) (56Co decay)
DES16C3cje 0.710 2.384
SN 1987A 14.060 2.551
SN 2005cs 5.871 0.249
SN 2009E 2.510 0.116
Table A3.Parameters of the best models presented in Figure4.
Model Mass Radius Energy Ni mass M0Û Reference (M ) (R ) (Foe) (M ) (M s−1) (Colour)
RSG 15 830 0.11 0.095 ... Green line
RSG 15 830 0.11 0.095 0.5 × 10⁻⁸ Blue line
BSG 40 100 1.0 0.085 ... Cyan line
40
41
42
43
log
10L
bol(er
g
s
− 1)
E=0.11 foe ˙ M0= 0.5× 10⁻⁸M s−1 DES16C3cje 12 M , 595 R ,56Ni=0.075 M 15 M , 840 R ,56Ni=0.065 M 15 M , 840 R ,56Ni=0.085 M 18 M , 970 R ,56Ni=0.075 M0
1000
2000
F
eI
I
5169
velo
cit
y
[km
s
− 1]
E=0.11 foe ˙ M0= 0.5× 10⁻⁸M s−1 DES16C3cje 12 M , 595 R ,56Ni=0.075 M 15 M , 840 R ,56Ni=0.065 M 15 M , 840 R ,56Ni=0.085 M 18 M , 970 R ,56Ni=0.075 M40
42
log
10L
bol(er
g
s
− 1)
M=15 M R=840 R ˙ M0= 0.5× 10⁻⁸M s−1 DES16C3cjeE=0.11 foe,56Ni=0.065 M E=0.11 foe,56Ni=0.085 M
E=0.15 foe,56Ni=0.075 M
E=0.20 foe,56Ni=0.075 M
E=0.30 foe,56Ni=0.075 M
0
2000
F
eI
I
5169
velo
cit
y
[km
s
− 1]
M=15 M R=840 R M0= 0.5˙ × 10−8M s−1 DES16C3cjeE=0.11 foe,56Ni=0.065 M
E=0.11 foe,56Ni=0.085 M
E=0.15 foe,56Ni=0.075 M
E=0.20 foe,56Ni=0.075 M
E=0.30 foe,56Ni=0.075 M
40
41
42
log
10L
bol(er
g
s
− 1)
M=15 M R=840 R E=0.11 foe ˙ M0= 0.5× 10⁻⁸M s−1 DES16C3cje 56Ni=0.060 M 56Ni=0.065 M 56Ni=0.085 M 56Ni=0.090 M0
1000
2000
F
eI
I
5169
velo
cit
y
[km
s
− 1]
M=15 M R=840 R E=0.11 foe ˙ M0= 0.5× 10⁻⁸M s−1 DES16C3cje 56Ni=0.060 M 56Ni=0.065 M 56Ni=0.085 M 56Ni=0.090 M0
200
400
Rest-frame days from explosion
40
41
42
43
log
10L
bol(er
g
s
− 1)
M=15 M R=840 R E=0.11 foe 56Ni=0.075 M DES16C3cje ˙ M0= 0.1× 10⁻⁸M s−1 ˙ M0= 0.5× 10⁻⁸M s−1 ˙ M0= 1.0× 10⁻⁸M s−10
200
400
Rest-frame days from explosion
0
1000
2000
F
eI
I
5169
velo
cit
y
[km
s
− 1]
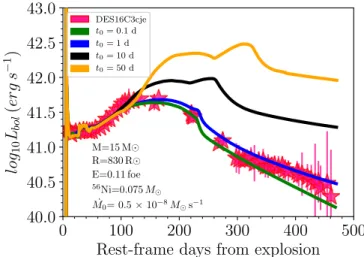
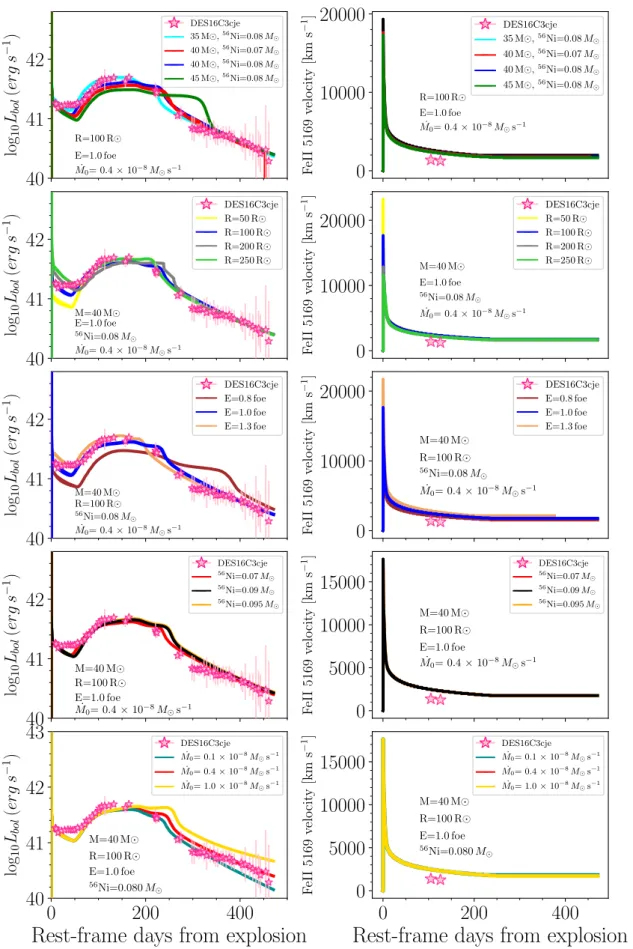
M=15 M R=840 R E=0.11 foe 56Ni=0.075 M DES16C3cje ˙ M0= 0.1× 10⁻⁸M s−1 ˙ M0= 0.5× 10⁻⁸M s−1 ˙ M0= 1.0× 10⁻⁸M s−1Figure B.1. Left:Bolometric light curve of DES16C3cje (stars) compared with the results of the light curve calculations from hydro-dynamic models. For each plot, the legend shows the differences in the models, while the parameters with similar values are presented next to the curves. Right: Evolution of the photospheric velocity for the models presented in the left panel compared with measured Fe II 5169 ˚Aline velocities of DES16C3cje.
0
100
200
300
400
500
Rest-frame days from explosion
40.0
40.5
41.0
41.5
42.0
42.5
43.0
log
10L
bol(er
g
s
− 1)
M=15 M R=830 R E=0.11 foe 56Ni=0.075 M ˙ M0= 0.5× 10⁻⁸M s−1 DES16C3cje t0= 0.1 d t0= 1 d t0= 10 d t0= 50 dFigure B.2.Bolometric light curve of DES16C3cje (stars) compared with the results of the light curve calculations from hydrodynamic models. The continuous lines show the effect of t0in the 15 M model. The used parameters are presented on the bottom.