HAL Id: hal-02645211
https://hal.inrae.fr/hal-02645211
Submitted on 29 May 2020
HAL is a multi-disciplinary open access
archive for the deposit and dissemination of
sci-entific research documents, whether they are
pub-lished or not. The documents may come from
teaching and research institutions in France or
abroad, or from public or private research centers.
L’archive ouverte pluridisciplinaire HAL, est
destinée au dépôt et à la diffusion de documents
scientifiques de niveau recherche, publiés ou non,
émanant des établissements d’enseignement et de
recherche français ou étrangers, des laboratoires
publics ou privés.
Genetic structure and mating system of wild cowpea
populations in West Africa
Eric B. Kouam, Remy S. Pasquet, Pascal Campagne, Jean-Baptiste Tenegre,
Kevin Thoen, Rémi Gaudin, Jeremy T. Ouedraogo, Abdulai B. Salifu,
Geoffrey M. Muluvi, Paul Gepts
To cite this version:
Eric B. Kouam, Remy S. Pasquet, Pascal Campagne, Jean-Baptiste Tenegre, Kevin Thoen, et al..
Genetic structure and mating system of wild cowpea populations in West Africa. BMC Plant Biology,
BioMed Central, 2012, 12, �10.1186/1471-2229-12-113�. �hal-02645211�
cowpea populations in West Africa
Kouam et al.
Kouam et al. BMC Plant Biology 2012, 12:113 http://www.biomedcentral.com/1471-2229/12/113
R E S E A R C H A R T I C L E
Open Access
Genetic structure and mating system of wild
cowpea populations in West Africa
Eric B Kouam
1,2, Remy S Pasquet
1,3,4*, Pascal Campagne
3,4, Jean-Baptiste Tignegre
5, Kevin Thoen
1, Remi Gaudin
6,7,
Jeremy T Ouedraogo
5, Abdulai B Salifu
8, Geoffrey M Muluvi
9and Paul Gepts
10Abstract
Background: Cowpea is a highly inbred crop. It is part of a crop-weed complex, whose origin and dynamics is unknown, which is distributed across the African continent. This study examined outcrossing rates and genetic structures in 35 wild cowpea (Vigna unguiculata ssp. unguiculata var. spontanea) populations from West Africa, using 21 isozyme loci, 9 of them showing polymorphism.
Results: Outcrossing rates ranged from 1% to 9.5% (mean 3.4%), which classifies the wild cowpea breeding system as primarily selfing, though rare outcrossing events were detected in each population studied. Furthermore, the analyses of both the genetic structure of populations and the relationships between the wild and domesticated groups suggest possibilities of gene flow that are corroborated by field observations.
Conclusions: As expected in a predominantly inbred breeding system, wild cowpea shows high levels of genetic differentiation and low levels of genetic diversity within populations. Gene flow from domesticated to wild cowpea does occur, although the lack of strong genetic swamping and modified seed morphology in the wild populations suggest that these introgressions should be rare.
Background
Agricultural systems present spectacular and well studied examples of evolutionary changes [1]. Indeed, crops and their wild relatives represent interesting systems from both agricultural and evolutionary points of view. Wild relatives represent larger amounts of genetic variability than their domesticated descendants and the mainten-ance of this variability is of central importmainten-ance in crop conservation and improvement programs [2-4]. Wild relatives may also represent actual or potential weeds and they often constitute crop-weed complexes with the domesticated plants [1,5]. On the other hand, wild rela-tives are critical for understanding the process of domes-tication [6-8] as they illustrate how evolutionary forces operate with or without strong artificial selection [9-11].
Cowpea, Vigna unguiculata (L.) Walp., plays an im-portant role in the livelihood of millions of poor people
in the developping countries of the tropical region where it is used as food, animal feed or as a cash crop [12]. Genetic variability of domesticated cowpea is low [13,14] and most of the genetic variation of this species remains in the wild gene pool [15].
As compared to wild cowpea, domesticated cowpea is characterized by large seeds and non-shattering pods. This crop was domesticated once from its wild progeni-tor var. spontanea somewhere in between Senegal and Eritrea although its precise origin is yet to be established [15]. This domestication took place well before 1500 BC since clearly identifiable domesticated cowpea seeds were found in archaeological deposits dated around 1500 BC, both in central Ghana and in India [16]. Domesticated cowpea experienced a double bottleneck: first from its wild progenitor leading to the primitive cultivar-groups (cv.-gr. Biflora and cv.-gr. Textilis), and then from the primitive cultivar-groups to the evolved cultivar-groups (cv.-gr. Melanophthalmus in West Africa and cv.-gr. Ses-quipedalis in Asia) [13]. This partly explains the low diver-sity of cv.-gr. Melanophthalmus [14].
The wild progenitor of cowpea (V. unguiculata subsp. unguiculatavar. spontanea (Schweinf.) Pasquet, formerly
* Correspondence:rpasquet@icipe.org
1International Centre of Insect Physiology and Ecology, P.O box 30772,
Nairobi, Kenya
3IRD, Institut de Recherche pour le Développement, UR 072, Laboratoire
Evolution, Génomes et Spéciation, UPR 9034, Centre National de la Recherche Scientifique (CNRS), 91198 Gif sur Yvette Cedex, France Full list of author information is available at the end of the article
© 2012 Kouam et al.; licensee BioMed Central Ltd. This is an Open Access article distributed under the terms of the Creative Commons Attribution License (http://creativecommons.org/licenses/by/2.0), which permits unrestricted use, distribution, and reproduction in any medium, provided the original work is properly cited.
Kouam et al. BMC Plant Biology 2012, 12:113 http://www.biomedcentral.com/1471-2229/12/113
known as subsp. dekindtiana sensu Verdc.) interbreeds and produces fertile offspring through hybridization with domesticated cowpea (var. unguiculata) [17]. This wild progenitor of cowpea is a weed, mostly encountered in cultivated fields and disturbed habitats. This crop-weed complex is distributed over a wide geographical range in Africa [18-20]. However, while the existence of this crop-weed complex is obvious based on both morphological and molecular data, its origin and dy-namics remain obscure.
Low levels of gene flow were detected by all authors who have run source and sink trials with cowpea breed-ing lines: between 0 and 0.85% on average but with some plots where outcrossing rates could reach 4 – 5% [21-23]. Pollinator studies show that pollen may theoret-ically be dispersed over distances of several kilometers and exchanged between wild and domesticated plants [24]. Nevertheless, the effect of pollen movement on population structure is unknown. Both domesticated cowpea and its wild progenitor are characterized by a flower structure that should promote inbreeding [25]. Accordingly, domesticated cowpea is known as an highly inbred crop [26,27]. Therefore, gene flow between domesticated and wild cowpeas could be negligible.
Last but not least, an insect-resistant genetically engi-neered (GE) cowpea has been recently developed and may become available to African farmers in the forth-coming years [28]. The GE-cowpea expressing toxins of Bacillus thuringiensis targets the pod borer (Maruca vitrataFabricius; Lepidoptera: Pyraloidea: Crambidae), a migrant moth (from Guinean zone where cowpea is a minor crop to Sudan and Sahel zones where cowpea is a major crop) causing almost yearly, often devastating outbreaks for the cowpea crops. This project is currently based on the use of a Cry1Ab gene, although a two genes pyramided construction is expected to be used in the fu-ture. The project is currently focusing on Ghana, Burkina Faso, and Nigeria. First confined field trials in Nigeria ap-pear very promising (http://www.aatf-africa.org).
Although autogamous mating systems should favour gene containment in the crop, the possible escape of transgenes encoding insecticidal proteins into wild rela-tive populations might enhance the fitness of wild indivi-duals. In a worst-case scenario, wild cowpea loosing major predators could become a more aggressive weed.
However, wild cowpea has never been studied at the population level and gene flow has never been studied within natural wild cowpea populations. Such studies are necessary to draw a preliminary assessment of the po-tential fixation and spread of transgenes in natural popu-lations [1].
The present study was undertaken in order to investi-gate the mating system and the genetic structure of populations in the wild cowpea, in a region encompassing
four countries of West Africa, two of them targeted by the Bt-cowpea project. We used allozymes as genetic markers to address the following research questions: (1) How inbred are the wild cowpea populations in this region? 2) Is there evidence of gene-flow between populations, especially be-tween domesticated and wild populations of the cowpea gene pool? Both questions appear critical in the light of the forthcoming deployment of GE insect-resistant cowpea in West African countries.
Results
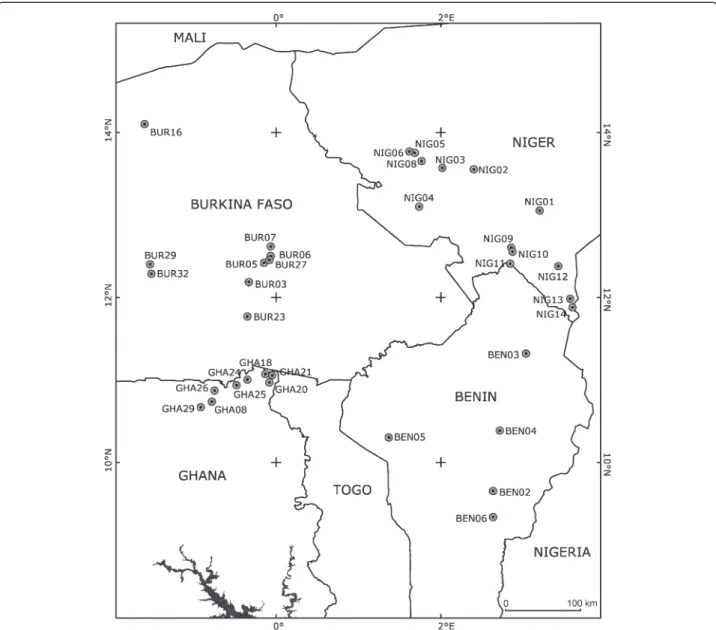
A total of 3209 (2977 wild and 232 domesticated) seeds originating from 455 (397 wild and 58 domesticated) plants were analyzed. The genotype of the 397 wild plants was inferred: 52 plants from 8 populations in Ghana, 64 from 9 populations in Burkina Faso, 216 plants from 13 populations in Niger, and 65 plants from 5 populations in Benin (Figure 1 and Table 1).
Of the 21 loci screened, nine were polymorphic (Amp2, Amp3, Amp4, Enp, Fdh, Fle3, Pgi2, Pgi3, and Pgm1) with 1.5 alleles per locus at the species level. The Enp103 allele was encountered in a single plant from population BUR05. The Amp3103and Enp98 alleles were found only in Burkina Faso, while the Pgm196 and Pgm1105alleles were found in Niger only. At the popula-tion level, 11% of loci were polymorphic and the number of alleles per locus (A) was 1.1 (maximum 1.3 in BUR 29 and NIG 12). The effective number of allele Ae per population, defined as the inverse of the homozygosity 1/(1-He), was 1.032 (±0.005, Standard Error). Eight wild populations – from Benin, Ghana, and Niger – were monomorphic (Table 1).
Mating system analysis
Wright’s FIS indicated clear deviations from
Hardy-Weinberg equilibrium (Table 1). In the domesticated populations, no heterozygote was found and the over-all FIS estimate was significantly greater than zero
(FIS= 0.657; P< 0.001, randomization test) in the wild
populations. Fifteen populations were large and poly-morphic enough to analyze the mating system of wild cowpea using the MLTR software [29]. The analysis of the mating system was carried out by comparing the inferred genotypes of mother plants to the geno-types of the progenies. High levels of self-fertilization were detected in all populations (Table 2). The aver-age outcrossing rate (t) based on multilocus- (tm) and single-locus- (ts) estimations were significantly lower than 1 (tm: P< 0.001, ts: P < 0.001, Wilcoxon signed rank test).
In the wild populations, estimates of outcrossing rates respectively based on a multilocus and an averaged single-locus estimator were tm = 0.034 ± 0.007 and ts= 0.024 ± 0.004, respectively. Outcrossing rate estimates
tm ranged from 0.01 (BUR29, BUR32, NIG09, NIG11) to 0.095 (BUR05). Therefore, wild Vigna unguiculata is a highly inbred plant with up to 97% of self-pollination occurrences (calculated as 1 - tm). The amount of biparen-tal inbreeding was assessed with the difference tm-ts. The average biparental inbreeding (0.010 ± 0.003) dif-fered significantly from zero (P = 0.008, Wilcoxon signed rank test) while it represented only 1% of the overall apparent inbreeding, indicating a low but signifi-cant occurence of mating between close relatives. In six populations (BUR07, BUR27, NIG05, NIG12, NIG13, NIG14) out of the 15 wild populations, the biparental inbreeding was higher than zero (P< 0.05, bootstrap included in the MLTR procedure). Significant heterogen-eity in multilocus outcrossing rates (tm) was observed
among the fifteen populations analysed (χ² = 301.81, P < 0.001). This result does not include tm values with zero as standard error. We failed to find any correlations be-tween the multilocus outcrossing rate and the population size (Spearman’s R = −0.23, P = 0.409).
Inbreeding coefficient based on genotypic frequencies of maternal plants (F) was positive and significantly greater than zero (Table 2). Expected inbreeding coeffi-cients at equilibrium, as estimated from the multilocus outcrossing rates (Fe), were greater than the observed maternal inbreeding coefficients (F), a trend that was statistically significant (P = 0.026, Wilcoxon signed rank test). The (Fe - F) values differed significantly (U-test, P= 0.006) according to the type of habitat (natural vs. disturbed), with a positive median of 0.238 in the Figure 1 Geographical locations of the 35 sampling sites reported in Table 1. All locations correspond to wild cowpea populations,
excepted BEN05, BUR03, GHA26, NIG04, NIG10, NIG12, and NIG13 where wild and domesticated populations were sampled.
Kouam et al. BMC Plant Biology 2012, 12:113 Page 3 of 13
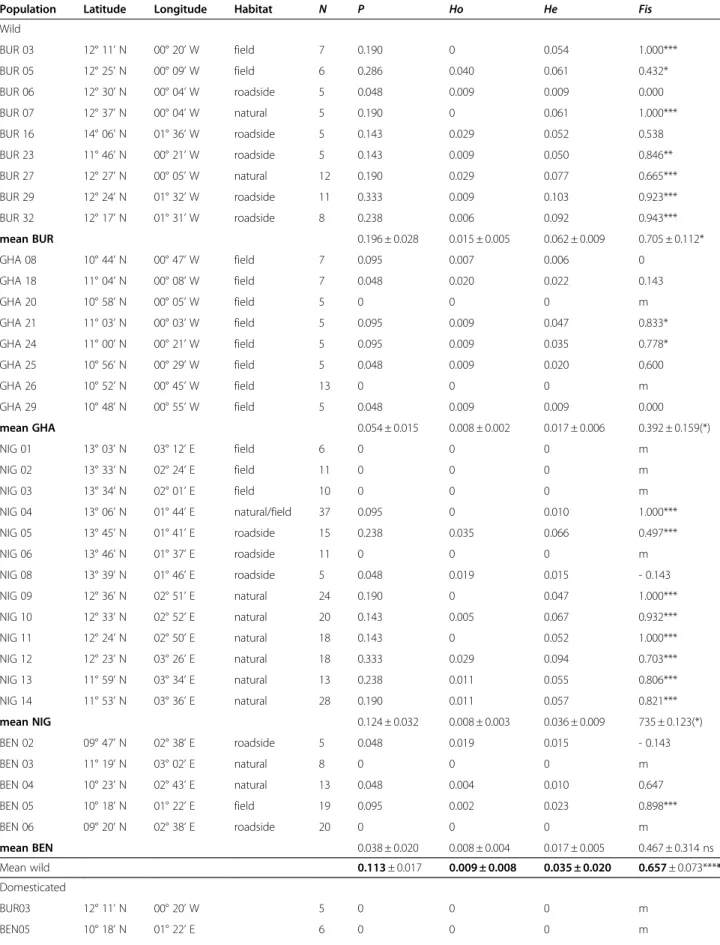
Table 1 Description of the sampling sites: geographic coordinates, habitat and indices of genetic diversity
Population Latitude Longitude Habitat N P Ho He Fis
Wild BUR 03 12° 11’ N 00° 20’ W field 7 0.190 0 0.054 1.000*** BUR 05 12° 25’ N 00° 09’ W field 6 0.286 0.040 0.061 0.432* BUR 06 12° 30’ N 00° 04’ W roadside 5 0.048 0.009 0.009 0.000 BUR 07 12° 37’ N 00° 04’ W natural 5 0.190 0 0.061 1.000*** BUR 16 14° 06’ N 01° 36’ W roadside 5 0.143 0.029 0.052 0.538 BUR 23 11° 46’ N 00° 21’ W roadside 5 0.143 0.009 0.050 0.846** BUR 27 12° 27’ N 00° 05’ W natural 12 0.190 0.029 0.077 0.665*** BUR 29 12° 24’ N 01° 32’ W roadside 11 0.333 0.009 0.103 0.923*** BUR 32 12° 17’ N 01° 31’ W roadside 8 0.238 0.006 0.092 0.943*** mean BUR 0.196 ± 0.028 0.015 ± 0.005 0.062 ± 0.009 0.705 ± 0.112* GHA 08 10° 44’ N 00° 47’ W field 7 0.095 0.007 0.006 0 GHA 18 11° 04’ N 00° 08’ W field 7 0.048 0.020 0.022 0.143 GHA 20 10° 58’ N 00° 05’ W field 5 0 0 0 m GHA 21 11° 03’ N 00° 03’ W field 5 0.095 0.009 0.047 0.833* GHA 24 11° 00’ N 00° 21’ W field 5 0.095 0.009 0.035 0.778* GHA 25 10° 56’ N 00° 29’ W field 5 0.048 0.009 0.020 0.600 GHA 26 10° 52’ N 00° 45’ W field 13 0 0 0 m GHA 29 10° 48’ N 00° 55’ W field 5 0.048 0.009 0.009 0.000 mean GHA 0.054 ± 0.015 0.008 ± 0.002 0.017 ± 0.006 0.392 ± 0.159(*) NIG 01 13° 03’ N 03° 12’ E field 6 0 0 0 m NIG 02 13° 33’ N 02° 24’ E field 11 0 0 0 m NIG 03 13° 34’ N 02° 01’ E field 10 0 0 0 m NIG 04 13° 06’ N 01° 44’ E natural/field 37 0.095 0 0.010 1.000*** NIG 05 13° 45’ N 01° 41’ E roadside 15 0.238 0.035 0.066 0.497*** NIG 06 13° 46’ N 01° 37’ E roadside 11 0 0 0 m NIG 08 13° 39’ N 01° 46’ E roadside 5 0.048 0.019 0.015 - 0.143 NIG 09 12° 36’ N 02° 51’ E natural 24 0.190 0 0.047 1.000*** NIG 10 12° 33’ N 02° 52’ E natural 20 0.143 0.005 0.067 0.932*** NIG 11 12° 24’ N 02° 50’ E natural 18 0.143 0 0.052 1.000*** NIG 12 12° 23’ N 03° 26’ E natural 18 0.333 0.029 0.094 0.703*** NIG 13 11° 59’ N 03° 34’ E natural 13 0.238 0.011 0.055 0.806*** NIG 14 11° 53’ N 03° 36’ E natural 28 0.190 0.011 0.057 0.821*** mean NIG 0.124 ± 0.032 0.008 ± 0.003 0.036 ± 0.009 735 ± 0.123(*) BEN 02 09° 47’ N 02° 38’ E roadside 5 0.048 0.019 0.015 - 0.143 BEN 03 11° 19’ N 03° 02’ E natural 8 0 0 0 m BEN 04 10° 23’ N 02° 43’ E natural 13 0.048 0.004 0.010 0.647 BEN 05 10° 18’ N 01° 22’ E field 19 0.095 0.002 0.023 0.898*** BEN 06 09° 20’ N 02° 38’ E roadside 20 0 0 0 m mean BEN 0.038 ± 0.020 0.008 ± 0.004 0.017 ± 0.005 0.467 ± 0.314 ns Mean wild 0.113 ± 0.017 0.009 ± 0.008 0.035 ± 0.020 0.657 ± 0.073**** Domesticated BUR03 12° 11’ N 00° 20’ W 5 0 0 0 m BEN05 10° 18’ N 01° 22’ E 6 0 0 0 m
disturbed habitats (roadside and field as indicated in Table 1) and a negative median value (−0.018) in less dis-turbed habitats (i.e., “natural habitats” in Table 1). BEN03, BEN04, BUR07, BUR27 are river and pond banks while NIG10, NIG12, NIG13, NIG14 are partly or totally in “bas-fonds”, partly flooded during the rainy season. Furthermore this difference among habitat types was not related to variations in the Fe values (U– test, P = 0.517) in these habitats, but was mainly associated with low F values (U– test, P = 0.012) in disturbed habitats.
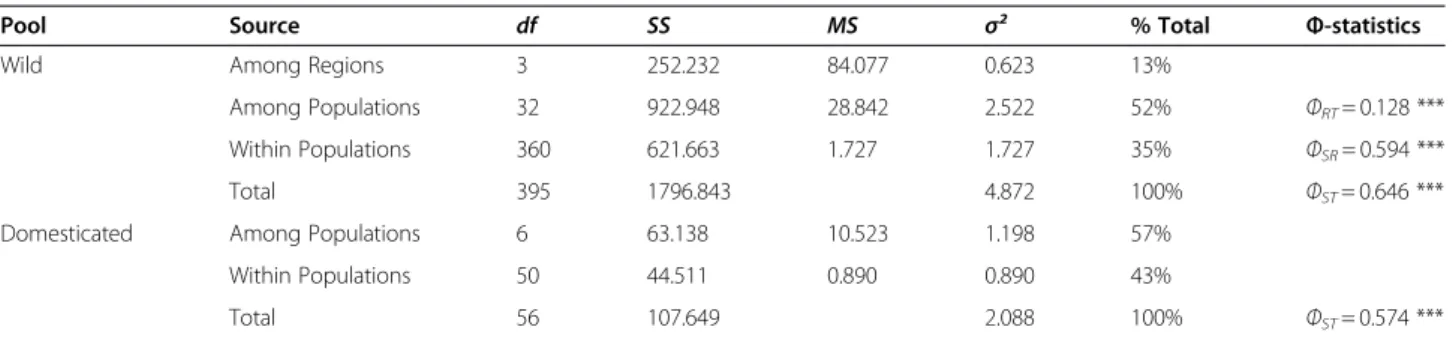
Genetic differentiation and spatial genetic structure AMOVA (Analysis of Molecular Variance) revealed substantial geographic differentiation in both wild and domesticated populations (Table 3). In the wild popu-lations, a strong and statistically significant genetic dif-ferentiation was found at the two hierarchical levels (country and population) indicating a clear geographic structure. Genetic differentiation among populations was high in both wild (ΦST= 0.646, P< 0.001) and
domesticated populations (ΦST= 0.574, P< 0.001). Table 1 Description of the sampling sites: geographic coordinates, habitat and indices of genetic diversity (Continued)
GHA26 10° 52’ N 00° 45’ W 9 0.048 0 0.024 1.000*** NIG 04 13° 06’ N 01° 44’ E 8 0.095 0 0.042 1.000*** NIG 10 12° 33’ N 02° 52’ E 8 0 0 0 m NIG 12 12° 23’ N 03° 26’ E 12 0.048 0 0.018 1.000*** NIG 13 11° 59’ N 03° 34’ E 10 0.048 0 0.009 1.000*** Mean domesticated 0.034 ± 0.014 0 ± 0.000 0.013 ± 0.006 1.000 ± 0.000***
N, Number of Individual sampled; P, Proportion of polymorphic loci; Ho, observed heterozygosity; He, Hardy-Weinberg expected heterozygosity; Fis, Inbreeding coefficient over the 21 loci. Significant test for departure from Hardy-Weinberg Equilibrium are indicated as ns for P> 0.1, (*) for P < 0.1, * for P < 0.050; ** for P< 0.010 and *** for P < 0.001. m, Monomorphic.
Table 2 Outcrossing rates and inbreeding coefficient
Population Sample sizes tm ± SE ts ± SE (tm-ts) ± SE F Fe Fe - F
m n BUR03 112 13 0.014 ± 0.007 0.014 ± 0.007 0.000 ± 0.000 0.649 0.972 0.323 BUR05 105 11 0.095 ± 0.035 0.064 ± 0.024 0.031 ± 0.017 0.458 0.826 0.368 BUR07 148 14 0.061 ± 0.007 0.044 ± 0.006 0.017 ± 0.004 0.990 0.885 −0.105 BUR16 108 13 0.013 ± 0.002 0.014 ± 0.002 0.000 ± 0.000 0.736 0.974 0.238 BUR23 102 11 0.028 ± 0.014 0.020 ± 0.014 0.008 ± 0.003 0.753 0.946 0.193 BUR27 110 12 0.050 ± 0.008 0.038 ± 0.007 0.012 ± 0.003 0.689 0.905 0.216 BUR29 106 12 0.010 ± 0.000 0.010 ± 0.000 0.000 ± 0.000 0.906 0.980 0.074 BUR32 98 11 0.010 ± 0.000 0.010 ± 0.000 0.000 ± 0.000 0.879 0.980 0.101 Mean BUR 0.035 ± 0.011** 0.027 ± 0.007** 0.009 ± 0.004(*) 0.758 ± 0.059** 0.934 ± 0.020** 0.176 ± 0.0532* NIG05 146 15 0.063 ± 0.019 0.020 ± 0.010 0.044 ± 0.014 0.471 0.881 0.410 NIG09 214 24 0.010 ± 0.000 0.010 ± 0.000 0.000 ± 0.000 0.892 0.980 0.088 NIG10 172 20 0.016 ± 0.002 0.012 ± 0.001 0.004 ± 0.001 0.948 0.969 0.021 NIG11 182 18 0.010 ± 0.000 0.010 ± 0.000 0.000 ± 0.000 0.889 0.980 0.091 NIG12 276 28 0.037 ± 0.003 0.025 ± 0.002 0.012 ± 0.001 0.990 0.929 −0.061 NIG13 164 17 0.034 ± 0.004 0.022 ± 0.003 0.012 ± 0.002 0.990 0.934 −0.056 NIG14 126 13 0.058 ± 0.004 0.040 ± 0.003 0.017 ± 0.002 0.990 0.890 −0.100 mean NIG 0.033 ± 0.008* 0.020 ± 0.004* 0.013 ± 0.006(*) 0.881 ± 0.070* 0.938 ± 0.016* 0.056 ± 0.065 ns Mean 0.034 ± 0.007*** 0.024 ± 0.004*** 0.010 ± 0.003** 0.815 ± 0.028*** 0.936 ± 0.013*** 0.125 ± 0.043*
tm is the multilocus population outcrossing rate, ts is the averaged single locus estimate of outcrossing rate, a positive and significant (tm– ts) reflects biparental inbreeding. F is the (minimum variance estimate of) single locus inbreeding coefficient of maternal parents, Fe is the expected inbreeding coefficient at equilibrium, (Fe-F) quantifies deviation from inbreeding equilibrium based on selfing rate (Fe). tm and ts were tested to differ from 1, the other parameters were tested to differ from zero. Significance levels correspond to the results of non-parametric Wilcoxon signed rank tests, ns for P> 0.1, (*) for P < 0.1, * for P < 0.050; ** for P<0.010 and *** for P < 0.001.
Outcrossing rates estimates and inbreeding coefficient were computed for 15 wild cowpea populations by comparing the inferred maternal genotypes to the progeny genotypes.
Kouam et al. BMC Plant Biology 2012, 12:113 Page 5 of 13
A pattern of isolation by distance was revealed by the regular decay of the coefficient of spatial autocorrelation. Significantly positive autocorrelation was found for the lowest distance classes (up to 100 km), in the wild popu-lations only (Figure 2). A Mantel test did not reveal any significant effect of geographic distance in the domesti-cated populations (P = 0.755, permutations).
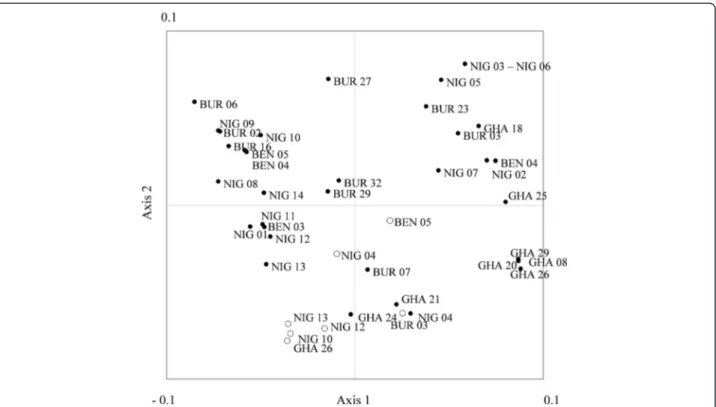
Relationship between wild and domesticated populations As expected, domesticated cowpea diversity was very low, without a single heterozygous genotype observed (Table 1, Ho). In the Principal Coordinates Analysis (PCO) performed on the inferred genotypes of the wild and domesticated populations (Figure 3), the two first axes accounted for 73.6% of the total variation. Even if some wild populations originating from a same country, such as GHA 08, GHA20, GHA26, GHA29, were associated, no
exclusive association based on the country of origin was observed. All domesticated populations were grouped at the negative part of Axis 2. However, four wild populations (BUR07, GHA21, GHA24, and NIG04) were associated with this domesticated group. The last autocorrelation analysis (Figure 4) revealed positive and significant allelic correlations between pairs of wild and domesticated populations at a dis-tance lower than 100 km.
Discussion
The genetic structure of cowpea populations is highly determined by its mating system characterised by a high selfing rate. Moreover, in line with a previous study [23], our data are also strongly suggestive of genetic exchanges presumably caused by pollinator activity. The genetic variation in Vigna unguiculata ssp unguiculata Table 3 Analysis of Molecular Variance (AMOVA)
Pool Source df SS MS σ² % Total Φ-statistics
Wild Among Regions 3 252.232 84.077 0.623 13%
Among Populations 32 922.948 28.842 2.522 52% ΦRT= 0.128 ***
Within Populations 360 621.663 1.727 1.727 35% ΦSR= 0.594 ***
Total 395 1796.843 4.872 100% ΦST= 0.646 ***
Domesticated Among Populations 6 63.138 10.523 1.198 57%
Within Populations 50 44.511 0.890 0.890 43%
Total 56 107.649 2.088 100% ΦST= 0.574 ***
df indicates the degree of freedom, SS sum of squares, MS mean sum of squares,σ² the estimated component of variance attributable to each factor and Φ the estimation of the genetic differentiation.. * P< 0.050, ** P < 0.010; *** P < 0.001.
Analysis of Molecular Variance (AMOVA) in both, the wild and the domesticated populations. Two hierarchical levels were analyzed in the wild populations: country level (regions, R), population level (S) and only one level, the population level (S), was analyzed in domesticated populations.
Figure 2 Pattern of isolation by distance. Pattern of isolation by distance in the wild populations. Correlogram plot of the genetic autocorrelation coefficient as a function of the geographical distance classes; dotted lines define the 95%-confidence interval based on 999 permutations.
var. spontanea is low compared to those previously reported in cowpea using allozymes e.g., [15,30,31]. However, these studies surveyed several subspecies and were therefore encompassing a much larger part of the cowpea gene pool. Previous results related to var.
spontanea (accessions from almost all sub-Saharan Af-rica) [15] showed higher diversity than the ones reported here, suggesting that West African var. spontanea repre-sents just a subset of the diversity of the whole var. spontanea. Indeed, the study of Coulibaly et al. [19] based Figure 3 Principal coordinate analysis. PCO (Principal coordinate) map (Axes 1 and 2) of the sampled populations based on their genetic distances. White dots correspond to domesticated populations; black dots, wild populations. The two first axes accounted for 73.6% of the total variation (43.2% and 30.4% for axis 1 and axis 2, respectively).
Figure 4 Autocorrelation analysis. Autocorrelation analysis of wild-domesticated pairs of populations (rW-D) performed on asymmetrical
distance matrices. Plot of the genetic autocorrelation coefficient as a function of the geographical distance classes; dotted lines define the 95%-confidence interval based on 999 permutations.
Kouam et al. BMC Plant Biology 2012, 12:113 Page 7 of 13
on AFLP markers (Amplified Fragment Length Poly-morphism) markers revealed var. spontanea to be more diverse in eastern than in western Africa. Population genetic study in a wild cowpea population in East Africa (coastal Kenya) shows much higher outcrossing rates than in West Africa (Kouam, unpublished). Reasons explaining the low genetic diversity in the western popu-lations could therefore include a predominantly selfing mating system and/or loss of genetic diversity occurring after genetic bottlenecks during the colonization of dryer savannas linked to the breeding system change [19].
West African var. spontanea could be classified as pri-marily selfed plant, according to the criterion of Schemske and Lande [32]. In the present study, out-crossing rates t ranged from 1 to 9.5% across fifteen populations, with a mean equal to 3.4%. The high rates of apparent selfing in wild cowpea populations are con-sistent with the cowpea flower morphology [25]. In West African var. spontanea, anthers are in contact with the stigmatic surface within the flower bud. Anthers release pollen during the first half of the night [33] and the cu-ticle that protects the stigmatic surface is ruptured dur-ing the second half of the night, which means that pollen can start to germinate on the stigmatic surface a few hours before the opening of the flower (Pasquet, un-published observations).
Although consistent with previous results, the out-crossing rates we estimated are markedly higher than previous studies based on pollen flow source and sink trials [21-23]. However, the source and sink trials that were used cannot necessarily detect the shortest pollen moves. Our study focused on naturally occurring popu-lations where individuals (eventually both cultivated and wild plants) can stand few cm apart while source and sink trials typically examine pollen flow between spatially clustered groups of plants usually separated by at least one meter.
A low but significant level of biparental inbreeding confirms the local activity of cowpea pollinators in West Africa. Such trends (low outcrossing rates and low bipar-ental inbreeding) are encountered in numerous wild relatives of inbred legume crops [34-40]. Cowpea polli-nators either belong to the genus Xylocopa or the family Megachilidae (Tignegre, unpublished observations). They visit most of cowpea flowers at least once on aver-age. However, these pollinators are expected to do many more flower-to-flower flights within a flower patch than between flower patches [24,41]. According to Godt and Hamrick [42], the genetic effect of such pollinator be-haviour is to reduce the single-locus outcrossing esti-mates, as observed here. The rather high level of pollinator activity is counteracted by bud self-fertilization (up to 97%). In turn, this mating system leads to almost complete deviations from Hardy-Weinberg
equilibrium with a marked heterozygote deficiency [43]. Moreover, the difference between the observed deficit of heterozygotes (F) and the theoretical equilibrium based on the estimated selfing rates tm [Fe = (1-tm)/(1 + tm)], varied according to the ecological context of the popu-lations. In rather undisturbed habitats the observed inbreeding tended to be higher than the inbreeding equilibrium while this trend was reversed in disturbed habitats (field and roadside). Field and roadside are subjected to frequent disturbances and are characte-rized notably by ground transfers causing possible rearrangements in the soil seed bank. Moreover, out-crossing rates may vary among years [44,45]. This could explain why the expected inbreeding equilibrium derived by selfing rate does not necessarily reflect the parental inbreeding.
Because pollen flow is expected to be sharply reduced when distance increases [24], local gene exchanges should mainly take place within populations, including between wild and domesticated plants when both are mixed or in close proximity. Accordingly, strong genetic differentiation should take place among populations. The existence of spatial genetic structure and its scale of organization is a reflection of gene flow in space and time in relation to the spatial distribution and the colonization history of populations. A spatial genetic structure was found for proximate wild cowpea popula-tions up to 100 km, which reflects a decreased probabil-ity to observe related individuals as the distances between populations increase. This suggests genetic exchanges among populations; however, our results do not directly shed light on the patterns of occurrence of gene flow in space and time. Gene flow via pollen in cowpea is likely to occur up to few km with a very low probability of long distance pollen dispersal, and, in any cases, pollen movement is unlikely at distances over 10 km [24]. On the other hand, seed flow through inges-tion by grazing mammals could involve much longer distances, though the percentage of seed survival through grazing mammal gut does not exceed a few per cent (Pasquet, unpublished observations). Wild cowpea is expected to express high levels of genetic differenti-ation and low levels of within-populdifferenti-ation genetic diver-sity. In this study, high genetic differentiation was observed at several spatial levels.
Significant allelic correlations between wild and domes-ticated pairs located in a same zone (distance< 100 km) suggested possibilities of genetic exchanges between these two compartments. Such correlations could arise from multiple local domestications of cowpea. However, consid-ering that cowpea domestication took place more than 3500 years (or generations) ago, and that cv.-gr. Mela-nophthalmus is the result of two bottlenecks which are likely to have occurred in different places in Africa [13],
an alternative explanation for the allelic correlations must be proposed and is supported by results from Pasquet [15], Coulibaly [19], and Feleke [20], respectively based on allele Amp2102, AFLP alleles, and a chloroplastic DNA. In these studies, alleles characterizing domesticated cowpea accessions, which are rather unfrequent in wild cowpea accessions, could have been useful to locate the center of origin of the crop. Surprisingly, such alleles were found to be widespread across Africa. The authors concluded that the presence of these alleles in wild cowpea accessions was the result of introgression of domesticated alleles into wild gene pool. Our present results represent a more dir-ect evidence of these introgressions into wild cowpea populations.
In an area largely dominated by the cultivation of cv. gr. Melanophthalmus which is characterized by three re-cessive traits, i.e., white colored seeds, thin and wrinkled seed testa, as well as non-shattering pods [46], gene flow between wild and domesticated cowpea is expected to be highly asymmetrical [20]. Because the probability of wild dominant alleles entering the domesticated gene pool is almost null, the asymmetry is expected to be higher in cowpea than in other crops where the phenomenon has been observed [39,47-52]. If a farmer sows a seed from a domesticated flower that has been fertilized by wild pollen, the F1plant will show
shatter-ing pods and smaller seeds with a thick and dark testa. Farmers are not likely to select such small seeds with thick and dark testa for the next sowing, and therefore prevent the introduction of wild alleles into the domesti-cated genepool in areas where cv.-gr. Melanophthalmus is cultivated exclusively. Of course, pollen from such an F1plant may fertilize a flower from a domesticated plant,
but the probability of recovering the domesticated phe-notypes (i.e., finding the combination of recessive alleles in the progeny of such a natural BC plant) is very low in the end. This hypothesis is confirmed for domesticated cowpea by the near-absence of variability in its popula-tions as well as the absence of some of the alleles encountered in wild cowpea (Amp491 and especially Amp2100).
Because wild and domesticated plants still co-exist, it is likely that positive and negative factors affecting the survival of hybrids balance each other out. Genetic swamping by domesticated genes would lead to the dis-appearance of wild types, which is obviously not the case. With the exception of one single wild plant, no large-seeded wild cowpea was collected. The exception produces partly white seeds and resulted probably from introgression with domesticated genes. However, this situation appeared to be an exception to a general rule. If gene flow from domesticated to wild cowpea does exist, the lack of strong genetic swamping and modified seed morphology in the wild populations suggests that
these introgressions should be rare. Alternatively, gene flow might be rather frequent while hybrids in non-cultivated environment are expected to be less fit. The white seed color makes seeds more visible to seed predators, the thinner seed coat makes seed less dor-mant, and reduced seed shattering could reduce disper-sal distances.
Conclusions
Our results showed high selfing rates in the wild cowpea populations, nevertheless possibilities of genetic exchanges within and between West African cowpea populations do exist. Numerous wild or weedy populations grow within cultivated fields or in field margins [18], well within the distance over which cowpea pollen can be transported [22-24]. Regarding the introduction of GE insect-resistant cowpea in West Africa, the escape of the transgene into the wild gene pool will just be a matter of time, even if it is likely that the move will be slow.
There may be technologies to mitigate or prevent gene flow in the future but, in the mean time, the focus should be on determining whether there are any fitness gains provided by a transgene inserted into the genome of a cowpea wild relative [53,54]. If these fitness gains are negligible, there would not be any major problem associated with gene escape accompanying deployment of insect-resistant cowpea in West Africa. Conversely, a cowpea wild relative could become a more troublesome weed in fields and other disturbed areas, given a poten-tial fitness gain provided by an insect resistance transgene. Therefore, an assessment of the potential fit-ness benefits of transgenes is a prerequisite for the deployment of GE insect resistant cowpea in West Africa.
Methods
Plant material
Wild cowpea (Vigna unguiculata ssp. unguiculata var. spontanea) seeds were sampled in 35 populations from West Africa (Table 1, Figure 1). The eighteen popula-tions from Niger and Benin were sampled in September-October 1995, the eight populations from Ghana in September-October 2002, and the nine populations from Burkina Faso in October 2003. Some domesticated cow-peas were sampled as well (Table 1). With the exception of the area where BEN05 was collected, the cultivar-group Melanophthalmus was exclusively cultivated in the whole sampling area. The low genetic diversity of this cultivated group [13,14] did not justify an intensive sampling.
Most of these populations were collected in disturbed areas (fields, field margins, recent fallows, and road-sides). Few places looked undisturbed but the lack of disturbance could also be the outcome of a prolonged
Kouam et al. BMC Plant Biology 2012, 12:113 Page 9 of 13
fallow period. Searches for a truly natural population were made in the ‘Parc du W’ in Niger but not a single wild cowpea population was found there while large populations were found not far from the park boundar-ies but in cultivated, and therefore disturbed areas. Three categories of habitats could be distinguished: fields, roadsides (both are disturbed habitats) and seem-ingly undisturbed habitats (denoted“natural” in Table 1). Seeds collected had sizes within the range expected for wild cowpea (10–46 mg with an average of 29 mg) with the exception of one plant from the population BUR05. This plant produced much larger seeds (115 mg); a small part of the testa was white-colored, which suggested that it was the progeny of a wild-domesticated hybrid.
In total, 5 to 37 individual plants were sampled per population. One to three pods per plant were collected and kept separately. Pods were collected from a single inflorescence peduncle or from two adjacent peduncles, in order to be sure that the pods were originating from the same plant. To reduce the probability of duplicate sampling, sampled individuals were separated by a mini-mum of 10 m. This precaution led in some instances to a low number of plants analyzed. Populations collected in cultivated fields, especially in Ghana, were often reduced to a very few wild plants remaining in the field after several weeding operations. Seeds were stored at -20oC until the laboratory analysis was carried out.
Four to twelve seeds per pod were analyzed with iso-zymes using horizontal starch gel electrophoresis, with a total of 3209 (2977 wild and 232 domesticated) seeds from 479 (421 wild and 58 domesticated) pods analyzed. Electrophoresis analysis
Ten enzyme systems revealing 21 putative loci were screened: aminopeptidase (AMP, E.C. 3.4.11.1), endopep-tidase (ENP, E.C. 3.4-.-), fluorescent esterase (FLE, E.C. 3.1.1.-), formate dehydrogenase (FDH, E.C. 1.2.1.2), iso-citrate dehydrogenase (IDH, E.C. 1.1.1.42), malate de-hydrogenase (MDH, E.C. 1.1.1.37), phosphoglucomutase (PGM, E.C. 5.4.2.2), phosphogluconate dehydrogenase (PGD, E.C. 1.1.1.43), phosphoglucose isomerase (PGI, E. C. 5.3.1.9), and shikimate dehydrogenase (SDH, E.C. 1.1.1.25). The targeted enzyme systems were expected to show polymorphism within West African var. spontanea [15]. In addition, they were known to be clearly expressed in seeds, either from the wild or from green-house, and no null allele has ever been recorded within V. unguiculata subsp. unguiculata with these enzyme systems.
Seeds were soaked in deionised water overnight to ini-tiate germination prior to enzyme expression. Once dehulled, seeds (germ and cotyledons) were crushed with distilled deionised water using a porcelain mortar and pestle. Enzyme extracts were adsorbed onto 3 mm
Whatman filter paper wicks and applied to a 14% starch gel [55]. All enzyme systems were assayed in citrate/his-tidine buffer system (pH 6.0) with the electrode buffer consisting of 0.41 M citric acid trisodium salt, pH 6.0 and gel buffer comprising 5 mM L-histidine mono HCl 2.5 mM NaCl, pH 6.0. Electrophoresis was carried out at 200 V at 4°C for about three hours. Enzyme-specific staining was carried out according to Wendel and Wee-den [56] using either leucine-b-naphtylamide or alanine-b-naphtylamide for AMP, and 4-methyl-umbelliferyl acetate for FLE.
For each enzyme system, we numbered as“1” the pre-sumed locus encoding the most anodally migrating bands; additional loci were numbered sequentially with decreasing electrophoretic mobility. The most common allele was designated by 100 for each locus and others were measured in millimetres of increased or decreased mobility in relation to this standard, using the same no-menclature as in Pasquet [15].
Data analysis
The genotype of each mother plant was first inferred from the progeny array following the Brown and Allard [57] method and using the MLTR computer program, version 2.2 [29]. The analysis of the mating system was carried out by comparing inferred mother plants geno-types to the genogeno-types of the progenies. Subsequent ana-lyses were based on the mother plant genotypes only. Mating system
First, the outcrossing rates t were estimated in the wild populations expressing three or more polymorphic loci using the MLTR computer program [29], an extension of the original program of Ritland and Jain [58] based on a mixture of outcrossing and self-fertilization events. This procedure estimates: (i) a multilocus outcrossing rate (tm); (ii) a single locus estimate of outcrossing rate (ts) averaged across loci;(iii) the crossing between rela-tives and the average maternal plant inbreeding coeffi-cient based on progeny genotypes [F = the (minimum variance) single locus inbreeding coefficient of maternal parents]. Standard errors of the mating system para-meters were estimated based on 500 bootstraps consid-ering the maternal family array as the resampling unit.
Fwas then compared to the expected inbreeding coef-ficient at equilibrium Fe = (1-t)/(1 + t) [59]. If populations are at a genetic equilibrium and genotypic frequencies are determined solely by the mating system, F and Fe are equal [60]. Discrepancies between F and Fe are expected to reflect the amount by which a population deviates from inbreeding equilibrium. Fe-F was tested for differ-ence from zero using a paired non-parametric Wilcoxon signed rank test. Moreover, any differences in (Fe – F) values according to the degree of disturbance in the
habitat of collection, i.e., natural vs. disturbed (i.e., road-side and field), were checked using a Mann – Withney Utest.
Lastly, in order to verify the contribution of biparental inbreeding versus autogamy to observed inbreeding, we compared tm-ts to zero using a Wilcoxon signed rank test. A tm-ts> 0 value means that biparental inbreeding does exist beside selfing of flowers. To test the hetero-geneity of tm among the populations analysed, a Chi-square test was carried out, as suggested by Godt and Hamrick [42]. The test was carried out by subtracting each population estimate from the global average, divid-ing these differences by the standard error associated with the outcrossing rate of each population, squaring these quantities, and summing over populations. Under the hypothesis of homogeneity, this statistic was assumed to be Chi-square distributed, with n – 1 degrees of freedom where n is the number of popula-tions. At the population level, diversity parameters were estimated using the Popgene software version 1.3 [61]. These included allele frequencies, percentage of poly-morphic loci (P), observed heterozygosity (Ho), and the expected heterozygosity under Hardy-Weinberg equilib-rium (He). Fixation indices were estimated with Fstat, version 1.2 [62]. Inbreeding coefficient (FIS) were
com-puted to assess the deviation from Hardy-Weinberg equilibrium following Weir and Cockerham [63] and were tested using a randomization test.
Genetic differentiation and spatial genetic structure
Genetic structure among populations was studied by analyzing both genetic differentiation and spatial gen-etic autocorrelation in the wild and domesticated populations.
First, an analysis of molecular variance (AMOVA) [64] was carried out to test the effects of the following hier-archical levels: country of origin, population. Because of the low number of populations sampled in domesticated cowpea, the full hierarchical analysis was performed only for wild populations. The AMOVA was performed with R software, libraries ape and pegas [65], using pairwise genetic distances following Smouse and Peakall [66]. These different components were tested by Monte-Carlo permutations (n = 999).
Second, spatial autocorrelation of the wild populations was analyzed using the GenAlEx 6.1 software program [67]. Genetic distances for each pairwise combination of populations were estimated according to Nei [68]. In the case of wild cowpea populations, the resulting matrix was used to compute the autocorrelation coefficient r [66]. r values were tested with 999 permutations. In the case of domesticated cowpea, represented by 7 popula-tions only, spatial autocorrelation was assessed with a
Mantel’s test (999 permutations) between Nei’s distances and geographic distances.
Relationship between wild and domesticated populations The possibility of genetic exchange between the wild and domesticated compartment were studied as follows. A Principal Coordinates Analysis (PCO) ([65], library ade4) was performed on Nei’s genetic distances.
Based on the algorithm published in Smouse and Pea-kall [66], the computation of the spatial autocorrelation coefficient rW-Dbetween wild (W) and domesticated (D)
populations was implemented in the R software [65] in order to deal with two paired asymmetrical matrices of distance Wild (rows) × Domesticated (columns). Such matrices reported spatial and genetic distances between couples of Wild – Domesticated (W-D) populations only. The spatial allelic autocorrelation coefficient (rW-D)
for Wild - Domesticated populations pairs was com-puted for several distance classes (100 km up to 500 km) and tested with 999 permutations.
Authors’ contributions
RSP, JBT, KT, RG, JTO and ABS contributed to plant material collection. EBK performed lab analyses. EBK, RSP and PC conceived of the study, analyzed data, interpreted results and wrote the paper. GMM and PG reviewed the paper prior to submission and provided valuable comments on the interpretation and presentation of results. RSP secured funding. All authors read and approved the final manuscript.
Acknowledgements
Eric Bertrand Kouam was supported by the German Academic Exchange Service (DAAD) and ICIPE ARPPIS training program. The study was funded by USAID (Grant 551-0138-01 via the International Institute of Tropical Agriculture) and BBI (Grant US Aid EEM-A-00-03-0001-00). Thanks to Mr. Seyni Seydou (warden of Parc du W, Niger) and Mr. Mahaman Saadou (University of Niamey, Niger) for information on the Torodi locality.
Author details
1
International Centre of Insect Physiology and Ecology, P.O box 30772, Nairobi, Kenya.2Department of Agriculture, Faculty of Agronomy and
Agricultural Sciences, University of Dschang, PO Box 222, Dschang, Cameroon.3IRD, Institut de Recherche pour le Développement, UR 072,
Laboratoire Evolution, Génomes et Spéciation, UPR 9034, Centre National de la Recherche Scientifique (CNRS), 91198 Gif sur Yvette Cedex, France.
4
Université Paris-Sud 11, 91405 Orsay Cedex, France.5CREAF de Kamboinse, INERA, BP 476, Ouagadougou 01, Burkina Faso.6Faculté des Sciences,
Département de Biologie, BP 243, Niamey, Niger.7UMR System 2, place Viala, 34060 Montpellier, France.8CSIR-SARI, PO Box 52, Tamale, Ghana.
9
Department of Biochemistry and Biotechnology, Kenyatta University, P.O Box 43844, Nairobi, Kenya.10Department of Plant Sciences/MS1, Section of
Crop and Ecosystem Sciences, University of California, 1 Shields Avenue, Davis, CA 95616-8780, USA.
Received: 5 December 2011 Accepted: 28 June 2012 Published: 24 July 2012
References
1. Ellstrand NC: Current knowledge of gene flow in plants: implications for transgene flow. Philos Trans R Soc B 2003, 358:1163–1170.
2. Frankham R: Balloo JD, Briscoe DA: Introduction to Conservation Genetics. Cambridge: University press; 2002.
3. Hajjar R, Hodgkin T: The use of wild relatives in crop improvement: a survey of developments over the last 20 years. Euphytica 2007, 156:1–13.
Kouam et al. BMC Plant Biology 2012, 12:113 Page 11 of 13
4. Heywood V, Casas A, Ford-Lloyd B, Kell S, Maxted N: Conservation and sustainable use of crop wild relatives. Agric Ecosyst Environ 2007, 121:245–255.
5. De Wet JMJ, Harlan JR: Weeds and domesticates: evolution in a man-made habitat. Econ Bot 1975, 29:99–107.
6. Harlan JR: Crops and man. Madison: American Society of Agronomy; 1975. 7. Doebley JF, Gaut BS, Smith BD: The molecular genetics of crop
domestication. Cell 2006, 127:1309–1321.
8. Burger JC, Chapman MA, Burke JM: Molecular insights into the evolution of crop plants. Am J Bot 2008, 95:113–122.
9. Darwin CR: The variation of animals and plants under domestication. London: John Murray; 1968.
10. Doggett H, Majisu BN: Disruptive selection in crop development. Heredity 1968, 23:1–23.
11. Walsh B: Using molecular markers for detecting domestication, improvement, and adaptation genes. Euphytica 2008, 161:1–17. 12. Pasquet RS, Baudoin JP: Cowpea. In Tropical plant breeding. Edited by
Charrier A, Jacquot M, Hamon S, Nicolas D. Enfield: Science publishers; 2001:177–198.
13. Pasquet RS: Allozyme diversity of cultivated cowpea Vigna unguiculata (L.) Walp. Theor Appl Genet 2000, 101:211–219.
14. Fang JG, Chao CCT, Roberts PA, Ehlers JD: Genetic diversity of cowpea [Vigna unguiculata (L.) Walp.] in four West African and USA breeding programs as determined by AFLP analysis. Genet Resour Crop Evol 2007, 54:1197–1209.
15. Pasquet RS: Genetic relationships among subspecies of Vigna unguiculata (L.) Walp. based on allozyme variation. Theor Appl Genet 1999,
98:1104–1119.
16. D’Andrea AC, Kahlheber S, Logan AL, Watson DJ: Early domesticated cowpea (Vigna unguiculata) from Central Ghana. Antiquity 2007, 81:686–698.
17. Kouadio D, Echikh N, Toussaint A, Pasquet RS, Baudoin JP: Organisation du pool génique de Vigna unguiculata (L.) Walp.: croisements entre les formes sauvages et cultivées du niébé. Biotechnol Agron Soc Environ 2007, 11:47–57.
18. Rawal KM: Natural hybridization among wild, weedy and cultivated Vigna unguiculata (L.) Walp. Euphytica 1975, 24:699–707.
19. Coulibaly S, Pasquet RS, Papa R, Gepts P: AFLP analysis of the phenetic organization and genetic diversity of Vigna unguiculata L. Walp. reveals extensive gene flow between wild and domesticated types. Theor Appl Genet 2000, 104:358–366.
20. Feleke Y, Pasquet RS, Gepts P: Development of PCR-based chloroplast DNA markers to assess gene flow between wild and domesticated cowpea (Vigna unguiculata). Plant Syst Evol 2006, 262:75–87. 21. Williams CB, Chambliss OL: Outcrossing in southernpea. HortSci 1980,
15:179.
22. Fatokun CA, Ng Q: Outcrossing in cowpea. J Food Agric Environ 2007, 5:334–338.
23. Asiwe JAN: Insect mediated outcrossing and geneflow in cowpea (Vigna unguiculata (L.) Walp): Implication for seed production and provision of containment structures for genetically transformed cowpea. Afr J Biotechnol 2009, 8:226–230.
24. Pasquet RS, Peltier A, Hufford MB, Oudin E, Saulnier J, Paul L, Knudsen JT, Herren HH, Gepts P: Long-distance pollen flow assessment through evaluation of pollinator foraging range suggests transgene escape distances. Proc Natl Acad Sci USA 2008, 105:13456–13461.
25. Lush WM: Floral morphology of wild and cultivated cowpeas. Econ Bot 1979, 33:442–447.
26. Harland SC: Inheritance of certain characters in the cowpea (Vigna sinensis). J Genet 1919, 8:101–132.
27. Steele WM: Cowpeas in Nigeria. PhD thesis. UK: University of Reading; 1972. 28. Higgins TJ, Popelka C, Ishiyaku M, Pasquet R, Mignouna J, Bokanga M,
Huesing J, Murdock L: Insect protected cowpeas-transgenics with Bt or alpha-amylase inhibitor genes. In Biotechnology, breeding and seed systems for African crops. Edited by van Houten H, Tom K, Tom-Wielgosz V. Nairobi: Rockefeller Foundation; 2007:78.
29. Ritland K: Extensions of models for the estimation of mating systems using n independent loci. Heredity 2002, 88:221–228.
30. Panella L, Gepts P: Genetic relationships within Vigna unguiculata (L.) Walps. based on isozyme analysis. Genet Resour Crop Evol 1992, 39:71–88. 31. Vaillancourt RE, Weeden NF, Barnard J: Isozyme diversity in the cowpea
species complex. Crop Sci 1993, 33:606–613.
32. Schemske DW, Lande R: The evolution of self fertilization and inbreeding depression in plants. II. Empirical observations. Evolution 1985, 39:41–52. 33. Ladeinde TAO, Bliss FA: Identification of the bud stage for pollinating
without emasculation in cowpea (Vigna unguiculata (L.) Walp.). Nigerian J Sci 1977, 11:183–194.
34. Bi IZ, Maquet A, Baudoin JP: Population genetic structure of wild Phaseolus lunatus (Fabaceae), with special reference to population sizes. Am J Bot 2003, 90:897–904.
35. Kiang YT, Chiang YC, Kaizuma N: Genetic diversity in natural populations of wild soybean in Iwate prefecture, Japan. J Hered 1992, 83:325–329. 36. Yu HG, Kiang YT: Genetic variation in south korean natural populations of
wild soybean (Glycine soja). Euphytica1993, 68:213–221.
37. Fujita R, Ohara M, Okazaki K, Shimamoto Y: The extent of natural cross-pollination in wild soybean (Glycine soja). Heredity 1997, 88:124–128. 38. Bi IZ, Maquet A, Baudoin JP: Mating system of wild Phaseolus lunatus L.
and its relationship to population size. Heredity 2005, 94:153–158. 39. Kuroda Y, Kaga A, Tomooka N, Vaughan DA: Population genetic structure
of Japanese wild soybean (Glycine soja) based on microsatellite variation. Mol Ecol 2006, 15:959–974.
40. Kuroda Y, Kaga A, Tomooka N, Vaughan DA: Gene flow and genetic structure of wild soybean (Glycine soja) in Japan. Crop Sci 2008, 48:1071–1079.
41. Levin DA, Kerster HW: Gene flow in seed plants. In Evolutionary biology. Volume 7. Edited by Dobzhansky T, Hecht MK, Steere WC. New York: Plenum Press; 1974:139–220.
42. Godt MJW, Hamrick JL: Estimates of outcrossing rates in Lathyrus latifolius populations. Genome 1991, 34:988–992.
43. Hamrick JL, Godt MJW: Allozyme diversity in plant species. In Plant population genetics, breeding and genetic resources. Edited by Brown AHD, Clegg MT, Kahler AL, Weir BS. Sunderland: Sinauer Associates Inc; 1990:43–63.
44. Hirao AS, Kameyama Y, Ohara M, Isagi Y, Kudo G: Seasonal changes in pollinator activity influence pollen dispersal and seed production of the alpine shrub Rhododendron aureum (Ericaceae). Mol Ecol 2006, 15:1165–1173.
45. Kudo G, Hirao AS, Kawai Y: Pollination efficiency of bumblebee queens and workers in the alpine shrub Rhododendron aureum. Int J Plant Sci 2011, 172:70–77.
46. Fery RL: The genetics of cowpea: a review of the world literature. In Cowpea. Edited by Singh SR, Rachie KO. Chichester: John Wiley & sons; 1985:25–62.
47. Langevin SA, Clay K, Grace JB: The incidence and effects of hybridization between cultivated rice and its related weed red rice. Evolution 1990, 44:1000–1008.
48. Blumler MA: Introgression of durum into wild emmer and the agricultural origin question. In The origins of agriculture and crop domestication. Edited by Damiana AB, Valkoun J, Willcox G, Qualset CO. Aleppo: ICARDA; 1998:252–268.
49. Linder CR, Taha I, Seiler GJ, Snow AA, Rieseberg LH: Long-term introgression of crop genes into wild sunflower populations. Theor Appl Genet 1998, 96:339–347.
50. Papa R, Gepts P: Asymmetry of gene flow and differential geographical structure of molecular diversity in wild and domesticated common bean (Phaseolus vulgaris L.) from Mesoamerica. Theor Appl Genet 2003, 106:239–250.
51. Papa R, Acosta J, Delgado-Salinas A, Gepts P: A genome-wide analysis of differentiation between wild and domesticated Phaseolus vulgaris from Mesoamerica. Theor Appl Genet 2005, 111:1147–1158.
52. Zizumbo-Villarreal D, Colunga-Garcia Marin P, Payro de la Cruz E, Delgado-Valerio P, Gepts P: Population structure and evolutionary dynamics of wild-weedy-domesticated complexes of common bean in a Mesoamerican region. Crop Sci 2005, 45:1073–1083.
53. Snow AA, Andow DA, Gepts P, Hallerman EM, Power A, Tiedje JM, Wolfenbarger LL: Genetically engineered organisms and the
environment: Current status and recommendations. Ecol Appl 2005, 15:377–404.
54. Chapman MA, Burke JM: Letting the gene out of the bottle: the population genetics of genetically modified crops. New Phytol 2006, 170:429–443.
55. Second G, Trouslot P: Electrophorèse d'enzymes de riz (Oryza sp.). Travaux et Documents de l'ORSTOM 120. Paris: ORSTOM; 1980.
56. Wendel JF, Weeden NF: Visualization and interpretation of plant isozymes. In Isozymes in plant biology. Edited by Soltis DE, Soltis PS. London: Chapman and Hall; 1989:5–45.
57. Brown AHD, Allard RW: Estimation of the mating system in open-pollinated maize populations using isozyme polymorphism. Genetics 1970, 66:133–145.
58. Ritland K, Jain S: A model for the estimation of outcrossing rate and gene frequencies using independant loci. Heredity 1981, 47:35–52.
59. Fyfe JL, Bailey NTJ: Plant breeding studies in leguminous forage crops. I. Natural outcrossing in winter beans. J Agric Sci 1951, 41:371–378. 60. Brown AHD: Enzyme polymorphism in plant populations. Theor Popul Biol
1979, 15:1–42.
61. Quadokus E: Modeling population genetics. Science 2000, 288:458. 62. Goudet J: FSTAT V-1.2. A computer program to calculate F-statistics.
J Hered 1995, 86:485–486.
63. Weir BS, Cockerham CC: Estimating F-statistics for the analysis of population structure. Evolution 1984, 38:1358–1370.
64. Excoffier L, Smouse PE, Quattro JM: Analysis of molecular variance inferred from metric distances among DNA haplotypes: application to human mitochondrial DNA restriction data. Genetics 1992, 131:479–491. 65. R Development Core Team: R: A language and environment for statistical
computing. Vienna: R Foundation for Statistical Computing; 2009. http://www.R-project.org. ISBN ISBN 3-900051-07-0.
66. Smouse PE, Peakall R: Spatial autocorrelation analysis of individual multiallele and multilocus genetic structure. Heredity 1999, 82:561–573. 67. Peakall R, Smouse PE: Genalex 6: Genetic analysis in excel. Population
genetic software for teaching and research. Mol Ecol Notes 2006, 6:288–295.
68. Nei M: Genetic distance between populations. Am Nat 1972, 106:283–292.
doi:10.1186/1471-2229-12-113
Cite this article as: Kouam et al.: Genetic structure and mating system of wild cowpea populations in West Africa. BMC Plant Biology 2012 12:113.
Submit your next manuscript to BioMed Central and take full advantage of:
• Convenient online submission
• Thorough peer review
• No space constraints or color figure charges
• Immediate publication on acceptance
• Inclusion in PubMed, CAS, Scopus and Google Scholar
• Research which is freely available for redistribution
Submit your manuscript at www.biomedcentral.com/submit
Kouam et al. BMC Plant Biology 2012, 12:113 Page 13 of 13