Subcutaneous Adipose Tissue Remodeling during the
Initial Phase of Weight Gain Induced by Overfeeding
in Humans
M. Alligier, E. Meugnier, C. Debard, S. Lambert-Porcheron, E. Chanseaume, M. Sothier, E. Loizon, A. Ait Hssain, J. Brozek, J.-Y. Scoazec, B. Morio, H. Vidal,* and M. Laville*
Institut National de la Sante´ et de la Recherche Me´dicale Unit 1060 (M.A., E.M., C.D., E.L., H.V., M.L.), CarMeN Laboratory and Centre Europe´en Nutrition Sante´, Lyon 1 University, F-69600 Oullins, France; Centre de Recherche en Nutrition Humaine (CRNH) Rhone-Alpes (M.A., S.L.-P., M.S., H.V., M.L.), Centre Hospitalier Lyon-Sud, F-69310 Pierre Be´nite, France; Institut National de la Recherche Agronomique (INRA) Unit 1235 (E.M., H.V.), F-69600 Oullins, France; INRA (E.C., B.M.), Unite´ Mixte de Recherche 1019 Nutrition Humaine, CRNH Auvergne, Universite´ Clermont, F-63000 Clermont-Ferrand, France; Service de Re´animation Me´dicale (A.A.H.), Hoˆpital Gabriel Montpied, F-63000 Clermont-Ferrand, France; Genfit (J.B.), F-59120 Loos, France; and Hospices Civils de Lyon (J.-Y.S.), Service
d’Anatomopathologie, F-69008 Lyon, France
Context: Deciphering the early processes occurring in adipose tissue during weight gain is a major issue for understanding the development of fat mass and obesity. Experimental overfeeding in humans is a unique situation to tackle these events.
Objective: Our aim was to identify the pathways involved in sc adipose tissue remodeling during the initial phase of weight gain.
Research Design and Methods: Forty-four healthy men were involved in an overfeeding protocol with a lipid-enriched diet (⫹760 kcal/d) for 2 months. Subcutaneous abdominal adipose tissue biopsies were taken for histology, transcriptomics, and Western blotting in the basal state, after 14 d, and at the end of the protocol.
Results: Overfeeding significantly increased body weight (⫹2.5 kg) and fat mass. Reorganization of gene expression patterns occurred in adipose tissue with an up-regulation of numerous genes involved in lipid metabolism and storage, followed by clusters of genes related to angiogenesis and extracellular matrix remodeling. Histological examination showed increased microvascular density and connective tissue deposition after 56 d of overfeeding, with no changes in the number of macrophages or inflammatory cells. Inhibition of the canonical Wnt/-catenin signaling pathway and induction of the renin-angiotensin system might be implicated in the remodeling of sc adipose tissue.
Conclusions: We characterize the coordinated and time-dependent processes that occur in human adipose tissue during the early phase of weight gain in healthy subjects and identify pathways representing potential targets in pathologies of adipose development, including obesity. (J Clin Endocrinol Metab 97: E183–E192, 2012)
ISSN Print 0021-972X ISSN Online 1945-7197 Printed in U.S.A.
Copyright © 2012 by The Endocrine Society
doi: 10.1210/jc.2011-2314 Received August 16, 2011. Accepted November 10, 2011. First Published Online December 7, 2011
For editorial see page 377
* H.V. and M.L. contributed equally to the study.
Abbreviations: D0, Beginning of study, or day zero; D14, day 14 of study; D56, end of study or day 56; DGAT2, diacylglycerol-O-acyltransferase 2; GSK, glycogen synthase kinase; NEFA, nonesterified fatty acid; qPCR, quantitative PCR.
H o t T o p i c s i n T r a n s l a t i o n a l E n d o c r i n o l o g y — E n d o c r i n e R e s e a r c h
J Clin Endocrinol Metab, February 2012, 97(2):E183–E192 jcem.endojournals.org E183
O
besity, characterized by excessive accumulation of adipose tissue, is mainly caused by a chronic im-balance between energy intake and energy expenditure. Major modifications of adipose tissue in obesity, includ-ing macrophage infiltration, inflammation, and fibrosis (1– 4), have been associated with complications such as type 2 diabetes and cardiovascular diseases (2, 5). Weight loss is generally associated with improvement of these de-regulations (4, 6, 7). Up to now, it is unclear whether these alterations occurred early in the process of fat mass de-velopment or are late events, associated with excessive accumulation of adipose tissue.Experimental overfeeding in humans is a unique situ-ation to characterize the early events occurring in adipose tissue during weight gain. Recently, it was demonstrated that weight gain induced by a daily excess of 1250 kcal for 28 d occurs without modification of inflammation in ad-ipose tissue (8). In another overfeeding experiment, Franck et al. (9) reported that doubling the caloric intake for 4 wk resulted in the regulation of a number of meta-bolic genes in sc adipose tissue, some of them being already affected after 7 d of overfeeding (10).
Our objective was to further characterize the molecular changes that take place in sc adipose tissue during the early adaptive response to weight gain. To this aim, 44 healthy men were involved in a 2-month overfeeding protocol. Subcutaneous abdominal adipose tissue biopsies were per-formed in the basal state, after 2 wk, and at the end of overfeeding for histology and molecular analyses. Our
re-sults highlighted crucial steps during the early phase of weight gain, such as inhibition of Wnt signaling pathway, induction of the renin-angiotensin system, and remodeling of periadipocyte environment with reorganization of ex-tracellular matrix and microvascular network.
Subjects and Methods
Subjects
Forty-four healthy males were recruited. All were in good health without family history of diabetes and with a stable weight during at least the last 3 months. They were nonsmokers, with ages ranging from 18 to 55 yr and body mass index from 18 to 30 kg/m2
. Their characteristics are shown in Table 1. All subjects gave written consent after being informed of the nature, purpose, and possible risks of the protocol. The protocol was approved by the ethics committee of Lyon Sud-Est according to the French “Huriet-Serusclat” law and the Second Declaration of Helsinki.
Overfeeding protocol
The subjects were submitted to 56 d of overfeeding during which they were required to add an excess of 760 kcal/d (3180 kJ/d) to their usual diet. The overfeeding protocol has been de-scribed previously (11). Briefly, subjects added to their usual diet 100 g of cheese, 20 g of butter, and 40 g of almonds (unsalted), representing about 70 g of lipids mainly composed of saturated (46.3%) and monounsaturated (44.7%) fatty acids. The subjects were also asked to maintain their lifestyle, their regular level of physical activity, and their usual eating behavior. They com-pleted 5-d dietary records before the study and twice during the overfeeding period (d 9 –13 and d 51–55). Physical activity was
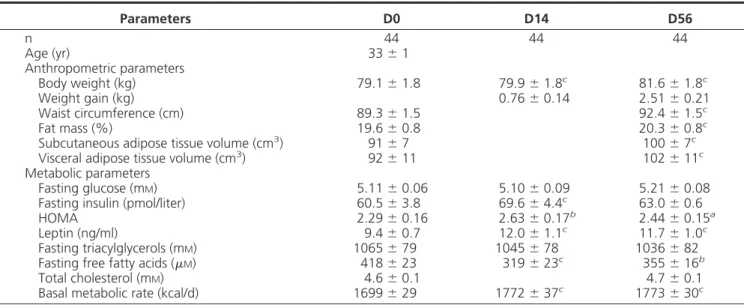
TABLE 1. Anthropometric and metabolic parameters of 44 subjects at baseline and after 14 and 56 d of overfeeding Parameters D0 D14 D56 n 44 44 44 Age (yr) 33⫾ 1 Anthropometric parameters Body weight (kg) 79.1⫾ 1.8 79.9⫾ 1.8c 81.6⫾ 1.8c Weight gain (kg) 0.76⫾ 0.14 2.51⫾ 0.21 Waist circumference (cm) 89.3⫾ 1.5 92.4⫾ 1.5c Fat mass (%) 19.6⫾ 0.8 20.3⫾ 0.8c
Subcutaneous adipose tissue volume (cm3) 91⫾ 7 100⫾ 7c
Visceral adipose tissue volume (cm3) 92⫾ 11 102⫾ 11c
Metabolic parameters
Fasting glucose (mM) 5.11⫾ 0.06 5.10⫾ 0.09 5.21⫾ 0.08 Fasting insulin (pmol/liter) 60.5⫾ 3.8 69.6⫾ 4.4c 63.0⫾ 0.6
HOMA 2.29⫾ 0.16 2.63⫾ 0.17b 2.44⫾ 0.15a
Leptin (ng/ml) 9.4⫾ 0.7 12.0⫾ 1.1c 11.7⫾ 1.0c
Fasting triacylglycerols (mM) 1065⫾ 79 1045⫾ 78 1036⫾ 82 Fasting free fatty acids (M) 418⫾ 23 319⫾ 23c 355⫾ 16b
Total cholesterol (mM) 4.6⫾ 0.1 4.7⫾ 0.1 Basal metabolic rate (kcal/d) 1699⫾ 29 1772⫾ 37c 1773⫾ 30c
Data are expressed as mean⫾SEM. HOMA, Homeostasis model of assessment.
aP⬍ 0.05. b
P⬍ 0.01.
cP⬍ 0.001.
also monitored during these 5-d periods using RT3 accelerom-eters. Metabolic explorations were performed before the study [day 0 (D0)], after 14 d (D14), and at the end of the study (D56).
Metabolic explorations
After an overnight fast, subjects came to the Research Cen-ters. Weight, height, and waist circumference were carefully re-corded. Fasting blood samples were drawn for analysis of hor-mones and plasma metabolites. Basal metabolic rate was assessed by indirect calorimetry (Deltatrac Datex, Helsinki, Fin-land) (12). A needle biopsy of abdominal sc adipose tissue was performed about 10 –15 cm from the umbilicus, under local an-esthesia (1% lidocaine) (13). Subsequent biopsies were taken contralaterally and never at the same site. Fat samples were im-mediately frozen in liquid nitrogen and stored at⫺70 C. At D0 and D56, body composition was determined by dual-energy x-ray absorptiometry (Hologic, Inc., Bedford, MA) and abdominal adipose tissue distribution (sc and visceral fat regions) by mag-netic resonance imaging (Magnetom Symphonie 1.5 Tesla; Sie-mens AG, Munich, Germany) using single-slice image at L2–L3 disk level.
Laboratory analyses
Glycemia was measured using the hexokinase method (Roche Diagnostics, Meylan, France). Insulinemia (IRMA kit; IRE-Medgenix, Fleurus, Belgium) and serum leptin (Quantikine leptin, R&D Systems, Minneapolis, MN) were measured. Total cholesterol, triglycerides, and nonesterified fatty acids (NEFA) were determined by enzymatic methods (NEFA C kit, Wako Parel Chemicals, Neuss, Germany).
Adipose tissue analyses
Because the size of fat biopsies (ranging from 100 to 450 mg) was not sufficient to perform the analyses in all the samples, immunohistology was done in samples from 15 subjects, mi-croarrays from 13 subjects, and protein extraction for Western blots from eight subjects. In addition, samples from 24 subjects were available for gene expression measurement by real-time RT-PCR. The different subgroups were matched according to body composition and metabolic parameters at D0 and to their weight gain and responses to the diet (Supplemental Table 1, published on The Endocrine Society’s Journals Online web site at http://jcem.endojournals.org). They did not differ from the whole studied population.
Histology and immunohistochemistry
Samples from 15 subjects were fixed in buffered formalin, em-bedded in paraffin, and processed according to standard histolog-ical techniques. For histologhistolog-ical and morphometric analyses, 4-m-thick sections were prepared and stained with hematoxylin-eosin-saffron. Estimation of adipocyte cell number per surface unit and adipocyte size was done using HISTOLAB package soft-ware (Microvision Instruments, Evry, France). Trichrome stain was used to evaluate the presence and extent of connective tissue. For immunohistochemistry, CD34 antibody (clone QBEnd10; Dako, Glostrup, Denmark) was used to visualize endothelial cells, and antibodies to CD3 (clone UCHT1; Dako), CD20 (clone B-Ly1; Dako) and CD68 (clone KP1; Dako) were used as T and B lymphocyte and macrophage markers, respectively.
For evaluation of microvascular density, the number of spots with CD34-positive signal was counted by two observers in 10
consecutive fields of 0.2 mm2
. These spots likely corresponded to endothelial cells in small capillaries or microvessels.
Microarrays
RNA profiling in adipose tissue was performed using Af-fymetrix Human HG U133 Plus 2.0 arrays, covering 47,401 transcripts. Total RNA was isolated using mirVana miRNA Iso-lation Kit (Ambion, Life Technologies, Saint Aubin, France) and was further purified using the RNeasy kit (QIAGEN, Courta-boeuf, France). One hundred nanograms of total RNA were sub-mitted to the GeneChip3⬘ IVT Express Kit (Affymetrix, Inc., Santa Clara, CA) for sample processing and chip hybridization according to the manufacturer’s instructions. Chips were scanned with GeneChip Scanner 3000 7G (Affymetrix, Inc.).
Expression values and absent/present calls were calculated using MAS 5.0 and Robust Multi-array Analysis expression summary algorithms (14), implemented in R (version 2.9.2) within the Affy package (15). Data were filtered on detection calls so that probe sets considered “absent” across all subjects and all time points were removed. Statistical analysis was per-formed on 39,021 probe sets with Limma package (16). Limma makes use of moderated t-statistics, which provides for greater power at small sample sizes. Probe sets with a P value⬍0.05 and a fold change⬎ 1.25 at D14 and D56 were considered as dif-ferentially expressed with respect to D0. The dataset is available from the Gene Expression Omnibus database (GSE28005).
Biological functions and pathways regulated during overfeed-ing were identified usoverfeed-ing DAVID (Database for Annotations, Visualization and Integrated Discovery) (17). Because a number of regulated genes were not annotated in the database, we com-pleted this computational analysis using PubMed, OMIM, and SOURCE.
Real-time PCR
First-strand cDNA were synthesized from 250 ng total RNA in the presence of 100 U Superscript II (Life Technologies) and a mixture of random hexamers and oligo(dT) primers (Promega, Charbonnie`res-les-Bains, France). Real-time PCR assays were performed as previously described (18), using a Rotor-Gene 6000 (QIAGEN). Values were normalized using hypoxanthine guanine phosphoribosyl transferase. The RT-PCR primer se-quences are listed in Supplemental Table 2.
Western blots
Fat samples were lysed in buffer containing 1% Nonidet P-40, 0.5% sodium deoxycholate, 0.1% sodium dodecyl sulfate, 1X protease inhibitor cocktail, 1 mmol/liter Na3VO4, and 1%
Triton X-100. Proteins were quantified by the Bradford assay (Bio-Rad, Marnes La Coquette, France). Proteins (50g) were separated by SDS/10% PAGE and transferred to polyvinylidene difluoride membrane. Membranes were incubated overnight at 4 C with specific primary antibodies including, anti-diacylglyc-erol-O-acyltransferase 2 (DGAT2) (Sigma no. HPA013351), glycogen synthase kinase (GSK)3 (Ozyme no. 9315), anti-phospho-Ser9 GSK3 (Ozyme no. 9336), and anti--catenin (Ozyme no. 9582). The signal was detected using a horseradish peroxidase-conjugated secondary antibody and revealed with the enhanced chemiluminescence system (Thermo Fisher Scien-tific, Illkirch, France). Signal was quantified with NIH ImageJ software.
Statistics and data presentation
All data are presented as mean⫾SEMunless otherwise stated.
Comparisons between time-points (D0, D14, and D56) were performed using the paired t test and nonparametric test (Wil-coxon) when necessary. Pⱕ 0.05 was considered significant. All metabolic and anthropometric parameters showed in the man-uscript were normally distributed.
Results
Overfeeding
The volunteers were asked to consume a supplement of about 760 kcal/d, mostly as fat (70 g), in addition to their regular diet. Based on the dietary records, we estimated that the increase in energy intake was actually about 700 kcal/d, with a significant rise in lipid intake (⫹26%; P ⬍ 0.001) (Supplemental Table 3). The proportion of satu-rated fatty acids markedly increased, as expected. Physical activity measured using RT3 accelerometers did not show significant change (data not shown).
Table 1 summarizes the anthropometric and metabolic characteristics of the subjects at baseline, D14, and D56. As expected, the subjects experienced a moderate rise in body weight (⫹2.5 kg) and whole body fat mass, associ-ated with an increase in waist circumference. Using mag-netic resonance imaging, we evidenced a significant
in-crease in abdominal adipose tissue volume, both for the sc and the visceral fat depots. Leptin concentration in-creased after 14 d and until the end of protocol. The insulin resistance index homeostasis model of assessment sig-nificantly increased both at D14 and D56 due to an increase in insulinemia and/or glycemia (Table 1). Fasting NEFA concentrations were markedly decreased during overfeeding (Table 1), suggesting inhibition of adipose tissue lipolysis.
Histology of sc abdominal adipose
The overall structure of the tissue showed no marked change during over-feeding. We did not detect significant changes in either mean adipocyte cell surface (3123 ⫾ 129 m2 at D0,
2971⫾ 257m2at D14, and 3120⫾ 160m2at D56) or adipocyte number
(320⫾ 16 cells/mm2at D0, 339⫾ 35 at D14, and 336⫾ 28 at D56). No inflam-matory infiltrate was visible, and no significant change in the density of CD3⫹ and CD20⫹ cells was detected (6.3 ⫾ 0.3 vs. 6.4 ⫾ 0.4, and 4.1 ⫾ 0.5 vs. 3.8 ⫾ 0.4 cells/mm2, respectively). There was also no significant in-crease in the amount of CD68⫹ macrophages (12.6 ⫾ 1.4 vs. 14.3⫾ 1.2 cells/mm2). In contrast, there was a signif-icant increase in the density of capillary vessels labeled by CD34 antibody, as illustrated in Fig. 1. The microvascular density per mm2was 21.2⫾ 9.7 at D0 and 32.1 ⫾ 14.9 at
D56 (P⬍ 0.01). In addition, trichrome stain highlighted an increased number of intercellular matrix deposits be-tween adipocytes and a marked increase in the thickness of the perivascular connective sheaths associated with cap-illary vessels and small arterioles (Fig. 1).
Changes in adipose tissue gene expression
Using Affymetrix chips, we determined the changes in gene expression induced by overfeeding. After 14 d, 269 probes corresponding to 180 different genes displayed sig-nificant changes (Supplemental Table 4A). This list of reg-ulated genes reached 654 probes (487 unique genes) after 56 d of overfeeding (Supplemental Table 4B). Half of the genes found at D14 (89 genes) were also regulated at D56. Using DAVID, we found that among the most signifi-cantly enriched pathways at D14, the majority (13 of 19) were directly related to lipid metabolism, especially fatty acid and lipid biosynthesis, arguing for an increased lipid FIG. 1. Increased microvascular density and matrix deposition in human sc adipose tissue
after 56 d of overfeeding. Paraffin-embedded sections prepared from abdominal sc adipose tissue samples obtained before (D0) and at the end (D56) of the overfeeding protocol were used. Top panels, CD34 immunodetection shows the increased microvascular density observed at D56, compared with D0. Bottom panels, At D56, trichrome stain shows increased extracellular matrix deposits between adipocytes (arrowheads) and thick perivascular connective sheaths (arrows).
storage capacity in adipose tissue (Supplemental Table 5A). The pathway distribution was different at D56 (Sup-plemental Table 5B). Although lipid metabolism annota-tions were still present, annotaannota-tions related to extracellu-lar matrix, collagens, and cell adhesion were the most
represented, together with blood vessel development and morphogenesis. Moreover, we found a significant enrich-ment in genes encoding members of the renin-angiotensin system. To validate the Affymetrix data, changes in the expression of several genes from these different path-ways were verified by real-time PCR in adipose tissue samples from a larger group of 24 subjects (Table 2). We globally found very similar responses with the two methods, supporting the re-liability of the DNA chips data.
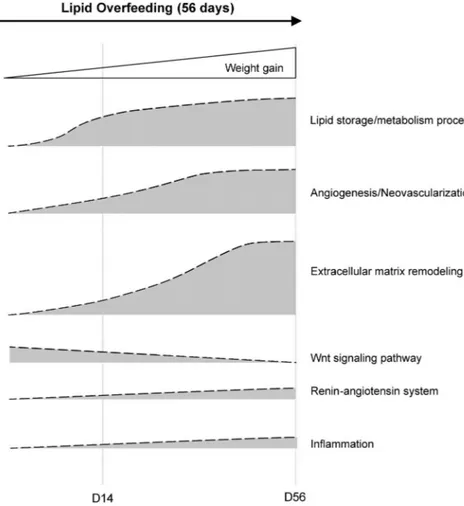
This analysis was further completed by a manual classification of the regu-lated genes using additional databases. In addition to the pathways initially re-trieved using DAVID, we proposed a cluster of 12 genes known to be asso-ciated with the regulation of the Wnt signaling pathways and a group of 19 FIG. 2. Evolution of the gene expression pattern in human sc adipose tissue during overfeeding. Bars
represent the number of genes related to a given function or biological pathway after 14 d (D14, dark
bars) and 56 d (D56, white bars) of overfeeding. Genes found commonly regulated at D14 and D56
are indicated in gray. The genes are listed in Supplemental Table 6.
TABLE 2. Validation of microarray results by RT-qPCR in adipose tissue samples from 24 subjects
Gene name
Gene symbol
Entrez gene
Fold change microarray Fold change RT-qPCR
D14 D56 D14 D56
Lipid metabolism
Acetoacetyl-CoA synthetase AACS 65985 1.4⫾ 0.1a 1.6⫾ 0.3a 1.7⫾ 0.2a 2.5⫾ 0.4a
ATP citrate lyase ACLY 47 1.8⫾ 0.3a 2.2⫾ 0.7a 1.8⫾ 0.3a 2.6⫾ 0.4a
Cholesteryl ester transfer protein, plasma CETP 1071 1.3⫾ 0.2 3.2⫾ 0.7a 1.7⫾ 0.3a 2.7⫾ 0.6a Diacylglycerol O-acyltransferase homolog 2 (mouse) DGAT2 84649 2.0⫾ 0.4a 1.7⫾ 0.2a 2.8⫾ 0.6a 1.9⫾ 0.2a Lipin 1 LPIN1 23175 1.4⫾ 0.2a 1.1⫾ 0.1 1.5⫾ 0.4 1.4⫾ 0.1a Stearoyl-CoA desaturase (␦-9-desaturase) SCD 6319 1.2⫾ 0.1 2.4⫾ 0.7a 2.0⫾ 0.4a 2.5⫾ 0.3a
Solute carrier family 2 member 5 SLC2A5 6518 2.2⫾ 0.5a 4.0⫾ 1.9a 1.2⫾ 0.4 2.4⫾ 0.3a
Sterol regulatory element binding transcription factor 1
SREBF1 6720 1.5⫾ 0.2a 1.4⫾ 0.1a 2.0⫾ 0.4a 1.7⫾ 0.2a
Very low density lipoprotein receptor VLDLR 7436 1.4⫾ 0.2a 1.2⫾ 0.1 1.6⫾ 0.3a 1.5⫾ 0.2a Cell death-inducing DFFA-like effector a CIDEA 1149 0.9⫾ 0.3 0.8⫾ 0.1a 0.8⫾ 0.1 0.8⫾ 0.1a Extracellular matrix
Collagen, type VI,␣ 3 COL6A3 1293 1.0⫾ 0.1 1.3⫾ 0.1a 1.0⫾ 0.1 1.3⫾ 0.1a
Angiogenesis
Apelin receptor APLNR 187 1.0⫾ 0.1 1.3⫾ 0.1a 0.9⫾ 0.1 1.4⫾ 0.1a
Angiopoietin-like 4 ANGPTL4 51129 0.9⫾ 0.1 0.8⫾ 0.1a 0.9⫾ 0.2 0.9⫾ 0.1
Endothelin 1 EDN1 1906 0.8⫾ 0.1a 1.0⫾ 0.1 0.7⫾ 0.1a 1.4⫾ 0.2a
Renin-angiotensin system
Angiotensin I converting enzyme 1 ACE 1636 1.2⫾ 0.1 1.5⫾ 0.6a 1.2⫾ 0.1 1.4⫾ 0.1a
Angiotensinogen AGT 183 1.5⫾ 0.2a 1.4⫾ 0.1a 2.5⫾ 0.5a 2.2⫾ 0.3a Glutamyl aminopeptidase (aminopeptidase A) ENPEP 2028 1.1⫾ 0.1 1.5⫾ 0.1a 1.2⫾ 0.2 1.7⫾ 0.2a Membrane metallo-endopeptidase MME 4311 1.4⫾ 0.1a 1.4⫾ 0.1a 1.4⫾ 0.2a 1.5⫾ 0.2a
Data are expressed as mean⫾SE.
aSignificant change at D14 or D56 vs. D0 (P value⬍0.05 with paired t test for qPCR; P value ⬍ 0.05 with Limma for microarray).
genes coding proteins related to inflammation and im-mune response (Supplemental Table 6). Figure 2, repre-senting these different gene clusters and their evolution during overfeeding, clearly shows that genes related to lipid metabolism and lipid synthesis were first induced at D14, whereas genes involved in angiogenesis appeared later, concomitantly with the induction of genes coding components of the extracellular matrix.
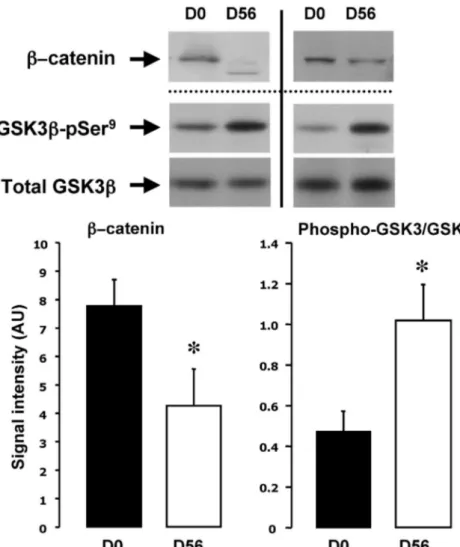
The expression pattern of the genes related to Wnt/ -catenin signaling suggested a global inhibition of this path-way during overfeeding. Indeed, the expression of both the Wnt inhibitors SFRP2 and FRZB/SFRP3 and the Wnt/ -catenin antagonists DKK3 and Dact-1 was increased. In-hibition of the canonical Wnt pathway relies on the deg-radation of-catenin in response to phosphorylation by active GSK3. To verify whether the changes in the expres-sion of the Wnt modulators were associated with an ac-tivation of GSK3 and degradation of -catenin, Western blot analyses were performed at D0 and D56. Figure 3 demonstrates that the amount of -catenin was
signifi-cantly reduced after 56 d of overfeed-ing, concomitantly with increased ser-ine 9 phosphorylation of GSK3.
Discussion
Our data reveal the kinetics of the early modifications in sc adipose tissue dur-ing the initial step of weight gain in healthy individuals. We highlight some important targets for adipose tissue plasticity including the inhibition of Wnt signaling pathway, the role of the renin-angiotensin system, and the im-portance of angiogenesis and extracel-lular matrix remodeling. These pro-cesses intertwined with each other to allow proper adipose tissue develop-ment during overfeeding.
After 14 d of overfeeding, a number of genes related to lipid metabolism were induced, such as those encoding enzymes of fatty acid conversion into triglycerides, like acylCoA synthetase (ACSL), several elongases (ELVOL2, 3 and 6) and desaturases (FADS1 and 2) and DGAT2. Expression of genes in-volved in lipogenesis, lipid droplet de-position, and adipocyte maturation (FASN, ACLY, ACAC␣, HKII and PNPLA3) was also increased, as well as the expression of the transcription fac-tor SREBF1, known to be a major inducfac-tor of most of these lipogenic-related genes (19). Altogether, and in agreement with preceding works (9, 10), this concerted regulation of gene expression suggests a rapid orientation of metabolism toward storage of lipid during the first days of overfeeding. This was sustained all along the dietary intervention, with an up-regulation of most of these genes until the end of the overfeeding period. Confirming the gene expression data, we found a significant increase in DGAT2 protein levels in sc adipose tissue at the end of the overfeeding (Supplemental Fig. 1).
Despite induction of lipid storage and fat mass increase, we were unable to detect significant change of size and number of adipocytes after 56 d of overfeeding. Because weight gain was moderated, it cannot be excluded that tiny local modifications could not be detectable using his-tological methods. However, these results are in agree-ment with previous observations reporting a lack of adi-pocyte size change after 28 d of lipid overfeeding (8, 20). FIG. 3. Inhibition of the Wnt/-catenin pathway in human sc adipose tissue during
overfeeding. Protein expression of-catenin, GSK3–pSer9, and total GSK3 was analyzed by Western blotting. Representative experiments of two subjects are shown, and the figure represents the mean⫾SEobtained with eight different subjects. *, P⬍ 0.05 vs. D0.
Furthermore, the expression of key genes of adipogenesis and adipocyte differentiation, such as PPAR␥ and C/EBP␣ (21), was not modified as assessed by either microarray or specific RT-quantitative PCR (RT-qPCR) assay (data not shown). Altogether, these data are consistent with the psiding view that abdominal sc adipocyte number may re-main constant in adulthood during weight gain (22, 23). In parallel to lipid metabolism, we observed a higher capillary density in sc adipose tissue after 56 d of over-feeding, in line with the well-described importance of the neovascularization process in the development of adipose tissue (24). At the gene expression level, several factors involved in the different steps of the angiogenic process were up-regulated, including angiopoietin 2 (ANGPT2) (25), ephrin receptors A3 and A4 (26), HEYL (27), HEY2 (28), vasohibin-2 (VASH2) (29), and RRM2 (30). More-over, we found a reduction of the expression of the antian-giogenic factor THBS1. Recently, a critical role of the apelin/ apelin receptor signaling pathway was demonstrated in the development of the functional vascular network in adipose
tissue (31). The induction of apelin receptor expression sug-gested also a possible contribution of this pathway in adipose tissue neovascularization during physiological weight gain. Extracellular matrix proteins are major components of adipose tissue (1). In agreement with histology staining showing increased matrix deposits after overfeeding, more than 60 genes encoding proteins of extracellular ma-trix and cell adhesion displayed expression changes. Some of them have been previously identified in a recent over-feeding study (9). The list includes a number of structural proteins represented by different types of collagens, ad-hesion proteins, and proteoglycans and by a number of protein processing enzymes critical for extracellular ma-trix turnover (such as metalloproteinases 2, 9, and 15). This concerted regulation suggests that extracellular matrix remodeling is likely an important process during weight gain, as also supported by recent data demonstrating the implica-tion of COL6A3 in adipose tissue expansion (32, 33).
It has been shown in vitro and in rodents that the Wnt pathway is a master regulator of adipose tissue development, particularly of preadipocyte recruitment (34, 35) and also of angiogenesis (36). The canonical Wnt pathway appeared to be inhibited during overfeeding. There was a concerted induction of several in-hibitors of the canonical Wnt pathway (SFRP2, FRZB/SFRP3, DKK3 and Dact-1). For example, Dact-1, the expression of which is increased by feeding and in obesity in rodents, can promote adipo-genesis through a mechanism involving -catenin phosphorylation and degra-dation (37). In agreement with the in-duction of these inhibitors of the Wnt pathway, we found a significant decrease of -catenin protein level, concomi-tantly with a stimulation of GSK3 phosphorylation. In parallel to the in-hibition of-catenin, an activation of the noncanonical Wnt pathway by Wnt5a, which was induced during over-feeding, may potentially contribute to adi-pose tissue reorganization (38). Although thismustbefurtherdemonstrated,ourdata strongly suggest that the control of the Wnt pathwaysisimportantduringtheearlystep of adipose tissue expansion in vivo, thus transposing to humans this recent para-digm established in vitro and in animal models (34, 35).
The renin-angiotensin system was another pathway deeply modulated during overfeeding. It has been shown FIG. 4. Coordinated biological processes in sc adipose tissue during early phase of weight
gain induced by 56 d of lipid overfeeding. Increased lipid metabolism and triglyceride deposition in adipocytes in response to overfeeding are concomitant with a marked inhibition of the canonical Wnt/-catenin signaling pathway and the induction of the renin-angiotensin system, which are likely to contribute to preadipocyte recruitment, coordinated with a major reorganization of periadipocyte environment with neovascularization and extracellular matrix remodeling.
that angiotensin II promotes preadipocyte recruitment and differentiation (39). We found that overfeeding is as-sociated with a concerted induction of the expression of a number of components of the system, including the dif-ferent proteases that specifically produce the angiotensin-related peptides, such as ACE, MME, CMA1, CTSG and ENPEP. This coordinated regulation strongly suggests an increase of angiotensin activity in human adipose tissue during weight gain.
Weight loss provoked by a low-calorie diet is charac-terized by marked regulation of gene expression in adipose tissue of obese individuals, generally associated with im-provements of the main alterations, including inflamma-tion and fibrosis (4, 7). Capel et al. (40) reported 592 regulated genes in abdominal sc fat of obese women losing about 5% of their body weight during 4 wk of very low-calorie diet. Sixty-six genes from this list were also regu-lated during overfeeding. Function analysis revealed that these genes were mostly related to lipid metabolism (all up-regulated during overfeeding and down-regulated dur-ing weight loss), such as GDAT2, SCD or SRBEP1, to angiogenesis (ANGPTL4, HEYL, AGT), to extracellular matrix (COL5A2), or to Wnt signaling (SFRP2). Interest-ingly, MME and AGT, two genes of the renin-angiotensin system, also showed opposite regulations. Thus this anal-ysis revealed that key genes of the major pathways in-volved in the initial steps of weight gain are also regulated, but in an opposite way, during weight loss.
Obesity is characterized by marked infiltration of in-flammatory cells in adipose tissue (2, 3), and weight loss reduced the abundance of inflammatory markers (7, 40). We did not observe accumulation of macrophages or other immune cells during weight gain. Because the study was conducted with healthy men only and weight gain was moderated, it could not be excluded that modifications were not detectable by immunohistochemistry. However, we also did not find major changes in the expression of genes related to inflammation. A cluster of 19 genes was retrieved by manual classification, but we were not able to assign them to defined and coordinated functions. These observations, at odds with what was generally found in rodent models submitted to high-fat diet (2, 3), is however in agreement with a recent report showing no change in adipose tissue macrophage and lymphocyte infiltration af-ter 28 d of overfeeding (8). The fact that even afaf-ter 2 months of overfeeding there was no evidence for macro-phage infiltration suggests that inflammation is not an early event in the development of human adipose tissue.
Due to the design of the protocol with three successive biopsies of sc fat and thus the low amount of tissue avail-able for analysis, we were forced to separate the popula-tion into subgroups. Despite this limitapopula-tion that precluded
studying the relationships between metabolic parameters, gene expression, and histological observations, we were able to perform a comprehensive analysis of sc adipose tissue remodeling during the early phases of moderate weight gain in humans. We demonstrate that the initial events of adipose tissue development during a short period of positive energy balance in healthy men required the coordinated and time-dependent regulation of clusters of genes (Fig. 4). Inhibition of canonical Wnt signaling ap-pears to be an important step during adipose tissue re-modeling, which mostly includes coordinated neovas-cularization and extracellular matrix modifications. Additional factors, such as those related to the angiotensin system, apelin, or other growth factors may contribute to the correct orchestration of these interrelated processes to lead to an efficient storage of lipids and development of adipose tissue. These pathways therefore represent poten-tial targets to look after in pathologies of adipose devel-opment, including obesity.
Acknowledgments
The authors thank the medical staff and the nurses of Rhoˆne-Alpes and Auvergne Human Nutrition Research Centers for their skillful assistance. Dr. Jean-Philippe Bastard and Dr. Jocelyne Drai are acknowledged for their contributions in the realization of the metabolic analyses. Alexie Poulet, from the Department of Pathology, Hoˆpital Edouard Herriot, Lyon; and Armelle Paquet and Nicolas Gadot, from ANIPATH, Universite´ Lyon 1, are acknowledged for their help in performing histolog-ical, immunohistochemhistolog-ical, and morphometric analyses. We also thank Dr. Pierre Daubersies and Re´my Hanf for helpful discussions in the frame of the IT-DIAB project. All the volun-teers are deeply acknowledged for their invaluable contribution to the study.
Address all correspondence and requests for reprints to: Hubert Vidal, Institut National de la Sante´ et de la Recherche Me´dicale Unit 1060, Faculte´ de me´decine Lyon Sud, 165 chemin du grand Revoyet, BP 12, F-69921 Oullins Cedex, France. E-mail: hubert.vidal@univ-lyon1.fr. And Martine Laville, Cen-tre de Recherche en Nutrition Humaine Rhone-Alpes, CenCen-tre Hospitalier Lyon-Sud, F-69310 Pierre Be´nite, France. E-mail: martine.laville@chu-lyon.fr.
This work was supported by research grants from Hospices Civils de Lyon (Actions incitatives), from the Program Hospita-lier de Recherche Clinique interregional, from the Agence Na-tionale de la Recherche (programs PRNH and PNRA-Metapro-file), and from the ISI program of Agence pour l’Innovation OSEO (IT-DIAB project). E.C. was supported by a postdoctoral fellowship from Danone, and M.A. is the recipient of a doctoral fellowship from the Ministe`re de l’Enseignement Supe´rieur et de la Recherche, France.
H.V. and M.L. conceived and designed the study. M.A., S.L.-P., E.C., A.A.H., and B.M. recruited the patients and performed the overfeeding protocol. M.A., E.C., and M.S. acquired clinical
and biological data. M.A., E.M., C.D., E.L., J.B., and H.V. per-formed genomic analysis and interpretations. J.-Y.S. realized the histology study. All authors interpreted and discussed data. M.A., H.V., and M.L. wrote the manuscript. All authors ap-proved the final version of the manuscript.
The clinical study was registered at www.clinicaltrials.gov under number NCT00905892.
Disclosure Summary: The authors declare they have nothing to disclose.
References
1. Divoux A, Cle´ment K 2011 Architecture and the extracellular ma-trix: the still unappreciated components of the adipose tissue. Obes Rev 12:e494 –503
2. Xu H, Barnes GT, Yang Q, Tan G, Yang D, Chou CJ, Sole J, Nichols A, Ross JS, Tartaglia LA, Chen H 2003 Chronic inflammation in fat plays a crucial role in the development of obesity-related insulin resistance. J Clin Invest 112:1821–1830
3. Weisberg SP, McCann D, Desai M, Rosenbaum M, Leibel RL, Fer-rante Jr AW 2003 Obesity is associated with macrophage accumu-lation in adipose tissue. J Clin Invest 112:1796 –1808
4. Henegar C, Tordjman J, Achard V, Lacasa D, Cremer I, Guerre-Millo M, Poitou C, Basdevant A, Stich V, Viguerie N, Langin D, Bedossa P, Zucker JD, Clement K 2008 Adipose tissue transcrip-tomic signature highlights the pathological relevance of extracellular matrix in human obesity. Genome Biol 9:R14
5. Blu¨her M 2008 The inflammatory process of adipose tissue. Pediatr Endocrinol Rev 6:24 –31
6. Cancello R, Henegar C, Viguerie N, Taleb S, Poitou C, Rouault C, Coupaye M, Pelloux V, Hugol D, Bouillot JL, Bouloumie´ A, Bar-batelli G, Cinti S, Svensson PA, Barsh GS, Zucker JD, Basdevant A, Langin D, Cle´ment K 2005 Reduction of macrophage infiltration and chemoattractant gene expression changes in white adipose tis-sue of morbidly obese subjects after surgery-induced weight loss. Diabetes 54:2277–2286
7. Cle´ment K, Viguerie N, Poitou C, Carette C, Pelloux V, Curat CA, Sicard A, Rome S, Benis A, Zucker JD, Vidal H, Laville M, Barsh GS, Basdevant A, Stich V, Cancello R, Langin D 2004 Weight loss reg-ulates inflammation-related genes in white adipose tissue of obese subjects. FASEB J 18:1657–1669
8. Tam CS, Viardot A, Cle´ment K, Tordjman J, Tonks K, Greenfield JR, Campbell LV, Samocha-Bonet D, Heilbronn LK 2010 Short-term overfeeding may induce peripheral insulin resistance without altering subcutaneous adipose tissue macrophages in humans. Di-abetes 59:2164 –2170
9. Franck N, Gummesson A, Jernås M, Glad C, Svensson PA, Guillot G, Rudemo M, Nystro¨m FH, Carlsson LM, Olsson B 2011 Identi-fication of adipocyte genes regulated by caloric intake. J Clin En-docrinol Metab 96:E413–E418
10. Shea J, French CR, Bishop J, Martin G, Roebothan B, Pace D, Fitz-patrick D, Sun G 2009 Changes in the transcriptome of abdominal subcutaneous adipose tissue in response to short-term overfeeding in lean and obese men. Am J Clin Nutr 89:407– 415
11. Meugnier E, Bossu C, Oliel M, Jeanne S, Michaut A, Sothier M, Brozek J, Rome S, Laville M, Vidal H 2007 Changes in gene ex-pression in skeletal muscle in response to fat overfeeding in lean men. Obesity (Silver Spring) 15:2583–2594
12. Nazare JA, Normand S, Oste Triantafyllou A, Brac de la Perrie`re A, Desage M, Laville M 2009 Modulation of the postprandial phase by -glucan in overweight subjects: effects on glucose and insulin ki-netics. Mol Nutr Food Res 53:361–369
13. Ducluzeau PH, Perretti N, Laville M, Andreelli F, Vega N, Riou JP, Vidal H 2001 Regulation by insulin of gene expression in human
skeletal muscle and adipose tissue. Evidence for specific defects in type 2 diabetes. Diabetes 50:1134 –1142
14. Irizarry RA, Hobbs B, Collin F, Beazer-Barclay YD, Antonellis KJ, Scherf U, Speed TP 2003 Exploration, normalization, and summa-ries of high density oligonucleotide array probe level data. Biosta-tistics 4:249 –264
15. Gautier L, Cope L, Bolstad BM, Irizarry RA 2004 Affy—analysis of Affymetrix GeneChip data at the probe level. Bioinformatics 20: 307–315
16. Smyth GK 2004 Linear models and empirical bayes methods for assessing differential expression in microarray experiments. Stat Appl Genet Mol Biol 3:Article 3
17. Huang da W, Sherman BT, Lempicki RA 2009 Bioinformatics en-richment tools: paths toward the comprehensive functional analysis of large gene lists. Nucleic Acids Res 37:1–13
18. Debard C, Laville M, Berbe V, Loizon E, Guillet C, Morio-Liondore B, Boirie Y, Vidal H 2004 Expression of key genes of fatty acid oxidation, including adiponectin receptors, in skeletal muscle of type 2 diabetic patients. Diabetologia 47:917–925
19. Shimano H 2002 Sterol regulatory element-binding protein family as global regulators of lipid synthetic genes in energy metabolism. Vitam Horm 65:167–194
20. Samocha-Bonet D, Campbell LV, Viardot A, Freund J, Tam CS, Greenfield JR, Heilbronn LK 2010 A family history of type 2 dia-betes increases risk factors associated with overfeeding. Diabetolo-gia 53:1700 –1708
21. White UA, Stephens JM 2010 Transcriptional factors that promote formation of white adipose tissue. Mol Cell Endocrinol 318:10 –14 22. Spalding KL, Arner E, Westermark PO, Bernard S, Buchholz BA, Bergmann O, Blomqvist L, Hoffstedt J, Na¨slund E, Britton T, Con-cha H, Hassan M, Ryde´n M, Frise´n J, Arner P 2008 Dynamics of fat cell turnover in humans. Nature 453:783–787
23. Tchoukalova YD, Votruba SB, Tchkonia T, Giorgadze N, Kirkland JL, Jensen MD 2010 Regional differences in cellular mechanisms of adipose tissue gain with overfeeding. Proc Natl Acad Sci USA 107: 18226 –18231
24. Christiaens V, Lijnen HR 2010 Angiogenesis and development of adipose tissue. Mol Cell Endocrinol 318:2–9
25. Thomas M, Augustin HG 2009 The role of the angiopoietins in vascular morphogenesis. Angiogenesis 12:125–137
26. Cheng N, Brantley DM, Chen J 2002 The ephrins and Eph receptors in angiogenesis. Cytokine Growth Factor Rev 13:75– 85
27. Parker BS, Argani P, Cook BP, Liangfeng H, Chartrand SD, Zhang M, Saha S, Bardelli A, Jiang Y, St Martin TB, Nacht M, Teicher BA, Klinger KW, Sukumar S, Madden SL 2004 Alterations in vascular gene expression in invasive breast carcinoma. Cancer Res 64:7857– 7866
28. Diez H, Fischer A, Winkler A, Hu CJ, Hatzopoulos AK, Breier G, Gessler M 2007 Hypoxia-mediated activation of Dll4-Notch-Hey2 signaling in endothelial progenitor cells and adoption of arterial cell fate. Exp Cell Res 313:1–9
29. Kimura H, Miyashita H, Suzuki Y, Kobayashi M, Watanabe K, Sonoda H, Ohta H, Fujiwara T, Shimosegawa T, Sato Y 2009 Dis-tinctive localization and opposed roles of vasohibin-1 and vaso-hibin-2 in the regulation of angiogenesis. Blood 113:4810 – 4818 30. Zhang K, Hu S, Wu J, Chen L, Lu J, Wang X, Liu X, Zhou B, Yen
Y 2009 Overexpression of RRM2 decreases thrombspondin-1 and increases VEGF production in human cancer cells in vitro and in vivo: implication of RRM2 in angiogenesis. Mol Cancer 8:11 31. Kunduzova O, Alet N, Delesque-Touchard N, Millet L,
Castan-Laurell I, Muller C, Dray C, Schaeffer P, Herault JP, Savi P, Bono F, Valet P 2008 Apelin/APJ signaling system: a potential link between adipose tissue and endothelial angiogenic processes. FASEB J 22: 4146 – 4153
32. Khan T, Muise ES, Iyengar P, Wang ZV, Chandalia M, Abate N, Zhang BB, Bonaldo P, Chua S, Scherer PE 2009 Metabolic dys-regulation and adipose tissue fibrosis: role of collagen VI. Mol Cell Biol 29:1575–1591
33. Pasarica M, Gowronska-Kozak B, Burk D, Remedios I, Hymel D, Gimble J, Ravussin E, Bray GA, Smith SR 2009 Adipose tissue col-lagen VI in obesity. J Clin Endocrinol Metab 94:5155–5162 34. Sethi JK, Vidal-Puig A 2010 Wnt signalling and the control of
cel-lular metabolism. Biochem J 427:1–17
35. Prestwich TC, Macdougald OA 2007 Wnt/-catenin signaling in adipogenesis and metabolism. Curr Opin Cell Biol 19:612– 617 36. Courtwright A, Siamakpour-Reihani S, Arbiser JL, Banet N,
Hill-iard E, Fried L, Livasy C, Ketelsen D, Nepal DB, Perou CM, Pat-terson C, Klauber-Demore N 2009 Secreted frizzle-related protein 2 stimulates angiogenesis via a calcineurin/NFAT signaling pathway. Cancer Res 69:4621– 4628
37. Lagathu C, Christodoulides C, Virtue S, Cawthorn WP, Franzin C, Kimber WA, Nora ED, Campbell M, Medina-Gomez G, Cheyette
BN, Vidal-Puig AJ, Sethi JK 2009 Dact1, a nutritionally regulated preadipocyte gene, controls adipogenesis by coordinating the Wnt/ -catenin signaling network. Diabetes 58:609–619
38. Nishizuka M, Koyanagi A, Osada S, Imagawa M 2008 Wnt4 and Wnt5a promote adipocyte differentiation. FEBS Lett 582:3201– 3205
39. Mogi M, Iwai M, Horiuchi M 2006 Emerging concept of adipo-genesis regulation by the renin-angiotensin system. Hypertension 48:1020 –1022
40. Capel F, Klimca´kova´ E, Viguerie N, Roussel B, Vítkova´ M, Kova´cik-ova´ M, Pola´k J, KKova´cik-ova´cKova´cik-ova´ Z, Galitzky J, Maoret JJ, Hana´cek J, Pers TH, Bouloumie´ A, Stich V, Langin D 2009 Macrophages and adi-pocytes in human obesity: adipose tissue gene expression and insulin sensitivity during calorie restriction and weight stabilization. Dia-betes 58:1558 –1567