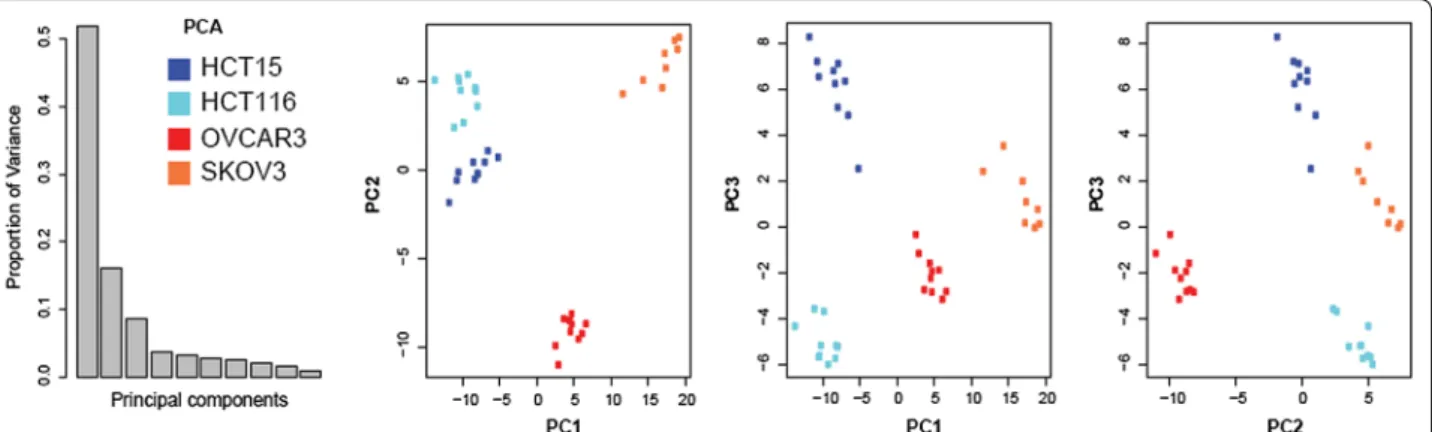
Metabolic signatures differentiate ovarian from colon cancer cell lines
Texte intégral
Figure

Documents relatifs
Our results showed a significantly higher level of CD133 gene expression in D283 compared with D341 cells and its almost complete lack in the DAOY cell line (Figure 1A)..
In order to construct the DPSO model, some hypotheses are made: the open strate- gic planning and scheduling are used, DPSO is focusing only on the OR, the opera- tion day is
In a second part, we bridge the gap be- tween the description of bursts in the framework of percolation and the temporal description of neural networks activity by showing how
Mâintenùi c esl dù passé ctje sùis tellemenl bien aw
responsabilité d'atteindre l'objectif Chaque fois que nous parvenons à contrôler plus de situations..
Patients with increased dietary self- efficacy had lower serum potassium and weight gain, showed more favourable compliance attitudes and behaviours toward prescribed regimens
In addition, the soluble endothelial protein C receptor (sEPCR) was quantified by ELISA in ascitic fluid of patients with ovarian cancer. Our results showed that in the
In this section, we disprove Schoebelen’s conjecture by giving an example of a decomposable language which is not a finite union of products of commutative languages.. Let u and v
