HAL Id: insu-00744027
https://hal-insu.archives-ouvertes.fr/insu-00744027
Submitted on 23 Apr 2013
HAL is a multi-disciplinary open access
archive for the deposit and dissemination of
sci-entific research documents, whether they are
pub-lished or not. The documents may come from
teaching and research institutions in France or
abroad, or from public or private research centers.
L’archive ouverte pluridisciplinaire HAL, est
destinée au dépôt et à la diffusion de documents
scientifiques de niveau recherche, publiés ou non,
émanant des établissements d’enseignement et de
recherche français ou étrangers, des laboratoires
publics ou privés.
On the location of hotspots in the framework of mantle
convection
Laurent Husson, Clinton Conrad
To cite this version:
Laurent Husson, Clinton Conrad.
On the location of hotspots in the framework of mantle
convection.
Geophysical Research Letters, American Geophysical Union, 2012, 39, pp.L17304.
On the location of hotspots in the framework of mantle convection
L. Husson
1,2and C. P. Conrad
3Received 25 June 2012; revised 26 July 2012; accepted 29 July 2012; published 15 September 2012.
[1] Putative mechanisms that have been proposed to explain
intraplate “hotspot” volcanism extensively depart from the early plume theory, and many do not involve deep mantle flow. Here, we look for a relationship between hotspot volcanism and mantle flow using flow models excited by density anomalies inferred from seismic tomography. We show that previously identified major hotspots are prefer-entially located, to a high degree of statistical significance, above regions of positive divergence of horizontal shear tractions beneath the lithosphere. This observation renders it difficult to discard some contribution of mantle flow as a control on hotspot volcanism and instead suggests that mantle plumes are drawn toward, and conveyed by, mantle upwellings (either active or passive), which are revealed by the positive stress divergence. This allows us to exclude a variety of external or shallow mechanisms for the major hot-spots. Because we also find that many secondary hotspots do fall at random locations with respect to mantle flow, we emphasize that alternative processes are also required to trig-ger the less productive volcanism.Citation: Husson, L., and C. P. Conrad (2012), On the location of hotspots in the framework of mantle convection, Geophys. Res. Lett., 39, L17304, doi:10.1029/2012GL052866.
1.
Introduction
[2] Hotspot volcanism, which occurs remotely from plate
boundaries, calls for explanations that either invoke rising plumes of hot mantle, originating in the lower mantle [Wilson, 1963; Morgan, 1971], or processes that interplay within the framework of plate tectonics [Anderson, 2001; Foulger and Natland, 2003]. Morgan [1978] opened Pandora’s box by suggesting multiple origins for hotspot volcanism, and advo-cated a role for lithosphere cracks in particular [Anderson, 2000]. Many catalogues followed, which categorized postu-lated hotspots based on multiple criteria [e.g., Sleep, 1990; Courtillot et al., 2003; Montelli et al., 2006] (Anderson, www.mantleplumes.org). Most frustrating is the fact that the current blindness of seismic tomography to plume-scale structures precludes definitive tomographic assessment of a deep origin for hotspots [Ritsema and Allen, 2003]. In addi-tion, the transient nature of hotspot dynamics echoes the possibility that multiple geometries and pathways for plumes may be found at a given time [Kumagai et al., 2008]. This
leaves open the possibility that hotspot volcanism may be attached to shallow plumes that also obey plume theory.
[3] Both deep-plume and shallow-tectonic mechanisms
may be modified by background flow patterns, but in dif-ferent ways. For example, rising plumes may have their upward path deflected by the background global mantle flow [e.g., Tarduno et al., 2003]. Tectonic explanations generally require lithospheric stresses, which are influenced by stres-ses from mantle flow, to be tensile enough to permit surface eruption of sub-lithospheric melts [e.g., Anderson, 2000]. Earth-like mantle flow models yield predictions of the stress field within the Earth that allow us to test these hypotheses. Steinberger et al. [2001] showed that hotspots are prefer-entially found where tensile stresses are found; herein we use the horizontal divergence of the sub-lithospheric stress field as a proxy to express the upwelling or downwelling vigor of the underlying flow, and to explore the interplay between mantle flow and hotspot volcanism. We do not track plumes in seismic tomography, but rather explore how mantle flow may or may not help to convey plumes.
2.
Matching Hotspots With Mantle Flow
[4] We build upon the model results of Conrad and Behn
[2010], who compute the lithospheric tractions beneath the lithosphere (Figure 1a) using the finite element code CitcomS [Zhong et al., 2000]. Mantle flow is excited by density heterogeneities inferred from seismic tomography [Ritsema et al., 2004]. This tomography model expresses heterogeneity only up to spherical harmonic degree 20, which means that density structures with wavelengths shorter than about 1000 km are excluded or smoothed. As plume conduits are thought to be significantly narrower, upwellings in our flow model are not driven by the plumes themselves. The viscosity structure decomposes into a lower and an upper mantle, an asthenosphere and a lithosphere of variable thickness (see Conrad and Behn [2010] for details). No-slip is imposed at the surface and free slip at the core-mantle boundary. The flow and viscosity fields yield the stress field, including the horizontal shear traction beneath the rigid lithosphere, from which we compute the divergence. We exclude density anomalies shallower than 300 km primarily because seismic anomalies do not convert directly into den-sity anomalies at those depths [e.g., Jordan, 1975]; this choice allows us to exclude shallow processes, including those associated with subsurface circulation. Finally, the flow model excludes plate motions that shear the upper sur-face of the mantle (as in Conrad and Behn [2010] or Husson et al. [2012]). This choice allows us to match hotspot loca-tions with the vigor of buoyancy-driven mantle convection and not the effects of plate divergence.
[5] We base our analysis on five hotspot catalogues.
Anderson’s collection (www.mantleplumes.org) is the most comprehensive (64 values). Courtillot et al.’s [2003] list
1Géosciences Rennes, CNRS UMR 6118, Rennes, France. 2
Laboratoire de Planétologie et Géodynamique de Nantes, CNRS UMR 6112, Nantes, France.
3
Department of Geology and Geophysics, SOEST, University of Hawaii at Manoa, Honolulu, Hawaii, USA.
Corresponding author: L. Husson, Géosciences Rennes, CNRS UMR 6118, F-35042 Rennes CEDEX, France. (lhusson@univ-rennes1.fr) ©2012. American Geophysical Union. All Rights Reserved. 0094-8276/12/2012GL052866
conveniently isolates three classes (based on their associated tracks, traps, productivity, chemical signatures, and shear wave velocity underneath them) out of which we retain the primary hotspots (9 values) and the secondary hotspots (13 values). Lastly, we merged the deep and potentially deep lists of Montelli et al. [2006] on the one hand (19 values), and
their upper mantle and mid mantle lists on the other (8 values), which are based on the geometries of the P- and S-wave anomalies beneath hotspots. We subsequently com-pare these collections, hereafter referred to as A, C1, C2, M1 and M2, with the divergence of the sub-lithospheric shear stress field (Figure 1 - note that on these maps, shear vectors were normalized prior to computing the divergence in order to visually sharpen the location of down- and up-wellings).
[6] For each hotspot, we extracted the average magnitude
of the shear traction divergence within 100 km of the hotspot location (Table 1, umlm ud). 70% of the surface covered by this procedure hits portions of the lithosphere exhibiting positive values of divergence for A, 98% for C1, 83% for M1, 45% for C2 and 39% for M2 (Figure 2a). The cumula-tive distribution of divergence is below the background distribution (for the entire Earth) for C1, M1 and A hotspots (Figure 2a), which suggests that these catalogs are prefer-entially associated with mantle upwelling excited by internal sources, while C2 and M2 call for alternative explanations. The Kolmogorov-Smirnov test [Press et al., 1992] measures the chances that the observed difference between the distri-bution of divergence at hotspot locations and the background distribution might arise by random selection of the same number of independent spots from the global divergence distribution. For A, C1 and M1, we find that the chances that the correlation between positive divergence and hotspot locations could be randomly obtained is almost null (≪1%), while M2 and C2 appear less related to the divergence field (Figure 3a).
[7] Switching on and off (i) density heterogeneity in the
upper or lower mantle (Figures 1b and 1c) or (ii) the pos-itive or negative density anomalies (i.e., active down-wellings or updown-wellings) and combining the associated flow fields yield similarly good correlations for C1 and M1 as long as the upper mantle and upwellings are involved (Figures 2a, 2b, 2d, 2e, 3a, 3b, 3d, and 3e). The inclusion of flow driven from the lower mantle does not worsen the results significantly, nor does the inclusion of upper mantle downwellings. The match degrades when only the lower mantle (up- and downwellings) is active but remains fair (65%, 77% and 80% sample positive divergence for A, C1 and M1; 10–20% random chance, Figures 2g–2i and 3g– 3i). It also remains good when downwellings only are involved (but better scores are found when up and down-wellings contribute: 79%, 93% and 84% positive hits for A, C1 and M1, <12% random chance). In fact, better scores are obtained for models for which the range of distribution of magnitudes of the background horizontal divergence is large (see the narrowing of the background horizontal divergence from a to i in Figure 2). The mean divergence is higher for C1 than for any other list. Last, increasing the sampling radius around discrete locations of hotspots yields nearly equivalent results up to 500 km, and degrades at 1000 km, because sampling becomes almost random.
[8] Our results possibly support the analyses of Montelli
et al. [2006] and Courtillot et al. [2003], who assign a deep source for some hotspots. But our filter is coarser: Montelli et al. [2006] only retain 19 deep and potentially deep hotspots, and Courtillot et al. [2003] 9 primary hot-spots. Within these 21 independent locations, only Ascension and Azores do not sample positive divergence of the sub-lithospheric shear tractions. Within the entire catalogue, all three studies [Montelli et al., 2006; Courtillot et al., 2003; Figure 1. (a) Shear tractions beneath the lithosphere
induced by buoyancy forces within the mantle. Horizontal divergence of sub-lithospheric shear tractions excited by (b) upper and (c) lower mantle density anomalies. On those map views, shear vectors were normalized prior to computa-tion, in order to emphasize the location of downwellings and upwellings (this sharpens the lateral variations and reduces the value of divergence where shear stresses are aligned). Orange curve is null divergence. Symbols give the location of hotspots from Anderson’s entire compilation (A, green circles), Courtillot et al.’s [2003] primary hotspots (C1, yellow stars) and secondary hotspots (C2, yellow triangles), Montelli et al.’s [2006] “deep” or “potentially deep” hotspots (M1, pink diamonds) and“upper mantle” or “mid mantle” hotspots (M2, pink squares).
HUSSON AND CONRAD: HOTSPOTS AND MANTLE CONVECTION L17304
L17304
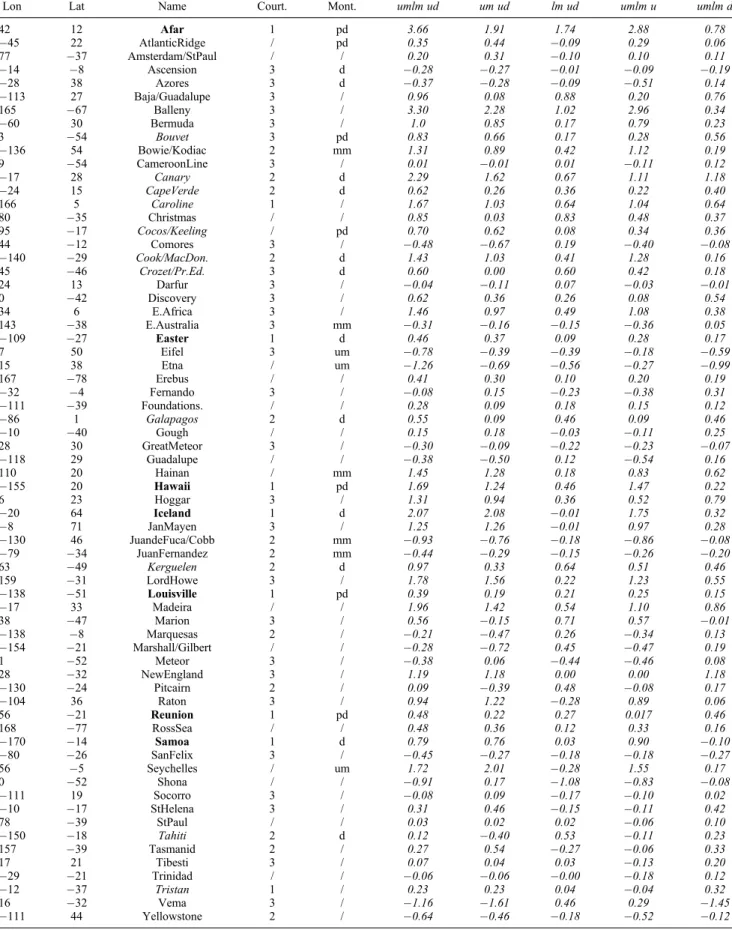
Table 1. Mean Divergence of Mantle Shear Tractions (in Pa s 1) Beneath All Hotspots Considereda
Lon Lat Name Court. Mont. umlm ud um ud lm ud umlm u umlm d
42 12 Afar 1 pd 3.66 1.91 1.74 2.88 0.78 45 22 AtlanticRidge / pd 0.35 0.44 0.09 0.29 0.06 77 37 Amsterdam/StPaul / / 0.20 0.31 0.10 0.10 0.11 14 8 Ascension 3 d 0.28 0.27 0.01 0.09 0.19 28 38 Azores 3 d 0.37 0.28 0.09 0.51 0.14 113 27 Baja/Guadalupe 3 / 0.96 0.08 0.88 0.20 0.76 165 67 Balleny 3 / 3.30 2.28 1.02 2.96 0.34 60 30 Bermuda 3 / 1.0 0.85 0.17 0.79 0.23 3 54 Bouvet 3 pd 0.83 0.66 0.17 0.28 0.56 136 54 Bowie/Kodiac 2 mm 1.31 0.89 0.42 1.12 0.19 9 54 CameroonLine 3 / 0.01 0.01 0.01 0.11 0.12 17 28 Canary 2 d 2.29 1.62 0.67 1.11 1.18 24 15 CapeVerde 2 d 0.62 0.26 0.36 0.22 0.40 166 5 Caroline 1 / 1.67 1.03 0.64 1.04 0.64 80 35 Christmas / / 0.85 0.03 0.83 0.48 0.37 95 17 Cocos/Keeling / pd 0.70 0.62 0.08 0.34 0.36 44 12 Comores 3 / 0.48 0.67 0.19 0.40 0.08 140 29 Cook/MacDon. 2 d 1.43 1.03 0.41 1.28 0.16 45 46 Crozet/Pr.Ed. 3 d 0.60 0.00 0.60 0.42 0.18 24 13 Darfur 3 / 0.04 0.11 0.07 0.03 0.01 0 42 Discovery 3 / 0.62 0.36 0.26 0.08 0.54 34 6 E.Africa 3 / 1.46 0.97 0.49 1.08 0.38 143 38 E.Australia 3 mm 0.31 0.16 0.15 0.36 0.05 109 27 Easter 1 d 0.46 0.37 0.09 0.28 0.17 7 50 Eifel 3 um 0.78 0.39 0.39 0.18 0.59 15 38 Etna / um 1.26 0.69 0.56 0.27 0.99 167 78 Erebus / / 0.41 0.30 0.10 0.20 0.19 32 4 Fernando 3 / 0.08 0.15 0.23 0.38 0.31 111 39 Foundations. / / 0.28 0.09 0.18 0.15 0.12 86 1 Galapagos 2 d 0.55 0.09 0.46 0.09 0.46 10 40 Gough / / 0.15 0.18 0.03 0.11 0.25 28 30 GreatMeteor 3 / 0.30 0.09 0.22 0.23 0.07 118 29 Guadalupe / / 0.38 0.50 0.12 0.54 0.16 110 20 Hainan / mm 1.45 1.28 0.18 0.83 0.62 155 20 Hawaii 1 pd 1.69 1.24 0.46 1.47 0.22 6 23 Hoggar 3 / 1.31 0.94 0.36 0.52 0.79 20 64 Iceland 1 d 2.07 2.08 0.01 1.75 0.32 8 71 JanMayen 3 / 1.25 1.26 0.01 0.97 0.28 130 46 JuandeFuca/Cobb 2 mm 0.93 0.76 0.18 0.86 0.08 79 34 JuanFernandez 2 mm 0.44 0.29 0.15 0.26 0.20 63 49 Kerguelen 2 d 0.97 0.33 0.64 0.51 0.46 159 31 LordHowe 3 / 1.78 1.56 0.22 1.23 0.55 138 51 Louisville 1 pd 0.39 0.19 0.21 0.25 0.15 17 33 Madeira / / 1.96 1.42 0.54 1.10 0.86 38 47 Marion 3 / 0.56 0.15 0.71 0.57 0.01 138 8 Marquesas 2 / 0.21 0.47 0.26 0.34 0.13 154 21 Marshall/Gilbert / / 0.28 0.72 0.45 0.47 0.19 1 52 Meteor 3 / 0.38 0.06 0.44 0.46 0.08 28 32 NewEngland 3 / 1.19 1.18 0.00 0.00 1.18 130 24 Pitcairn 2 / 0.09 0.39 0.48 0.08 0.17 104 36 Raton 3 / 0.94 1.22 0.28 0.89 0.06 56 21 Reunion 1 pd 0.48 0.22 0.27 0.017 0.46 168 77 RossSea / / 0.48 0.36 0.12 0.33 0.16 170 14 Samoa 1 d 0.79 0.76 0.03 0.90 0.10 80 26 SanFelix 3 / 0.45 0.27 0.18 0.18 0.27 56 5 Seychelles / um 1.72 2.01 0.28 1.55 0.17 0 52 Shona / / 0.91 0.17 1.08 0.83 0.08 111 19 Socorro 3 / 0.08 0.09 0.17 0.10 0.02 10 17 StHelena 3 / 0.31 0.46 0.15 0.11 0.42 78 39 StPaul / / 0.03 0.02 0.02 0.06 0.10 150 18 Tahiti 2 d 0.12 0.40 0.53 0.11 0.23 157 39 Tasmanid 2 / 0.27 0.54 0.27 0.06 0.33 17 21 Tibesti 3 / 0.07 0.04 0.03 0.13 0.20 29 21 Trinidad / / 0.06 0.06 0.00 0.18 0.12 12 37 Tristan 1 / 0.23 0.23 0.04 0.04 0.32 16 32 Vema 3 / 1.16 1.61 0.46 0.29 1.45 111 44 Yellowstone 2 / 0.64 0.46 0.18 0.52 0.12 a
Bold figures indicate hotspots whose deep origin is univocally inferred by Courtillot et al. [2003] (C1), Montelli et al. [2006] (M1), and herein compatible with a whole mantle flow (up- and down-wellings). Italic indicates hotspots whose deep mantle genesis is either inferred by Courtillot et al. [2003] or Montelli et al. [2006], and is similarly confirmed by our analysis. 1, 2, and 3 in column Court. refer to the three classes of Courtillot et al. [2003], and d, pd, mm and um in column Mont. refer to the inferred deep, potentially deep, mid mantle and upper mantle classes of Montelli et al. [2006], respectively. Results are given as the mean value of the divergence within a search radius of 100 km about the hotspot location.
this study] find a deep genesis for Afar, Easter, Hawaii, Iceland, Louisville, Reunion and Samoa (Table 1).Tristan and Caroline, not evaluated by Montelli et al. [2006], could be added. Noteworthy hotspots, like Crozet, Galapagos or Tahiti, require the activation of the lower mantle to score well, while Easter or Iceland yield better results when upper mantle flow is excited. Mount Etna, Eifel or Yellowstone have been thought to owe their existence to the return flow of subducting slabs in the upper mantle [Faccenna et al., 2010]; yet, our models show little or no positive diver-gence at their locations when downwellings in the upper mantle are excited. Some hotspots appear to be conveyed by a vigorous flow that samples high divergence for any com-bination. These include the hotspots that are associated with the African and Pacific superswells [e.g., Cazenave et al., 1989; Boschi et al., 2007], for example East Africa, Hoggar, Afar, Kerguelen, Canary, Cape Verde, Louisville, Hawaii, Caroline or Cook. Interestingly, Iceland doesn’t seem related to lower, but rather to upper mantle flow. Last, our models also exclude any connection to mantle flow for several hotspots, such as Ascension, Azores, Juan de Fuca, Yellowstone, and many other minor hotspots. This confirms that, although some hotspots are clearly conveyed by mantle flow, many others require alternative mechanisms.
3.
Discussion and Conclusions
[9] The robust correlation between major hotspot locations
and mantle flow patterns excludes several intraplate volca-nism mechavolca-nisms that are unrelated to mantle flow as potential drivers of the major hotspots (C1 and M1, and some others, see Table 1). In particular, asteroid impacts [Jones
et al., 2002], cracks resulting from the far field tension within the lithosphere, or shear-driven melting [Conrad et al., 2011] should show a random relation to the divergence of the sublithospheric shear stress field. Similarly, small-scale con-vection [Ballmer et al., 2009], lithospheric delamination, and edge-driven convection [King and Anderson, 1998] are driven by shallow mantle circulation that is excluded from our models, and thus should also show a random match with mantle flow. Ridge-transform interaction [Beutel, 2005] would likely show a coincidence with the curl of the stress field: we find (not shown) this metric to be uncorrelated to the location of hotspots. None of these shallow processes seem to control the major hotspots, but they may still cause some of the hotspots from the M 2 and C 2 lists, as well as some of the intraplate volcanism that is not part of the hot-spot catalogs.
[10] The apparent dynamic causality between major hotspot
volcanism and background mantle flow does not exclude indirect explanations that involve mantle flow. In particular, mantle flow may supply enough tensional stresses to crack the lithosphere where sub-lithospheric shear tractions diverge, which would not require deep sources of heat. However, hotspot volcanism does not systematically occur where large positive divergence is predicted (Figure 1), which indicates that this mechanism may only be viable where the lithosphere is weak enough or fractured prior to magma percolation; there is no evidence to believe so for all hotspots. Addition-ally, if traction-driven cracking were important, we would expect it to yield minor as well as major hotspots, depending Figure 2. Normalized distribution of the horizontal
diver-gence of shear tractions beneath hotspot locations, for different lists of hotspots (see Figure 1). Dashed black curve shows the background distribution of divergence for the entire Earth. The flow is alternatively excited by buoyancy in the upper and/or lower mantle (um/lm), and alternatively accounts for (a, d, g) upwellings and downwellings, (b, e, h) upwellings, and (c, f, i) downwellings. Search radius is set to 100 km around the discrete locations of hotspots.
Figure 3. (a–i) Confidence p (and reciprocal 1-p), as determined from the Kolmogorov-Smirnov statistical test, that hotspot locations do not randomly sample the traction divergence map, for different hotspot catalogues (see text) and flow models, alternatively accounting for densities in the upper and lower mantle (um/lm), and alternatively account-ing for upwellaccount-ings and downwellaccount-ings (u/d). Search radius is set to 100 km around the discrete locations of hotspots.
HUSSON AND CONRAD: HOTSPOTS AND MANTLE CONVECTION L17304
L17304
on the local strength of the lithosphere and the availability of melt beneath it. However, we find that only the major hotspots correlate strong with shear traction divergence, while the minor hotspots do not.
[11] The most straightforward interpretation - that the hot
plumes themselves are driving the observed upwellings in the mantle flow model - is confounded by the fact that seismic tomography cannot illuminate the conduits that connect hotspots to the mantle. Thus, our results do not provide direct support for upwelling plume conduits beneath the major hotspots (C1 and M1). Instead, the preferential occurrence of major hotspots above regions of upper mantle upwelling suggests that background mantle flow may guide and convey hot plume material to the surface, as Jellinek et al. [2003] found in laboratory models. Alternatively, we cannot discount the possibility that downwellings in the upper mantle may disrupt plume conduits [Steinberger and O’Connell, 1998]. Accordingly, one might take the fact that flow driven by upper mantle heterogeneities correlates best with hotspot locations as evidence that plumes do not origi-nate from the lower mantle. This interpretation is at odds with global [Courtillot et al., 2003; Montelli et al., 2006; Konter and Becker, 2012], and local (Wolfe et al. [2009], for Hawaii) studies, which suggest that at least some hotspots originate from deep sources. Instead, it possibly shows that hotspot conduits originating from the lower mantle are deviated en route to the surface [e.g., Tarduno et al., 2003]. In fact, the best prediction of major hotspot locations is obtained when the entire mantle is excited, including upwellings and downwellings.
[12] Acknowledgments. Many thanks to Antoine Bézos for stimu-lating discussions, and Bernhard Steinberger and an anonymous reviewer for comments that improved the manuscript. C.P.C. acknowledges sup-port from NSF grant OCE-0937319.
[13] The Editor thanks Bernhard Steinberger and an anonymous reviewer for assisting in the evaluation of this paper.
References
Anderson, D. L. (2000), The thermal state of the upper mantle: No role for mantle plumes, Geophys. Res. Lett., 27, 3623–3626.
Anderson, D. L. (2001), Top-down tectonics?, Science, 293, 2016–2018. Ballmer, M. D., J. van Hunen, G. Ito, T. A. Bianco, and P. J. Tackley
(2009), Intraplate volcanism with complex age-distance patterns: A case for small-scale sublithospheric convection, Geochem. Geophys. Geosyst., 10, Q06015, doi:10.1029/2009GC002386.
Beutel, E. (2005), Stress-induced seamount formation at ridge-transform intersections, in Plates, Plumes, and Paradigms, edited by G. R. Foulger et al., Geol. Soc. Am. Spec. Pap., 338, 581–593.
Boschi, L., T. W. Becker, and B. Steinberger (2007), Mantle plumes: Dynamic models and seismic images, Geochem. Geophys. Geosyst., 8, Q10006, doi:10.1029/2007GC001733.
Cazenave, A., A. Souriau, and K. Dominh (1989), Global coupling of earth surface topography with hotspots, geoid and mantle heterogeneities, Nature, 340, 54–57.
Conrad, C. P., and M. D. Behn (2010), Constraints on lithosphere net rotation and asthenospheric viscosity from global mantle flow models and seismic
anisotropy, Geochem. Geophys. Geosyst., 11, Q05W05, doi:10.1029/ 2009GC002970.
Conrad, C. P., T. A. Bianco, E. I. Smith, and P. Wessel (2011), Patterns of intraplate volcanism controlled by asthenospheric shear, Nat. Geosci., 4, 317–321.
Courtillot, V., A. Davaille, J. Besse, and J. Stock (2003), Three distinct types of hotspots in the Earth’s mantle, Earth Planet. Sci. Lett., 205, 295–308, doi:10.1016/S0012-821X(02)01048-8.
Faccenna, C., T. W. Becker, S. Lallemand, Y. Lagabrielle, F. Funiciello, and C. Piromallo (2010), Subduction-triggered magmatic pulses. A new class of plumes?, Earth Planet. Sci. Lett., 209, 54–68.
Foulger, G., and J. Natland (2003), Is“hotspot” volcanism a consequence of plate tectonics?, Science, 300, 921–922.
Husson, L., C. P. Conrad, and C. Faccenna (2012), Plate motions, Andean orogeny, and volcanism above the South Atlantic convection cell, Earth Planet Sci Lett, 317, 126–135, doi:10.1016/j.epsl.2011.11.040. Jellinek, A., H. Gonnermann, and M. Richards (2003), Plume capture by
divergent plate motions: Implications for the distribution of hotspots, geochemistry of mid-ocean ridge basalts, and estimates of the heat flux at the core-mantle boundary, Earth Planet. Sci. Lett., 205, 361–378. Jones, A., G. Price, N. Price, P. DeCarli, and R. Clegg (2002), Impact
induced melting and the development of large igneous provinces, Earth Planet. Sci. Lett., 202, 551–561.
Jordan, T. H. (1975), The continental tectosphere, Rev. Geophys., 13, 1–12. King, S., and D. Anderson (1998), Edge-driven convection, Earth Planet.
Sci. Lett., 160, 289–296.
Konter, J. G., and T. W. Becker (2012), Shallow lithospheric contribution to mantle plumes revealed by integrating seismic and geochemical data, Geochem. Geophys. Geosyst., 13, Q02004, doi:10.1029/2011GC003923. Kumagai, I., A. Davaille, K. Kurita, and E. Stutzmann (2008), Mantle plumes: Thin, fat, successful, or failing? Constraints to explain hot spot volcanism through time and space, Geophys. Res. Lett., 35, L16301, doi:10.1029/2008GL035079.
Montelli, R., G. Nolet, F. A. Dahlen, and G. Masters (2006), A catalogue of deep mantle plumes: New results from finite-frequency tomography, Geochem. Geophys. Geosyst., 7, Q11007, doi:10.1029/2006GC001248. Morgan, W. J. (1971), Convection plumes in the lower mantle, Nature, 230,
42–43, doi:10.1038/230042a0.
Morgan, W. J. (1978), Rodriguez, Darwin, Amsterdam,…, A second type of hotspot island, J. Geophys. Res., 83, 5355–5360.
Press, W., B. Flannery, S. Teukolsky, and W. Vetterling (1992), Numerical Recipes in Fortran, Cambridge Univ. Press, New York.
Ritsema, J., and R. M. Allen (2003), The elusive mantle plume, Earth Planet. Sci. Lett., 207, 1–12, doi:10.1016/S0012-821X(02)01093-2. Ritsema, J., H. J. van Heijst, and J. H. Woodhouse (2004), Global transition
zone tomography, J. Geophys. Res., 109, B02302, doi:10.1029/ 2003JB002610.
Sleep, N. H. (1990), Hotspots and mantle plumes: Some phenomenology, J. Geophys. Res., 95, 6715–6736.
Steinberger, B., and R. J. O’Connell (1998), Advection of plumes in mantle flow: Implications for hotspot motion, mantle viscosity and plume distribution, Geophys. J. Int., 132, 412–434, doi:10.1046/ j.1365-246X.1998.00447.x.
Steinberger, B., H. Schmeling, and G. Marquart (2001), Large-scale litho-spheric stress field and topography induced by global mantle circulation, Earth Planet. Sci. Lett., 186, 75–91, doi:10.1016/S0012-821X(01) 00229-1.
Tarduno, J. A., et al. (2003), The Emperor Seamounts: Southward motion of the Hawaiian hotspot plume in Earth’s mantle, Science, 301, 1064–1069. Wilson, J. T. (1963), A possible origin of the Hawaiian Islands, Can.
J. Phys., 41, 863–868.
Wolfe, C., S. Solomon, G. Laske, J. Collins, R. Detrick, J. Orcutt, D. Bercovici, and E. Hauri (2009), Mantle shear-wave velocity structure beneath the Hawaiian hot spot, Science, 326, 1388–1390.
Zhong, S., M. T. Zuber, L. Moresi, and M. Gurnis (2000), Role of temperature-dependent viscosity and surface plates in spherical shell models of mantle convection, J. Geophys. Res., 105, 11,063–11,082.