HAL Id: inserm-02536487
https://www.hal.inserm.fr/inserm-02536487
Submitted on 8 Apr 2020
HAL is a multi-disciplinary open access archive for the deposit and dissemination of sci-entific research documents, whether they are pub-lished or not. The documents may come from teaching and research institutions in France or abroad, or from public or private research centers.
L’archive ouverte pluridisciplinaire HAL, est destinée au dépôt et à la diffusion de documents scientifiques de niveau recherche, publiés ou non, émanant des établissements d’enseignement et de recherche français ou étrangers, des laboratoires publics ou privés.
via multi-scale neural network
Thomas Gaudelet, Noël Malod-Dognin, Jon Sánchez-Valle, Vera Pancaldi,
Alfonso Valencia, Nataša Pržulj
To cite this version:
Thomas Gaudelet, Noël Malod-Dognin, Jon Sánchez-Valle, Vera Pancaldi, Alfonso Valencia, et al.. Un-veiling new disease, pathway, and gene associations via multi-scale neural network. PLoS ONE, Public Library of Science, 2020, 15 (4), pp.e0231059. �10.1371/journal.pone.0231059�. �inserm-02536487�
RESEARCH ARTICLE
Unveiling new disease, pathway, and gene
associations via multi-scale neural network
Thomas GaudeletID1, Noe¨l Malod-Dognin2, Jon Sa´nchez-Valle2, Vera PancaldiID2,3,4,
Alfonso ValenciaID2,5, Natasˇa Przˇulj1,2,5*
1 Department of Computer Science, University College London, London, United Kingdom, 2 Barcelona
Supercomputing Center (BSC), Barcelona, Spain, 3 Centre de Recherches en Cance´ rologie de Toulouse (CRCT), UMR1037 Inserm, ERL5294 CNRS, 31037, Toulouse, France, 4 University Paul Sabatier III, Toulouse, France, 5 ICREA, Pg. Lluis Companys, Barcelona, Spain
Abstract
Diseases involve complex modifications to the cellular machinery. The gene expression profile of the affected cells contains characteristic patterns linked to a disease. Hence, new biological knowledge about a disease can be extracted from these profiles, improving our ability to diag-nose and assess disease risks. This knowledge can be used for drug re-purposing, or by physi-cians to evaluate a patient’s condition and co-morbidity risk. Here, we consider differential gene expressions obtained by microarray technology for patients diagnosed with various dis-eases. Based on these data and cellular multi-scale organization, we aim at uncovering disease– disease, disease–gene and disease–pathway associations. We propose a neural network with structure based on the multi-scale organization of proteins in a cell into biological pathways. We show that this model is able to correctly predict the diagnosis for the majority of patients. Through the analysis of the trained model, we predict disease–disease, disease–pathway, and disease–gene associations and validate the predictions by comparisons to known interactions and literature search, proposing putative explanations for the predictions.
Introduction
A disease is often described by symptoms and affected tissues. However, to give a definite diagnosis, physicians often need to analyse patient samples (e.g., blood samples, or biopsies) for characteristic disease indicators, commonly referred to as disease biomarkers. These may include disregulated genes, or pathways [1,2]. Taking into consideration the history of a patient’s past and present conditions identifying genetic predispositions, as well as considering associations between diseases, aid in achieving accurate diagnostics and treatments [3]. By also taking advantage of the increasing availability of large scale molecular data, precision medicine aims at improving the understanding of the molecular base of diseases on individual basis, as well as the relationships between different conditions [4,5]. The benefits from such work are multiple and include drug re-purposing and identification of new disease biomarkers to improve treatments and diagnoses.
Many studies have investigated disease–gene and disease–pathway associations with the objective of improving diagnoses [6–9]. For instance, Zhaoet al. [8] propose a ranking of dis-ease genes based on gene expression and protein interactions using Katz-centrality. Hong
a1111111111 a1111111111 a1111111111 a1111111111 a1111111111 OPEN ACCESS
Citation: Gaudelet T, Malod-Dognin N,
Sa´nchez-Valle J, Pancaldi V, Valencia A, Przˇulj N (2020) Unveiling new disease, pathway, and gene associations via multi-scale neural network. PLoS ONE 15(4): e0231059.https://doi.org/10.1371/ journal.pone.0231059
Editor: Carlo Vittorio Cannistraci, Technische
Universitat Dresden, GERMANY
Received: October 8, 2019 Accepted: March 14, 2020 Published: April 6, 2020
Peer Review History: PLOS recognizes the
benefits of transparency in the peer review process; therefore, we enable the publication of all of the content of peer review and author responses alongside final, published articles. The editorial history of this article is available here:
https://doi.org/10.1371/journal.pone.0231059 Copyright:© 2020 Gaudelet et al. This is an open access article distributed under the terms of the
Creative Commons Attribution License, which permits unrestricted use, distribution, and reproduction in any medium, provided the original author and source are credited.
Data Availability Statement: The unprocessed
data is available from GEO and ArrayExpress databases. The GEO and ArrayExpress projects accession numbers, the processed data and all
et al. [9] design a tool that identifies significantly disrupted pathways by comparing patient gene expression against controls collected from other experiments. Cogswellet al. [10] identify putative gene and pathway biomarkers through change in miRNA in Alzheimer’s disease. In specific cancers, Abeelet al. [6] use support vector machines and ensemble feature selection methods to select putative gene biomarkers. Ciucciet al. [11] developed a general purpose algorithm based on the analysis of PCA loadings that can be used to identify genes that dis-criminate between conditions from expression data.
A key issue is that most of these studies consider diseases in isolation, i.e. comparing patients having a disease of interest to healthy individuals while the predicted biomarkers could be shared between various diseases. This limits the discriminative potential of such studies for accurate diagnoses. Indeed, network medicine has shown that diseases can share significant molecular background, as evidenced by numerous studies based on patient historical records [3,12,13], biological knowledge of the diseases [4,5,14], or patient gene expression profiles [15]. For instance, Gohet al. [4] build a disease network, which connects diseases that share at least one gene which when mutated is linked to both conditions. Leeet al. [5] construct a dis-ease network of metabolic disdis-eases, connecting pairs of disdis-eases for which associated mutated enzymes catalyze adjacent metabolic reactions. Hidalgoet al. [12] take a different approach by building a disease network based on disease co-morbidities, i.e. two diseases are connected if they tend to co-occur significantly in the patient populations. They used Medicare records of elderly patients to build the network. Heet al. [14] propose PCID (Predicting Comorbidity by Integrating Data), an approach to predict disease co-morbidities by aggregating disease similar-ity scores derived from different data including protein–protein interactions (PPIs), pathways, and functional annotations.
Sa´nchez-Valleet al. [15] define a disease network, named the Disease Molecular Similarity Network (DMSN) based on patient’s differential expression profiles. In their study, the DMSN is generated using positive and negative relative molecular similarities (RR) to measure disease similarity and dissimilarity, respectively, that is then interpreted as an estimate of risk. First, a patient-patient similarity network is generated based on the similarities of patient’s differential expression profiles. Next, using the relative similarity score, diseases are related to each other. The resulting network is directed and each edge is associated to a positive or negative label indicating either an increased or decreased risk of developing the target disease if the patient has the source disease. The underlying assumption is that having a given disease can increase the risk of developing a disease characterized by a similar gene expression profile.
In these various approaches, a key issue is that either a single data source is used, such as disease–gene mutational data [4], or no new biological knowledge about a specific disease could be derived from the results (e.g., PCID [14]).
In this work, we propose an integrative framework based on artificial neural networks (NN) to predict disease–disease links, as well as disease–pathway and disease–gene associations. We train the model to predict patients’ diagnoses based on differential gene expression. The NN’s structure is designed to mimic the cellular multi-scale functional organization by integrating gene–pathway annotations. This approach follows on from a body of work aiming to build neural networks based on prior information defining the structure of the network [16]. For instance, Maet al. [17] build a neural network using the Gene Ontology [18] directed acyclic graph as a template for the connections. The neural network, named DCell, is then trained to predict phenotype related to cellular fitness from genotype data. The trained DCell predicts cel-lular growth almost as accurately as laboratory observations.
We show that our framework achieves good predicting performances on our dataset. By analysing the trained NN, i.e. the underlying weight matrices, we show that we can extract biological knowledge relevant for each disease. Specifically, we use the trained NN to predict
result data are available online athttps://life.bsc.es/ iconbi/MultiScaleNN/index.html.
Funding: This work was supported by the
European Research Council (ERC) Consolidator Grant 770827, UCL Computer Science, the Slovenian Research Agency project J1-8155, the Serbian Ministry of Education and Science Project III44006, the Prostate Project, the Fondation Toulouse Cancer Sante and Pierre Fabre Research Institute as part of the Chair of Bio-Informatics in Oncology of the CRCT, PhD Fellowship (BES-2016-077403) and the Spanish Ministry of Economics and Competitiveness (BFU2015-71241-R)
Competing interests: The authors have declared
novel disease–pathway and disease–gene links and from those predictions we extract disease similarity score used to identify putative co-morbidities. We show that our predictions are biologically relevant against established ground-truths and verify the top predictions through manual literature curation ensuring that the sources do not use the same data, to mitigate the risk of argument circularity.
1 Material & methods
1.1 Datasets
We use the original dataset of patient gene expressions used by [15] in which each patient is associated to a single disease (seeS1 Filefor details). For each patient, we define a differential gene expression vector of size corresponding to the number of genes and in which theithentry is equal to 1,−1, or 0 depending on whether the ithgene is significantly (with 5% cut-off) over-, under-over-, or normally expressedover-, respectivelyover-, for that patient (seeS1 Filefor details).
Pathway annotations were collected from Reactome database [19] (accessed December 2018). Only the lowest pathways in the hierarchy are considered to avoid dealing with pathway interactions (i.e. pathways containing other pathways). Of those pathways, only the ones that have a Traceable Author Statement (TAS) are kept. In total, we consider 1, 708 pathway annotations.
The final dataset contains 4, 788 samples (patients) diagnosed by one of 83 diseases (see S1 Table inS1 Filefor cohort distribution). In total, 20, 525 genes have their expressions mea-sured, but only a subset is used as input to our method described in the following section, as we restrict ourselves to genes associated to at least one pathway, which leaves 9, 247 genes.
1.2 Neural network based data–integration framework
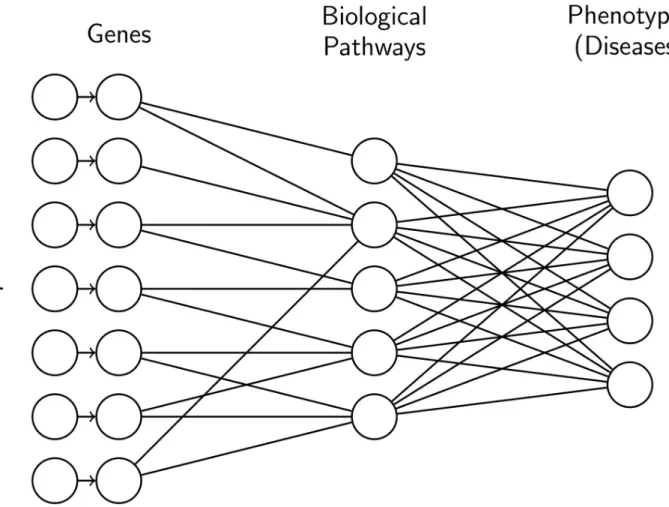
We propose a neural network (NN) predicting a patient diagnosis based on differential gene expression. The structure of the neural network is based on molecular organization, more specifically gene–pathway annotations downloaded from Reactome (seeFig 1). We integrate molecular organization data into our model to reflect the idea that complex diseases, such as cancer, can be the results of the perturbations of groups of genes, as opposed to a single gene. Using Reactome data allows us to incorporate prior knowledge into our model in the form of biologically meaningful groupings of genes.
A neural network can be expressed as a series of matrix multiplications interleaved with non-linear function (SeeS1 Filefor more details). Here, we use the softmax function [20] as the last non-linear function of the NN (common choice for multiclass classification problems) and the hyperbolic tangent non-linear function for hidden layers to allow a hidden unit to have values lying in [−1, 1] to represent up- and down-regulations. We use the classical cross-entropy function to define the loss function. Our neural network architecture has only one hidden layer capturing gene–pathway links. Hereafter, we refer to this model as GPD (for Gene–Pathway–Disease).
As reference model, we use a multiclass logistic regression (MLR; no hidden layer). MLR and GPD have a different number of parameters (or free weights): (573, 314) for MLR and (137, 838) for GPD. Note that, due to this imbalance, we do not expect GPD to outperform MLR in the diagnosis prediction task.
To train both GPD and MLR, we first perform a 10-fold cross-validation to fix the number of training epochs. To fix the number of training epochs, we compute the average number of epochs at which the test loss is the smallest across the runs (see S1 Fig and S2 Fig inS1 File). As the dataset is imbalanced, we use stratification to split the data, ensuring that at least one patient per disease is in the test set. Using this number of epochs, we perform another 10-fold
cross-validation to evaluate the performance of our models. We use the Adam optimizer [21] with learning rate 0.01 and the layer weights are initialized to small values using the initializa-tion process proposed by Heet al. [22]. We investigated the addition of classical regularisation techniques—L1, L2, and dropout regularisation—as a mean to reduce the capacity of the model to overfit. We found that the performances were better without any regularisations (see S2 Table inS1 File).
The neural networks are implemented with Tensorflow [23].
1.3 Predicting disease–disease, disease–pathway, and disease–gene
relationships
To identify associations between diseases and genes or pathways, we perform sensitivity analy-sis [24] (seeS1 File). The association score between diseased and unit u (representing a gene,
or a pathway) is measured by the intensity of the local variation of the output unit associated withd with respect to perturbation of u. Intuitively, this score measures how the prediction
score of diseased is affected by disregulation of a gene/pathway: we quantify the change in one
disease score induced by a disregulation in the gene expression, or pathway activation. We test this scoring approach for the prediction of disease–gene and disease–pathway associations. In particular, we rank disease–gene and disease–pathway pairs based on this score and test if the
Fig 1. Example of neural network architecture. For the first layer, the connections are defined by biological information, i.e. a unit representing a gene
is connected to all the biological pathways that the gene is involved in. We do not add any prior knowledge on the last layer, thus it is fully connected.
score correlates with known associations through a Precision-Recall and Receiver Operating Characteristic (ROC) analysis. Score thresholds could be inferred from the precision-recall curves. These thresholds would be uninformative in general since they are tied to specific runs and datasets. Hence, we focus on manual validation of the top scoring associations.
Based on this score, we represent each disease by a set formed by thekgeneshighest scoring
genes and a set containing thekpathwayshighest scoring pathways. We then score
disease–dis-ease associations using the Jaccard Index of their sets. The Jaccard Index of two setsS1andS2 is defined asjS1\S2j
jS1[S2j, where |�| represents the cardinality of a set. Following on from similar
approach used in DisGeNET [25], we interpret those associations as co–morbidities. The num-ber of highest scoring pathways and genes considered is set to 150 and 300, respectively, as those numbers gave the best results.
2 Results & discussion
2.1 Classification performances
To validate the relevance of our model, we verify that the classification performances are at least on par with competing methods: MLR, Random Forest (RF), Bernoulli Naive Bayes (nB), and Support Vector Machine (SVM) algorithms (we use the implementation available through the scikit-learning python package [26]). We perform 10-fold cross-validation for the algo-rithms to fix the hyperparameters (numbers of trees 100, smoothing parameter 0.001 and penalty parameter 100, respectively) and retain the best performing models in terms of cross-entropy loss (the objective function of the neural networks).
We evaluate performances by computing 3 different scores: cross-entropy loss (CEL), micro- and macro-average precision (Preμand PreM). Preμgive a measure of the overall
preci-sion of each classifier, while PreMgives an average of the precisions across the different classes
(diseases). The details of each score can be found inS1 File.
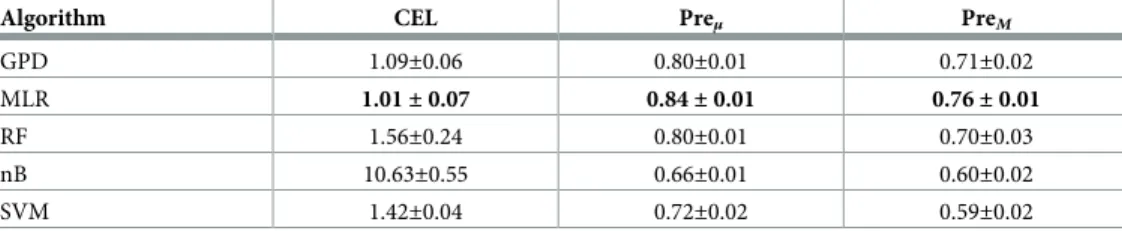
We observe that the neural networks; MLR and GPD, give better, or at least on-par, perfor-mances when compared to RF, nB, and SVM classifiers as measured by our three metrics (see
Table 1). This observation justifies the relevance of our GPD model. The best model appears to be the multinomial logistic regression (MLR), which corresponds to the most complex neural network model in terms of the number of parameters (or degree of freedom), since MLR has *4 times more parameters than GPD. This analysis shows that using biological knowledge to guide the structure of neural networks, in the limit of the models proposed, does not improve classification performance compared to the multiclass logistic regression (MLR) and only offers slight improvement when compared to a RF classifier (seeTable 1). However, we show, in the following Sections, that the trained GPD models can be more successfully exploited than MLR to extract biological information. Note as well that the gene–pathway information on
Table 1. Performances of different classifiers in terms of cross-entropy loss (CEL), micro- and macro-average pre-cisions (Preμand PreM, respectively). Each score is computed across the 10-fold cross-validation and we provide the
standard deviation. Bold scores highlight the best scores for each metric.
Algorithm CEL Preμ PreM
GPD 1.09±0.06 0.80±0.01 0.71±0.02 MLR 1.01± 0.07 0.84± 0.01 0.76± 0.01 RF 1.56±0.24 0.80±0.01 0.70±0.03 nB 10.63±0.55 0.66±0.01 0.60±0.02 SVM 1.42±0.04 0.72±0.02 0.59±0.02 https://doi.org/10.1371/journal.pone.0231059.t001
which GPD relies is both noisy and incomplete, as biological data often is, and that perfor-mances should improve as knowledge improves.
Hereafter, we consider for each model (GPD and MLR) the trained NN that gave the lowest cross-entropy loss during the 10-fold cross validation.
2.2 Our GPD model uncovers molecular mechanisms of diseases
To uncover molecular mechanisms of disease, i.e., genes and pathways that are associated to specific diseases, we extract predictions from MLR and GPD using the approach described in Section 1.3. We test the performance of our disease–pathway and disease–gene associations predictions by comparing against established databases. We investigate the top predictions of the GPD model through manual search of the literature.
Predicting disease–gene associations. For each model, we compute disease–gene
associa-tion scores as described in Secassocia-tion 1.3 and we test the validity of our predicassocia-tions against DisGe-NET database [25]. We compare the entire set of predictions against two baselines: the Frequency of Differential Expression (FDE) and the approach introduced by Zhaoet al. [8] for
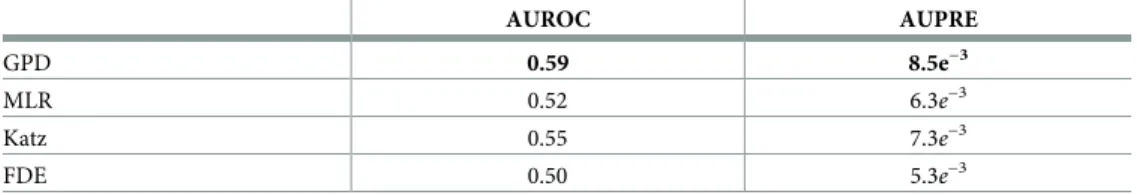
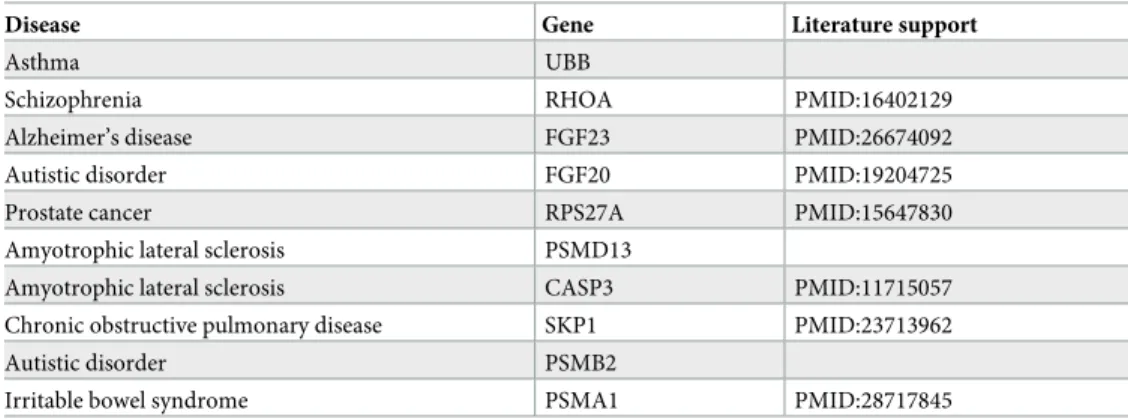
de novo disease–gene association prediction (Katz). Those methods are detailed in theS1 File. We use precision–recall and ROC curves to evaluate the performance of our approach and compute the areas under the curves (seeTable 2and S3 Fig and S4 Fig inS1 File). Interestingly, we observe that the FDE score is a poor predictor of disease–gene associations. We further observe that GPD is the best performing models for this task with Katz coming second. The relatively poor overall performances can be partially attributed to the incompleteness of the reported disease–gene associations in DisGeNET. To corroborate this hypothesis, we search the literature for support for the top 10 predicted disease–gene associations by the best per-forming model, GPD (seeTable 5). Note that none of those associations are reported in DisGeNET.
We are able to find literature support for 70% of the top 10 predicted disease–gene associa-tions (seeTable 3). Furthermore, we find indications that some of our top-scoring, non-validated predictions could be relevant, such as the associations of asthma with UBB and amyotrophic lateral sclerosis (ALS) with PSMD13. Ubuquitin B (UBB) belongs to the ubiquitin-proteasome (UPS) and it is known that aberration in the UPS is responsible for inflammatory and autoim-mune diseases such as asthma [27]. Moreover, ALS onsets occur typically after age 50 and mani-fest partially through muscle weakness. PSMD13 is linked to aging [28] and high expression of the gene has been found in skeletal muscle of athletes [29], suggesting that under-expression could be a sign of muscle weakness.
These results validate the relevance of our framework for de novo disease–gene association prediction and confirm the incompleteness of DisGeNET.
Predicting disease–pathway associations. For our GPD model, we compute disease–
pathway association scores as described in Section 1.3 and we test the validity of our predic-tions by comparison with CTD database [30]. As a baseline, we consider disease–pathway
Table 2. Performance in terms of area under the ROC (AUROC) and area under the precision–recall (AUPRE) for the prediction of disease–gene associations for each methods.
AUROC AUPRE GPD 0.59 8.5e−3 MLR 0.52 6.3e−3 Katz 0.55 7.3e−3 FDE 0.50 5.3e−3 https://doi.org/10.1371/journal.pone.0231059.t002
scores corresponding to the average FDE (AFDE) of genes within the pathway for patients having the disease.
We evaluate the results as done previously for disease–gene associations (seeTable 4and S5 Fig and S6 Fig inS1 File). We observe that GPD convincingly outperforms AFDE. The seem-ingly poor performances of both approaches can partially be attributed to the incompleteness of CTD database. To test this hypothesis, we search the literature for support for the top 10 dis-ease–pathway associations predicted with our GPD (seeTable 5). Note that none of these asso-ciations predicted are reported in CTD database.
We find literature support for 7 out of the top 10 predicted disease–pathway associations (seeTable 5). Furthermore, we find indications that some of our top-scoring, non-validated predictions could be relevant, such as the association of autistic disorder with the lactose syn-thesis pathway (5653890) and the association of Schizophrenia with pathway R-HSA-5683371 linked to microphtalmia. The lactose synthesis pathway (R-HSA-5653890) contains three genes: LALBA, SLC2A1, and B4GALT1. All of those genes might be associated with autis-tic disorders. One patented method to detect autisautis-tic disorder (US20140349977A1) includes LALBA as one of the genes of interest. SLC2A1 mutation has been reported in patients diag-nosed with autism [31]. And finally, B4GALT1 has been linked with developmental disorders [32]. The pathway R-HSA-5683371 is linked to the eye disease microphthalmia. It is known that schizophrenia is linked to eye abnormalities [33]. Among the 28 genes involved in that pathway, 12 have been linked to the disease in the literature (GOT2, PDHA1, DLD, GCSH, DLAT, PDHB, DAO, OGDH, DHTKD1, GNMT, DDO, PRODH2).
These results show the relevance of our framework for de novo disease–pathway associa-tions prediction despite relatively low retrieval scores against the ground–truth.
2.3 Our GPD model predicts disease–disease relationships
We rank disease–disease pairs based on the score described in Section 1.3 and test our results against a high confidence co-morbidity disease network obtained from a large cohort study by
Table 3. Top 10 disease–gene predicted by GPD.
Disease Gene Literature support
Asthma UBB
Schizophrenia RHOA PMID:16402129
Alzheimer’s disease FGF23 PMID:26674092 Autistic disorder FGF20 PMID:19204725
Prostate cancer RPS27A PMID:15647830
Amyotrophic lateral sclerosis PSMD13
Amyotrophic lateral sclerosis CASP3 PMID:11715057 Chronic obstructive pulmonary disease SKP1 PMID:23713962
Autistic disorder PSMB2
Irritable bowel syndrome PSMA1 PMID:28717845
https://doi.org/10.1371/journal.pone.0231059.t003
Table 4. Performance in terms of area under the ROC (AUROC) and area under the precision–recall (AUPRE) for the prediction of disease–pathway associations for each methods.
AUROC AUPRE
GPD 0.53 8e−2
AFDE 0.47 6e−2
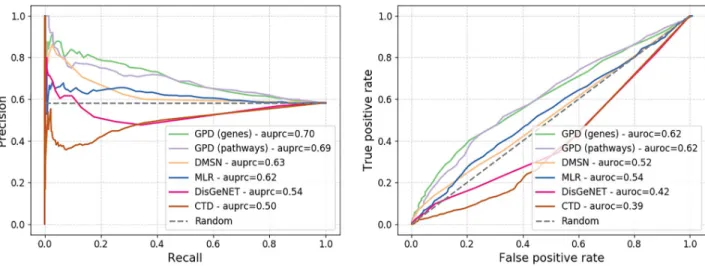
Hidalgoet al. [12]. We compare our method against DMSN network [15], restricted to our set of diseases, and three alternatives baselines. For the first alternative, we compute disease–dis-ease association score using our approach defined in Section 1.3 on the trained MLR network, representing each disease by the top 300 highest scoring genes (which gave the best results based on grid search). The final two baselines associate to each disease–disease pair a Jaccard Index score based on 1) the set of genes associated to each disease in DisGeNET [25] and 2) the set of pathways associated to each disease in CTD database [30]. The results of the compar-ison are presented using a precision–recall curve (seeFig 2).
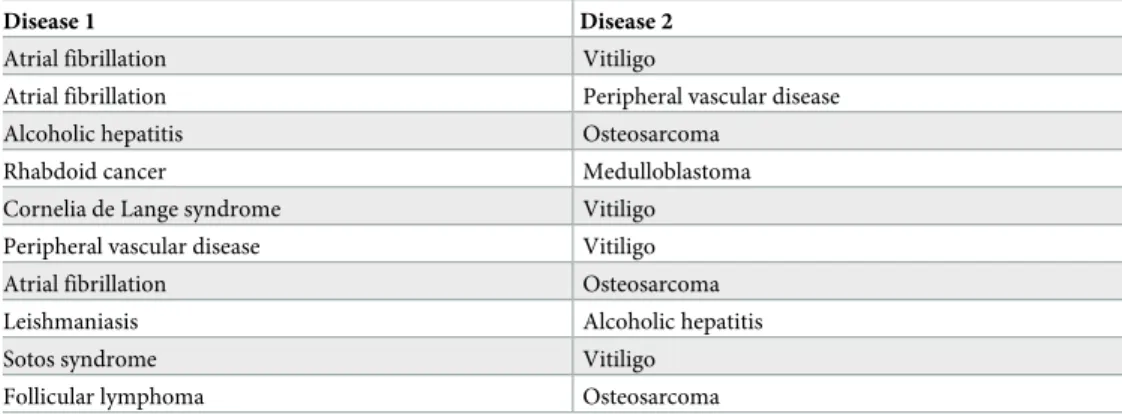
We observe that our approach outperform convincingly the other approaches in the task of retrieving existing co-morbidity links between diseases with over 10% increase compared to DMSN and 30% improvement over DisGeNET in terms of area under the precision–recall curve (auprc). These results strongly support our methodology. The scoring based on disease– gene is performing better than disease–pathway, hence we investigate the top 10 scoring dis-ease–disease associations derived from it (seeTable 6).
We present and discuss below literature support for the predicted associations between the diseases.
Table 5. Top 10 disease–pathway predictions derived from GPD.
Disease Pathway R-HSA- Literature support
Autistic disorder 5653890
Irritable bowel syndrome 532668 PMID:20338921 Irritable bowel syndrome 391906 PMID:16835707
Type 2 diabetes mellitus 499943 doi:10.2337/diabetes.51.2007.S363
Asthma 391906 PMID:8603274
Schizophrenia 71288 PMID:22465051
Major depressive disorder 8934903 PMID:27063986 Type 2 diabetes mellitus 8939245 PMID:19667185
Schizophrenia 5683371
Sjogren’s syndrome 389661
https://doi.org/10.1371/journal.pone.0231059.t005
Fig 2. Precision–recall (top) and ROC (bottom) curves of the test against the disease co-morbidity network built by Hidalgoet al. [12]. https://doi.org/10.1371/journal.pone.0231059.g002
Atrial fibrillation has been linked in the literature to thyroid disease [34] which is known to be co-morbid with vitiligo [35]. Atrial fibrillation and peripheral vascular disease are well known co-morbid conditions [36]. Alcoholism has been linked to the onset of some cancers notably implicating the transcription factor Nanog which itself has been linked to osteosar-coma [37]. Additionally, a drug used to treat alcoholism, Disulfiram, has recently been pro-posed as a potential treatment for osteosarcoma [38]. Those information put together suggest shared molecular background for the two conditions. Rhabdoid cancer is a rare form of aggressive cancer affecting young children and with very poor prognostic, which makes it diffi-cult to evaluate co-morbid conditions. However, rhabdoid cancer is frequently mistaken for medulloblastoma indicating some similarity [39]. We found no evidence in the literature sup-porting a connection between the rare Cornelia de Lange syndrome and Vitiligo. Some studies have observed significant co-morbidity between vitiligo and psoriasis and the combination of the two has been linked to cardiovascular diseases, which include peripheral vascular disease [35,40]. Atrial fibrillation and cardiac complications have been observed as the result of osteo-sarcoma [41,42]. Leishmaniasis and alcoholic hepatitis are an unlikely co-morbid connection since it would require a patient both to have been infected by parasites of the Leishmania type and have had excessive alcohol intake. However, both disease affects the liver and leishmania-sis has sometimes been misdiagnosed for cirrholeishmania-sis [43] which suggests that the two diseases might share some similar molecular processes that we would be capturing here. A case of co-occurence of Sotos syndrome and vitiligo has been reported in the medical literature [44]. It has been postulated that non-Hodgkin’s lymphoma (which include follicular lymphoma) and osteosarcoma share underlying mechanisms [45]. Additionally, miR-202 has been identified as a potential tumor suppressor for both conditions [46].
Through this analysis, we have shown that most predicted pairs have either been observed co-occurring or can be connected through underlying mechanisms, thus validating our approach.
3 Conclusions
In this study, we propose a multi-scale neural-network based framework that integrates gene expression data associated to diseases with gene–pathway information. Our integrative frame-work allows for simultaneously uncovering novel disease-disease associations and disease molecular mechanisms from patient gene expression profiles through the analysis of trained neural networks. We show that GPD achieve good diagnosis prediction on our dataset show-ing the validity of our integrative process. Furthermore, we show that the associations
Table 6. Top 10 disease–disease links predicted using our approach based on the trained GPD.
Disease 1 Disease 2
Atrial fibrillation Vitiligo
Atrial fibrillation Peripheral vascular disease Alcoholic hepatitis Osteosarcoma
Rhabdoid cancer Medulloblastoma Cornelia de Lange syndrome Vitiligo Peripheral vascular disease Vitiligo Atrial fibrillation Osteosarcoma Leishmaniasis Alcoholic hepatitis
Sotos syndrome Vitiligo
Follicular lymphoma Osteosarcoma
predicted from the trained models are biologically meaningful and supported by the literature, thus validating our approach.
While our disease molecular mechanisms are supported by the current knowledge about these diseases, a next step would be to identify among the predicted genes and pathways suit-able biomarkers and drug targets that could be used to improve diagnosis, prognosis, and treat-ment. We leave this for future work. Also, while our multi-scale NN framework integrates the hierarchical functional organization of a cell (from genes to biological pathways), our method-ology can be extended to include any dataset pertaining to diseases of interest, e.g., uncovering molecular mechanisms of cancer from patient somatic mutation profiles or linking diseases to non-coding RNA.
Finally, while we focus on patient data with application to diseases, our methodology can be extended to integrate additional omics data with the objective of getting more biologically accurate models for the analyses of patients, tissues, and cells. Some further applications include studies of diseases linked to a specific tissue, studies of cell’s specialization, and any study that can benefit from the integration of the hierarchical functional organization of cells.
Supporting information
S1 File. Supplementary methods, figures, and tables. Project webpagehttps://life.bsc.es/ iconbi/MultiScaleNN/index.html.
(PDF)
Author Contributions
Conceptualization: Thomas Gaudelet.
Data curation: Thomas Gaudelet, Jon Sa´nchez-Valle, Vera Pancaldi. Formal analysis: Thomas Gaudelet.
Funding acquisition: Alfonso Valencia, Natasˇa Przˇulj. Investigation: Thomas Gaudelet.
Methodology: Thomas Gaudelet, Noe¨l Malod-Dognin. Project administration: Natasˇa Przˇulj.
Software: Thomas Gaudelet.
Supervision: Noe¨l Malod-Dognin, Alfonso Valencia, Natasˇa Przˇulj. Validation: Thomas Gaudelet.
Visualization: Thomas Gaudelet.
Writing – original draft: Thomas Gaudelet.
Writing – review & editing: Noe¨l Malod-Dognin, Jon Sa´nchez-Valle, Vera Pancaldi, Alfonso
Valencia, Natasˇa Przˇulj.
References
1. Emilsson V, et al. Genetics of gene expression and its effect on disease. Nature. 2008; 452(7186):423.
https://doi.org/10.1038/nature06758PMID:18344981
2. Dudley JT, et al. Disease signatures are robust across tissues and experiments. Molecular Systems Biology. 2009; 5(1):307.https://doi.org/10.1038/msb.2009.66PMID:19756046
3. Jensen AB, et al. Temporal disease trajectories condensed from population-wide registry data covering 6.2 million patients. Nature Communications. 2014; 5:4022.https://doi.org/10.1038/ncomms5022
PMID:24959948
4. Goh KI, et al. The human disease network. Proceedings of the National Academy of Sciences. 2007; 104(21):8685–8690.https://doi.org/10.1073/pnas.0701361104
5. Lee DS, et al. The implications of human metabolic network topology for disease comorbidity. Proceed-ings of the National Academy of Sciences. 2008;.
6. Abeel T, et al. Robust biomarker identification for cancer diagnosis with ensemble feature selection methods. Bioinformatics. 2009; 26(3):392–398.https://doi.org/10.1093/bioinformatics/btp630PMID:
19942583
7. He Z, et al. Stable feature selection for biomarker discovery. Computational Biology and Chemistry. 2010; 34(4):215–225.https://doi.org/10.1016/j.compbiolchem.2010.07.002PMID:20702140
8. Zhao J, et al. Ranking candidate disease genes from gene expression and protein interaction: a Katz-centrality based approach. PLoS One. 2011; 6(9):e24306.https://doi.org/10.1371/journal.pone. 0024306PMID:21912686
9. Hong G, et al. Identifying disease-associated pathways in one-phenotype data based on reversal gene expression orderings. Scientific Reports. 2017; 7(1):1348.https://doi.org/10.1038/s41598-017-01536-3
PMID:28465555
10. Cogswell JP, et al. Identification of miRNA changes in Alzheimer’s disease brain and CSF yields puta-tive biomarkers and insights into disease pathways. Journal of Alzheimer’s Disease. 2008; 14(1):27– 41.https://doi.org/10.3233/jad-2008-14103PMID:18525125
11. Ciucci S, et al. Enlightening discriminative network functional modules behind Principal Component Analysis separation in differential-omic science studies Scientific Reports. 2017; 7(1):43946.https:// doi.org/10.1038/srep43946PMID:28287094
12. Hidalgo CA, et al. A dynamic network approach for the study of human phenotypes. PLoS Compu-tational Biology. 2009; 5(4):e1000353.https://doi.org/10.1371/journal.pcbi.1000353PMID:
19360091
13. Kannan V, et al. Conditional disease development extracted from longitudinal health care cohort data using layered network construction. Scientific Reports. 2016; 6:26170.https://doi.org/10.1038/ srep26170PMID:27211115
14. He F, et al. PCID: A novel approach for predicting disease comorbidity by integrating multi-scale data. IEEE/ACM Transactions on Computational Biology and Bioinformatics (TCBB). 2017; 14(3):678–686.
https://doi.org/10.1109/TCBB.2016.2550443
15. Sa´nchez-Valle J, et al. Unveiling the molecular basis of disease co-occurrence: towards personalized comorbidity profiles. bioRxiv. 2018.
16. Michael KY, et al. Visible Machine Learning for Biomedicine. Cell. 2018; 173(7):1562–1565.https://doi. org/10.1016/j.cell.2018.05.056
17. Ma J, et al. Using deep learning to model the hierarchical structure and function of a cell. Nature Meth-ods. 2018; 15(4):290.https://doi.org/10.1038/nmeth.4627PMID:29505029
18. Ashburner M, et al. Gene Ontology: tool for the unification of biology. Nature Genetics. 2000; 25(1):25.
https://doi.org/10.1038/75556PMID:10802651
19. Fabregat A, et al. The Reactome Pathway Knowledgebase. Nucleic Acids Research. 2018; 46(D1): D649–D655.https://doi.org/10.1093/nar/gkx1132PMID:29145629
20. Goodfellow I, et al. Deep learning. vol. 1. MIT Press Cambridge; 2016.
21. Kingma DP, et al. Adam: A method for stochastic optimization. arXiv preprint arXiv:14126980. 2014;.
22. He K, et al. Delving deep into rectifiers: Surpassing human-level performance on imagenet classifica-tion. In: Proceedings of the IEEE international Conference on Computer Vision; 2015. p. 1026–1034.
23. Abadi M, et al. TensorFlow: A System for Large-Scale Machine Learning. In: 12th USENIX Symposium on Operating Systems Design and Implementation (OSDI 16). Savannah, GA: USENIX Association; 2016. p. 265–283.
24. Zurada JM, et al. Sensitivity analysis for minimization of input data dimension for feedforward neural network. In: Proceedings of IEEE International Symposium on Circuits and Systems-ISCAS’94. vol. 6. IEEE; 1994. p. 447–450.
25. Piñero J, et al. DisGeNET: a comprehensive platform integrating information on human disease-associ-ated genes and variants. Nucleic Acids Research. 2017; 45(D1):D833–D839.https://doi.org/10.1093/ nar/gkw943PMID:27924018
26. Pedregosa F, et al. Scikit-learn: Machine Learning in Python. Journal of Machine Learning Research. 2011; 12:2825–2830.
27. Wang J, et al. The ubiquitin-proteasome system and its role in inflammatory and autoimmune diseases. Cellular and Molecular Immunology. 2006; 3(4):255–261. PMID:16978533
28. Bellizzi D, et al. Characterization of a bidirectional promoter shared between two human genes related to aging: SIRT3 and PSMD13. Genomics. 2007; 89(1):143–150.https://doi.org/10.1016/j.ygeno.2006. 09.004PMID:17059877
29. Koltai E, et al. Master athletes have higher miR-7, SIRT3 and SOD2 expression in skeletal muscle than age-matched sedentary controls. Redox Biology. 2018; 19:46–51.https://doi.org/10.1016/j.redox.2018. 07.022PMID:30107294
30. Davis AP, et al. The Comparative Toxicogenomics Database: update 2019. Nucleic Acids Research. 2018; p. gky868.
31. Hashimoto N, et al. SLC2A1 gene analysis of Japanese patients with glucose transporter 1 deficiency syndrome. Journal of Human Genetics. 2011; 56(12):846.https://doi.org/10.1038/jhg.2011.115PMID:
22011817
32. van der Zwaag B, et al. Gene-network analysis identifies susceptibility genes related to glycobiology in autism. PloS One. 2009; 4(5):e5324.https://doi.org/10.1371/journal.pone.0005324PMID:19492091
33. Torrey EF, et al. Schizophrenia and infections: the eyes have it. Schizophrenia Bulletin. 2017; 43 (2):247–252.https://doi.org/10.1093/schbul/sbw113PMID:27507268
34. Selmer C, et al. The spectrum of thyroid disease and risk of new onset atrial fibrillation: a large popula-tion cohort study. British Medical Journal. 2012; 345:e7895.https://doi.org/10.1136/bmj.e7895PMID:
23186910
35. Dahir AM, et al. Comorbidities in vitiligo: comprehensive review. International Journal of Fermatology. 2018; 57(10):1157–1164.https://doi.org/10.1111/ijd.14055
36. Proietti M, et al. Adverse outcomes in patients with atrial fibrillation and peripheral arterial disease: a report from the EURObservational research programme pilot survey on atrial fibrillation. Ep Europace. 2016; 19(9):1439–1448.https://doi.org/10.1093/europace/euw169
37. Machida K, et al. Cancer stem cells generated by alcohol, diabetes, and hepatitis C virus. Journal of Gastroenterology and Hepatology. 2012; 27:19–22.https://doi.org/10.1111/j.1440-1746.2011.07010.x
PMID:22320911
38. Crasto JA, et al. Disulfiram reduces metastatic osteosarcoma tumor burden in an immunocompetent Balb/c or-thotopic mouse model. Oncotarget. 2018; 9(53):30163.https://doi.org/10.18632/oncotarget. 25733PMID:30046395
39. Burger PC, et al. Atypical teratoid/rhabdoid tumor of the central nervous system: a highly malignant tumor of infancy and childhood frequently mistaken for medulloblastoma: a Pediatric Oncology Group study. The American Journal of Surgical Pathology. 1998; 22(9):1083–1092.https://doi.org/10.1097/ 00000478-199809000-00007PMID:9737241
40. Arunachalam M, et al. Non-segmental vitiligo and psoriasis comorbidity–a case-control study in Italian patients. Journal of the European Academy of Dermatology and Venereology. 2014; 28(4):433–437.
https://doi.org/10.1111/jdv.12117PMID:23441884
41. Sogabe O, et al. Right ventricular failure due to primary right ventricle osteosarcoma. General Thoracic and Cardiovascular Surgery. 2007; 55(1):19–22.https://doi.org/10.1007/s11748-006-0053-yPMID:
17444167
42. Dohi T, et al. Primary right atrial cardiac osteosarcoma with congestive heart failure. European Journal of Cardio-Thoracic Surgery. 2009; 35(3):544–546.https://doi.org/10.1016/j.ejcts.2008.12.009PMID:
19167234
43. Giannitrapani L, et al. Progressive visceral leishmaniasis misdiagnosed as cirrhosis of the liver: a case report. Journal of Medical Case Reports. 2009; 3(1):7265.https://doi.org/10.4076/1752-1947-3-7265
PMID:19830157
44. Dahlqvist P, et al. Pseudoacromegaly: a differential diagnostic problem for acromegaly with a genetic solution. Journal of the Endocrine Society. 2017; 1(8):1104–1109. https://doi.org/10.1210/js.2017-00164PMID:29264563
45. Makis A, et al. Osteosarcoma as a second tumor after treatment for primary non-Hodgkin’s lymphoma in a child with ataxia-telangiectasia: presentation of a case and review of possible pathogenetic mecha-nisms. Journal of Pediatric Hematology/Oncology. 2004; 26(7):444–446.https://doi.org/10.1097/ 00043426-200407000-00009PMID:15218420
46. Sun Z, et al. miR-202 suppresses proliferation and induces apoptosis of osteosarcoma cells by downre-gulating Gli2. Molecular and Cellular Biochemistry. 2014; 397(1-2):277–283.https://doi.org/10.1007/ s11010-014-2195-zPMID:25156120