DEVELOPING METRICS FOR CONCURRENT ENGINEERING AT RAYTHEON COMPANY'S SURFACE RADAR GROUP
by
Catherine Anne Coles Tedesco
Bachelor of Science in Naval Architecture and Marine Engineering, Webb Institute of Naval Architecture 1994 Submitted to the Department of Ocean Engineering and the Sloan School of Management in partial
fulfillment of the requirements for the degrees of
Master of Science in Ocean Systems Management and Master of Science in Management In conjunction with the Leaders for Manufacturing Program at the
Massachusetts Institute of Technology June, 2001
@ 2001 Massachusetts Institute of Technology. All rights reserved.
Signature of Author
Department of Ocean Engineering Sloan School of Management May, 2001 Certified by
4
4
V Professor Henry S. Marcus, Thesis Advisor Chairman, Ocean Systems Management Program Department of Ocean Engineering Certified byC"Senior Lecturer Don sen , Thesis Advisor Director, Fellows , Leaders for Manufacturing
Sloan School of Management Accepted by
Professor Henrik Schmidt Chairman, Depen ental Committee on Graduate Studies Depar)r;nt of Ocean Engineering Accepted by
aigaret kndrews, birector of Master's Program Sloan School of Management MASSACHUSETTS INSTITUTE
OF TECHNOLOGY
MITLibraries
Document Services
Room 14-0551 77 Massachusetts Avenue Cambridge, MA 02139 Ph: 617.253.2800 Email: [email protected] http:/Iibraries.mit.edu/docsDISCLAIMER OF QUALITY
Due to the
condition of the original material, there are unavoidable
flaws in this reproduction. We have made every effort possible to
provide you with the best copy available. If you are dissatisfied with
this product and find it unusable, please contact Document Services as
soon as possible.
Thank you.
The images contained in this document are of
the best quality available.
DEVELOPING METRICS FOR CONCURRENT ENGINEERING AT RAYTHEON COMPANY'S SURFACE RADAR GROUP
by
Catherine Anne Coles Tedesco
Submitted to the Department of Ocean Engineering and the Sloan School of Management on May 2, 2001 in partial fulfillment of the requirements for the degrees of
Master of Science in Ocean Systems Management and
Master of Science in Management
ABSTRACT
Although many commercial companies introduced concurrent engineering into their development process in the early 1990s, many defense contractors did not venture into this terrain until later in the decade. The nature of defense contractors' complex products and
lengthy design cycles introduces additional challenges into the collaborative engineering process. One challenge faced by Raytheon's Surface Radar Group was the identification and
development of relevant, consistent, metrics to measure the effectiveness of their evolving concurrent engineering process. Metrics need to be readily, quickly, and regularly measured. They need to encourage value-added activities from process participants, and provide insight into the actions that are necessary to improve individual processes.
This thesis describes how Raytheon's Surface Radar Group identified and developed
concurrent engineering effectiveness metrics, and how these metrics are being used to support the goals of their concurrent engineering initiative.
Keywords: Concurrent Engineering, Metrics, Effectiveness Thesis Supervisors:
Professor Henry S. Marcus, Department of Ocean Engineering Senior Lecturer Donald B. Rosenfield, Sloan School of Management Jason Elwood, Raytheon Company
Edward Verryt, Raytheon Company Roger Hinman, Raytheon Company
ACKNOWLEDGEMENTS
The author wishes to acknowledge the Leaders for Manufacturing Program at MITfor its support of this work.
In addition, I would like to thank my thesis advisors, Professors Marcus and Rosenfield for their patience and advice.
I would also like to thank the many people at Raytheon whose support and dedication made this project a success.
Finally, I would like to thank my husband, Matt, for his loving support throughout this process.
TABLE OF CONTENTS
Chapter 1: Introduction and Overview ... 10
1.1 Project Description ... 10
1.2 Project Goals... 10
Chapter 2: Project Setting and Background ... 12
2.1 The Need for Concurrent Engineering M etrics ... 12
2.2 Related Theory and Methods of Concurrent Engineering and Metrics ... 12
2.3 Sum m ary... 16
Chapter 3: Research M ethodology ... 18
3.1 Project Scope ... 18
3.2 Process Description... 18
3.3 Sum m ary... 21
Chapter 4: Identification and Prioritization of G oals... 22
4.1 Identification of Goals ... 22
4.2 Prioritization of Goals... 25
4.2.1 Structure of Customer Survey... 25
4.2.2 Prioritization Results from Survey... 25
4.3 Sum m ary ... 31
Chapter 5: Identification of Ideal Processes ... 32
5.1 Identification of Ideal Supporting Processes ... 32
5.2 The Form ation of the Ideal Processes M atrix... 32
5.3 Sum m ary... 33
Chapter 6: Analysis of Current Practices ... 34
6.1 Perform ance Results from Survey ... 34
6.2 Actual Processes in the Ideal Processes M atrix... 34
TABLE OF CONTENTS
Chapter 7: Developing a Set of CE M etrics ... 36
7.1 Overview of the CE M etrics System ... 36
7.2 Overall Self Evaluation M etrics - The Ideal Processes M atrix... 38
7.3 Continuous Improvement and CE Support M etrics... 38
7.3.1 Team Member Preparedness Metrics... 38
7.3.2 Product Development Engineering (PDE) Organization Performance Metrics ... 43
7.3.3 Engineering Organization Performance Metrics ... 49
7.3.4 Production Organization Performance Metrics ... 51
7.4 Program Specific M etrics ... 54
7.4.1 Proposal Team Performance Metrics... 54
7.4.2 Program Management Performance Metrics ... 57
7.4.3 IPT Performance Metrics ... 60
7.4.3.1 General IPT Performance Metrics...60
7.4.3.2 PCA T Based IPT Performance Metrics... 65
7.4.3.3 ADAP Based IPT Performance Metrics ... 66
7.5 OPM Summ aries... 72
7.6 M etrics Reporting Structure... 73
7.7 Summ ary... 75
Chapter 8: Im plem entation ... 76
8.1 Phases of Implementation... 76
8.2 Transition Plan... 76
8.3 Summary... 76
Chapter 9: Conclusions and Recom mendations... 79
9.1 Conclusions and Recommendations ... 79
Appendix A : Ideal Processes M atrix ... 82
Appendix B: Performance Survey Results by Program and Overall... 100
Appendix C: Team M ember Preparedness M etric ... 107
Appendix D: PDE Organization Performance M etrics... 111
Appendix E: Engineering Organization Performance M etrics ... 115
Appendix F: Production Organization Performance M etrics ... 118
Appendix G: Proposal Team Performance M etrics ... 121
Appendix H: Program M anagement Performance M etrics ... 126
Appendix I: IPT Performance M etrics... 132
Appendix J: PCAT Based IPT Performance M etrics ... 141
Appendix K: ADAP Based IPT ROM Estimating Format and Graphical Performance M etrics ... 143
Appendix L: OPM Summ aries ... 151
Appendix M : M atrix of Co-Sponsors ... 161
Chapter 1: Introduction and Overview
This chapter presents the problem that this thesis addresses and a brief description of the project. It explains why the project is important to Raytheon's surface radar group at this point in time. It also describes the formal goals of the project and how the project has accomplished the stated goals.
1.1 Project Description
Raytheon's surface radar group has been actively trying to incorporate concurrent engineering (CE) practices into surface radar programs for the past two years. A system of metrics is required to evaluate the success of the CE processes. It is also necessary to evaluate the current processes with respect to best practices. The project outlines a set of ideal processes to support Raytheon's goals for concurrent engineering within the surface radar group and compares these processes to those currently in use. A system of metrics that can be used to measure the success of the CE process is identified. Finally, this research assists in the implementation of the CE metrics system.
1.2 Project Goals
Raytheon's management set three goals for the metrics project:
" Identify and implement a system of metrics to evaluate the success of the concurrent engineering (CE) process utilized by Raytheon on Surface Radar Projects.
" Provide additional information on best practices in CE to Raytheon's Surface Radar Management.
" Document the CE process, identify value-added sub-processes, and identify where the process can be improved.
The project has accomplished these goals. The listing of ideal supporting processes will provide insight into how other companies have overcome these challenges. The comparison with current supporting processes will identify gaps in the current processes that need to be
addressed. The comprehensive metrics system will provide Raytheon's management with the tools required to measure the success of the concurrent engineering process and to improve this process over time. In addition, the system of metrics will provide Raytheon's
management with feedback regarding the extent to which a design is meeting targets (such as cost) during the design process so that the design can be improved, rather than after it is built when the window of opportunity for improvement has already passed.
Chapter 2: Project Setting and Background
This chapter describes the importance of the CE metrics project in the context of Raytheon's surface radar group's current growth programs. It also provides an overview of findings from the extensive literature search. This literature search was used to examine the theory and methods that were relevant to the CE metrics project.
2.1 The Need for Concurrent Engineering Metrics
Raytheon's surface radar group is currently working on the design of seven new surface radars. While all of these radars have different functions and exterior appearances, they all are made up of the same basic assemblies and use the same basic technology. These similarities magnify the opportunities for improving the designs in terms of cost, quality, and schedule
adherence. The challenge is to ensure that both program specific and general support structures exist to encourage the full application of Concurrent Engineering (CE) concepts throughout the design process. To that end, a set of metrics was developed to provide feedback regarding the success of the CE process in Raytheon's surface radar group. The radars considered in this project are identified in Table 2.1-1.
2.2 Related Theory and Methods of Concurrent Engineering and Metrics
Concurrent Engineering was first defined in 1988 by the Institute for Defense Analysis as "a systematic approach to the integrated, concurrent design of products and their related
processes, including manufacturing and support. This approach is intended to cause developers, from the outset, to consider all elements of the product life cycle from concept through disposal, including quality control, cost, scheduling, and user requirements" [SOCE, 2000]. CE takes advantage of the fact that 70-80% of the cost of a product is determined by activities that take place during the conceptual design phase [Flint and Gaylor, 1995, pg. 99]. It stands to reason that with most of the costs fixed in early design phases, the most significant benefits can be gained by improving the methods used during this phase.
Table 2.1-1: Raytheon Surface Radar Group Products
Theatre High Altitude Area Defense (THAAD)* Portable * Ground-based
Joint Land Elevated Netted Sensor (JLENS) * Portable
* Tethered Aerostat
X-band Radar (XBR) * Fixed
" Ground-based
Upgraded Early Warning Radar (UEWR) * Fixed (existing)
* Ground-based
Dual band radar family:
Surface Craft Radar - surveillance and control (SPY-3) " Fixed
* Shipboard
Volume Surveillance Radar (VSR) " Fixed
" Shipboard
High Powered Discriminator (HPD) " Fixed
Companies have many different motivations for introducing concurrent engineering practices into their companies. For high-tech consumer product companies speed to market is one of the main reasons for its introduction while other slower "clockspeed" [Fine, 2000] industries are more interested in other issues like lower product costs. This is not to say that the two are mutually exclusive. General Dynamics space system division stated three goals for their CE process "shorter development cycles, continuous quality improvement, and cost reduction" [Kewley and Knodle, 1993, pg. 34]. In addition to shortening speed to market, cost reduction and continuous quality improvement, other common goals for CE include "reducing
engineering changes, shortening development time, increasing return on assets", [Landeghem, 2000, pg. 296] developing a product that more closely meets customer needs, increasing market share, improved serviceability, increased product performance, longer product life, reduced product cost and so on [Maylor and Gosling, 1998, pg. 72]. Based on the wide variety of goals associated with concurrent engineering, it is clear that each company should select goals for its concurrent engineering process based on its own business environment and company culture.
Early practitioners of CE were frustrated by the lack of relevant material on implementation [Kewley and Knodle, 1993, pg. 34]. Happily that problem has been solved over the past five years. There are numerous books and articles on implementation tactics. Some of the most
comprehensive include Concurrent Engineering: What's Working Where edited by Christopher Backhouse and Naomi Brooks [Backhouse (ed.) and Brookes (ed.), 1996], Concurrent Engineering - The Agenda for Success edited by Sa'ad Medhat [Medhat (ed.), 1997] and Successful Implementation of Concurrent Engineering Products and Processes edited by Sammy Shina [Shina (ed.), 1994]. While these and other references do not necessarily agree on the best techniques or address all of the same techniques for implementing concurrent engineering, there are some common threads in their recommendations. Some of these common threads are as follows.
All implementation techniques recommend the use of a cross-functional teams [Pillai, Lal and Rao, 1997, pg. 717] although they differ on the importance of collocation for team
3036]. Most implementation techniques recommend additional involvement of suppliers in product development and including the supplier on the cross-functional team [Prasad, 1999],
formal evaluation process for supplier feedback and criteria for reducing the number of suppliers of a given product [BMP, 1990, pg. 6]. Many methods recommend using product cost as means of trading off design decisions [Kroll, 1992, pg. 282 and Belson and Nickelson,
1992, pg. 443]. Finally a prevailing theme is high profile upper and middle management support for the concurrent engineering process [Tummala, Chin and Ho, 1997, pg. 277].
Another recent and widespread theme in implementing concurrent engineering is the importance of including metrics as part of the implementation process. One author goes so far as to say that "if a team member cannot measure what he or she is talking about, and is not able to express it in a quantitative or qualitative term, the team knows nothing about it" [Prasad, 1997, pg. 288]. In their paper "Performance Measurement for Product Design and Development in a Manufacturing Environment," Pawar and Driva describe what they refer to
as " the Principles of Performance Measurement" [Pawar and Driva, 1999]. A key aspect of these principles is the need for metrics to provide both "macro-visibility" defined as being
"directly related to strategic goals to gain top management support and to ensure high visibility of results", and "micro-visibility" defined as having high-visibility "within the team" to "ensure that everyone knows what is happening" [Pawar and Driva, 1999, pg. 66]. Unfortunately many metrics proposed by experts in concurrent engineering provide only one
of these dimensions. Some of the more high level and loosely related metrics include items such as number of projects completed divided by number of projects started as a measure of job satisfaction, and incremental profit divided by project cost as a measure of return on
investment [Shina, 1991, pgs 116-117]. While these metrics might be relevant to top level managers, they are not likely to be personally relevant to an individual team member. Other metrics extensively address one aspect of CE without devoting adequate attention to other issues, yielding an incomplete picture of performance. For example, one paper discusses organizational structure and seating arrangements in great detail but provides little insight into the other aspects of CE [Kusiak and Belhe, 1992]. Another theorizes that metrics should be developed through a detailed failure modes analysis for a given process (in this case creating aluminum extrusions) [Subramaniam and Ulrich, 1998]. While this method is likely to be
very relevant to the individuals involved in the process in question, it is less likely to be meaningful to top managers.
The final and perhaps most pervasive breakdown in most of the systems of CE metrics is that the proposed metrics all measure the end results from a given project. Even those that emphasize the importance of developing metrics that are relevant throughout the design process provide little guidance on how to begin [Hight, Hornberger and Last, 1995, pg. 498]. One of the most popular metrics for concurrent engineering is the measurement of
engineering changes or design defects [Rook and Medhat, 1996, pg. 6]. This is typical of a "reactive" metric that is measuring the existence of an undesirable event after it has already occurred. The objective should be to identify the processes that could have prevented the undesirable event from occurring, and measure those processes to ensure that they are effective. This is the intent of "process-oriented concurrency metrics" (POCMs) [Goldense, 1994]. These metrics include items such as core-team turnover [Goldense, 1994, pg. 28]. Another important category of metric is the predictive metric. The "as designed vs. as proposed" (ADAP) cost comparisons developed during this project and presented later in this thesis are a typical example.
Predictive metrics focus on estimating the end result (cost in this case) based on the best available knowledge of the design team at any given time. This estimate is repeated regularly (in this case for every design change or every two weeks whichever is longer) to provide an ongoing evaluation of the project's status with respect to the project goal.
2.3 Summary
This chapter discussed the significant potential for leveraging design improvements across the complete product line of surface radars. It explained the importance of concurrent
engineering metrics in achieving these design improvements. Finally, it provided an
overview of existing literature on concurrent engineering and concurrent engineering metrics. The development of the concurrent engineering metrics system was based on the observations above. A Raytheon specific set of goals for concurrent engineering was developed. The set of ideal processes was identified based on relevant literature to support these goals. Metrics
were designed to be relevant at a low level and be easily summarized to be relevant at a high level (e.g. cost of an assembly which is relevant to a team member rolls up to cost of a product which is relevant to top management). Finally all metrics were designed to be either directly predictive (like ADAP) or process-oriented (like core-team turnover). Chapter Three describes the research methodology used in this project in greater detail.
Chapter 3: Research Methodology
This chapter describes the scope of the concurrent engineering metrics project and provides a detailed description of the process that was used to complete the project. How project goals were accomplished by implementing the process is explained.
3.1 Project Scope
While the project was completed within the bounds of the Surface Radar product line, it is intended to be useful in a general context. The deliverables of the project could easily be modified for use in other areas of Raytheon and other corporations. The project takes a systems view of the design process and focuses on concurrent engineering related to assemblies rather than components. The project motivation was a desire to measure the success of the concurrent engineering process and to continue to improve it.
3.2 Process Description
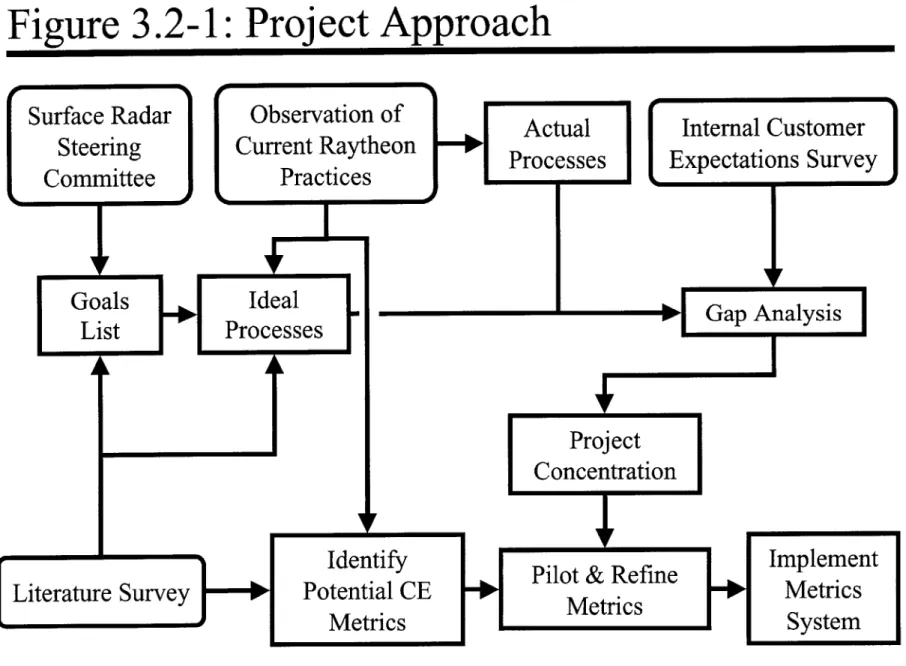
As illustrated in Figure 3.2-1, the following process was used to accomplish the project goals:
1. Identify the goals of Raytheon's surface radar group's concurrent engineering process. " Based on input from Raytheon's surface radar management team.
* Aligned with Raytheon's Integrated Product Development System (IPDS).
2. Identify an ideal set of processes to support the concurrent engineering process goals. " Based on an extensive literature search for best practices in concurrent engineering. " Considering Raytheon's company culture.
3. Compare Raytheon's current concurrent engineering practices with the ideal processes. * Based on observation of current practices & interviews.
Figure 3.2-1: Project Approach
Goals
Ideal
Lst
Processe
H
I
Project
Concentration
I
Actual
Processes
I
UInternal Customer
Expectations Survey
M.-______________aH
Gap Analysis
I
IILZ
Pilot & Refine
Metrics
I
Implement
Metrics
System
Surface Radar
Steering
Committee
Observation of
Current Raytheon
Practices
I
___________________________I
Literature Survey
Identify
Potential CE
Metrics
h.- -A4. Identify internal customers of the concurrent engineering process and their expectations. " Identified approximately 60 customers in several categories (e.g. Program
management, PDEs).
" Surveyed them on relative importance of concurrent engineering goals and perceived performance against those goals.
5. Prioritize implementation of metrics project.
* Based on gaps identified in customer survey and comparison of current CE processes to ideal supporting processes.
6. Create comprehensive set of CE metrics. " Based on ideal supporting processes.
" Based on successful metrics and guidelines for successful metrics identified in literature search.
7. Create a phased implementation plan.
* Based on guidance from Raytheon's surface radar management team. " Based on priorities from the customer survey.
8. Assist in implementation.
0 Following phased implementation plan.
The author served as an individual actor facilitating the metrics development process. Although there was no formal team created to develop the metrics system, it was essential to obtain input and 'buy-in' from the people within Raytheon who would be using the metrics system after the research was concluded. Therefore a series of ad hoc groups were formed on a voluntary basis to address specific issues throughout the life of the project. These groups formed and disbanded throughout the project under the general oversight of the surface radar management team. This core group was made up of representatives of program management,
operations, and engineering who became involved with the project during the first month of the project.
3.3 Summary
This chapter described the formal project scope. It also indicated the applicability of the concurrent engineering metrics project to other design processes both internal and external to Raytheon. Finally, it described the process that was used to accomplish the goals of the CE metrics project. Chapters that follow will describe each of the process steps in greater detail. Chapter Four describes the process that was used to identify and prioritize Raytheon's surface radar group's goals for the concurrent engineering process.
Chapter 4: Identification and Prioritization of Goals
This chapter describes the process that was used to identify the goals of the concurrent engineering process and the process that was used to prioritize the goals once they were identified. The results of the survey used to prioritize the goals are discussed.
4.1 Identification of Goals
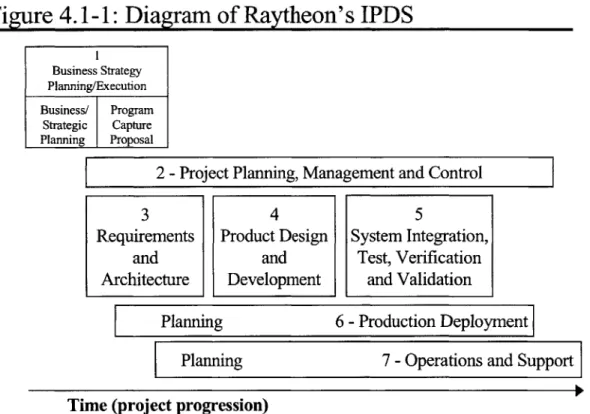
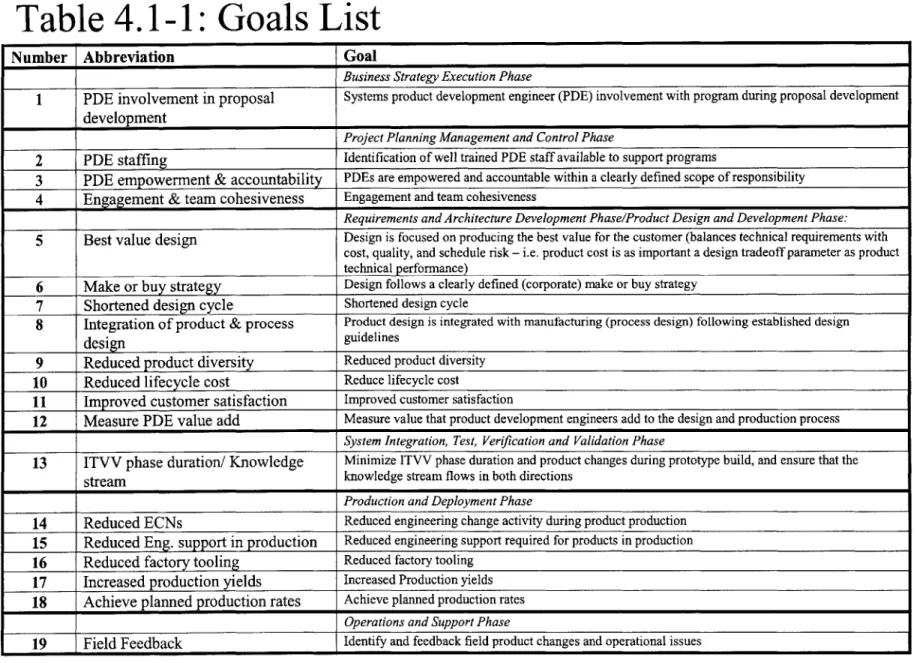
Raytheon's surface radar management team identified 19 goals for the concurrent engineering process. The identification of these goals was an iterative process including representatives from program management, operations, and engineering. The first round was based on a listing of typical goals for concurrent engineering processes, which was gleaned from the literature search. Subsequent rounds were based on input from all of the representatives until everyone agreed that the list was complete. The list was structured to align with Raytheon's Integrated Product Development System (IPDS) by mapping the goals to the seven phases of IPDS. IPDS is a master template that outlines standard processes and procedures from initial "program capture" activities throughout the program lifecycle. The seven phases are as follows:
* Business Strategy Execution Phase
* Covers activities related to strategic business planning, program capture and proposals.
* Project Planning Management and Control Phase
* Covers activities related to program management throughout the life of the program. e Requirements and Architecture Development Phase
0 Covers activities related to conceptual design. * Product Design and Development Phase
0 Covers activities related to detailed product design. * System Integration, Test, Verification and Validation Phase
0 Covers activities related to pre-production testing and proof of design documentation. * Production and Deployment Phase
0 Covers activities related to the planning and execution of full-scale production. * Operations and Support Phase
* Covers activities related to the planning and execution of final operation and field support.
A diagram of IPDS is presented in Figure 4.1-1. The final list of goals is the cornerstone of both the evaluation of Raytheon's current concurrent engineering (CE) practices in surface radars and the CE metrics system. A complete listing of the goals including reference numbers is presented in Table 4. 1 -1.
Figure 4.1-1: Diagram of Raytheon's IPDS
Business StrategyPlanning/Execution Business/ Program
Strategic Capture Planning Proposal
2 - Project Planning, Management and Control
3
4
5
Requirements Product Design System Integration,
and and Test, Verification
Architecture Development and Validation
Planning 6 - Production Deployment
Planning 7 - Operations and Support
Time (project progression)
Table 4.1-1: Goals List
Number Abbreviation Goal
Business Strategy Execution Phase
1 PDE involvement in proposal Systems product development engineer (PDE) involvement with program during proposal development development
Project Planning Management and Control Phase
2 PDE staffing Identification of well trained PDE staff available to support programs
3 PDE empowerment & accountability PDEs are empowered and accountable within a clearly defined scope of responsibility 4 Engagement & team cohesiveness Engagement and team cohesiveness
Requirements and Architecture Development Phase/Product Design and Development Phase:
5 Best value design Design is focused on producing the best value for the customer (balances technical requirements with cost, quality, and schedule risk - i.e. product cost is as important a design tradeoff parameter as product technical performance)
6 Make or buy strategy Design follows a clearly defined (corporate) make or buy strategy
7 Shortened design cycle Shortened design cycle
8 Integration of product & process Product design is integrated with manufacturing (process design) following established design
design guidelines
9 Reduced product diversity Reduced product diversity
10 Reduced lifecycle cost Reduce lifecycle cost
11 Improved customer satisfaction Improved customer satisfaction
12 Measure PDE value add Measure value that product development engineers add to the design and production process System Integration, Test, Verification and Validation Phase
13 ITVV phase duration/ Knowledge Minimize ITVV phase duration and product changes during prototype build, and ensure that the
stream knowledge stream flows in both directions
Production and Deployment Phase
14 Reduced ECNs Reduced engineering change activity during product production
15 Reduced Eng. support in production Reduced engineering support required for products in production
16 Reduced factory tooling Reduced factory tooling
17 Increased production yields Increased Production yields
18 Achieve planned production rates Achieve planned production rates
Operations and Support Phase
4.2 Prioritization of Goals
4.2.1 Structure of Customer Survey
An internal customer survey was conducted in order to accomplish the following objectives: * Prioritize the goals of the concurrent engineering process.
* Baseline the current concurrent engineering process with respect to the stated goals. * Identify gaps in the perceived importance of concurrent engineering goals between
participants in the process.
* Determine the concentration of the metrics project.
The survey was sent out to approximately 60 internal customers of the metrics project and approximately 40% of the surveys were returned. The survey consisted of three main questions:
* Rate the importance of the 19 goals by allocating 1,000 points between them'. * Rate the success of each of the surface radar programs at achieving each of the goals. * Rate the most successful instance for each program on a scale of 1 - 5.
4.2.2 Prioritization Results from Survey
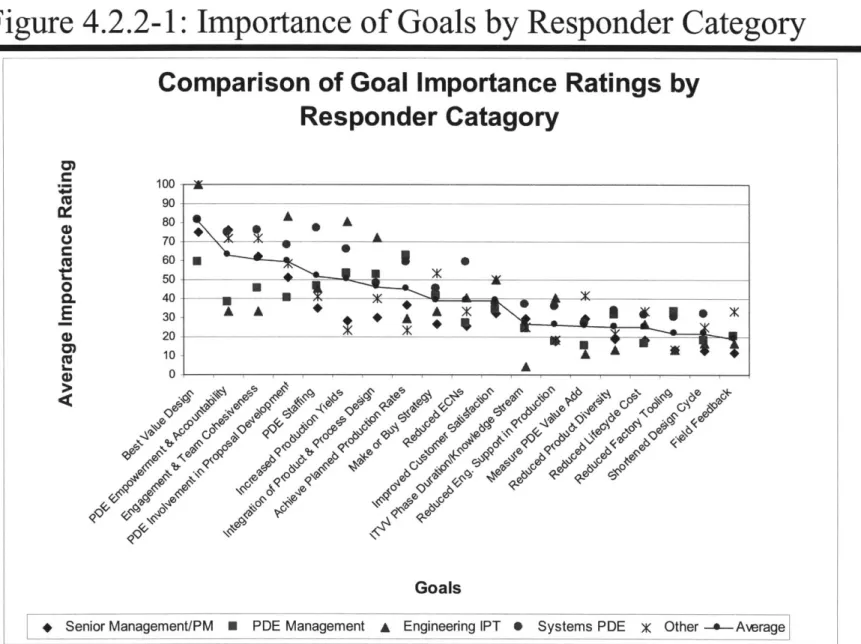
There were some significant discrepancies in the perceived importance of goals. Even within respondent categories the standard deviation of the importance ratings was significant. The spread of responses from different respondent groups increased with the more important goals. However, in most cases the groupings of more important goals vs. less important goals were consistent between respondent groups. Some of the more interesting results are as follows:
* Everyone agreed that creating a "Best Value Design" was one of the most, if not the most, important goal of the CE process.
* "PDE Empowerment and Accountability" and "Engagement and Team Cohesiveness" were both ranked as very important by Senior Management/Program Management, Systems PDEs and Others, but were ranked relatively low by Engineering IPT Leads and PDE Management (about a 40/100 point spread).
* "PDE Involvement in Proposal Development" was ranked very high by Engineering IPT Leads and relatively low by PDE Management.
" Systems PDEs placed higher than normal rankings on "PDE Staffing" and "Reduced ECNs".
* Engineering IPT Leads ranked "Increasing Production Yields" and "Integration of Product & Process Design" higher than normal and "ITVV Phase Duration/Knowledge Stream" lower than normal.
* Senior Management/Program Management and Others had lower than normal rankings of "Increased Production Yields".
A graph comparing the goal importance ratings by responder category is presented in Figure 4.2.2-1.
Figure 4.2.2-1: Importance of Goals by Responder Category
Comparison of Goal Importance Ratings by
Responder Catagory
100 --90 80 70 60 50 40 30 20 10 nIt
0 C.E
0Goals
\0q -4 e 0~
eP 0 0 QSOF' j A A A X 4F X w A AThe survey also generated a number of comments. These comments demonstrate that widely different perspectives existed at the outset of the project. In general the comments served to identify potential fears and roadblocks to change that would need to be addressed during the project. These comments have been divided into seven categories and are presented as follows.
General Comments:
- The [CE] process has a lot of merit. - The PDEs are a talented group.
- CE seems to be implemented for the sake of being able to point to it.
- Presently the CE function seems overly bureaucratic, very inefficient, and only marginally effective.
- Every item that comes into Andover should go through a "Value Stream Baseline" evaluation.
- Do not treat people like a commodity - people respond better and work harder and smarter if they are part of a high performance culture (this must be established in both engineering and the factory but more so in the factories).
These concerns are addressed by the introduction of a concurrent engineering metrics system. The CE metrics system measures the impact of the CE process in key areas such as cost,
quality and schedule adherence. This measurement will help focus the new product development process on performance to specific targets and the effectiveness of current product development processes in meeting those targets.
Organizational Structure:
- Interaction between COE, subassembly, and system PDEs needs to be streamlined. There is not enough communication between the different organizations. This interaction should be a given.
- PDEs are grouped around end items (e.g. BSG), but designers are grouped around programs [tend to focus only on their program].
- Since PDEs report to Andover, they are not free to express that something should be built outside.
- Process for supporting and collaborating with engineering, ILS, and PMO needs to be simplified.
- CE meetings should take place between facilities [Andover and Sudbury] on a 50/50
basis (Andover always has to go to Sudbury).
These comments reflect some rivalry between Raytheon locations with Andover as the primary manufacturing site and Sudbury as the primary engineering site. The CE metrics system focuses on team metrics rather than metrics by location in order to encourage common goals.
Programmatic Differences:
- Some programs take the PDE role more seriously than others do.
- Inclusion of PDEs/CE processes varies from program to program and appears to be totally at the discretion of the program office.
By measuring and improving the CE process, the introduction of the CE metrics system means value of the CE process will be readily quantifiable. In addition, formalizing the review structure (described further in section 7.6) provides a high level of visibility for the CE process.
Engagement:
- The amount of engagement [of PDEs] varies within programs.
- There remains a mindset in the design and PDE community that PDEs are engaged only when drawings are available for sign-off.
- Earlier PDE engagement on programs is required.
The metrics cover all phases of the design process. As such, it will be readily obvious at a high level in the organization if the recommended process are not being used.
Accountability/Empowerment:
- PDEs do not have the power to change things in the factory to meet the needs of new programs.
- Expanded accountability will enhance value and warrant increased levels of empowerment/contribution.
- The design community needs to be held accountable for achieving CE goals and should be measured accordingly to aid the process.
Team measurements incorporated in the CE metrics system hold all team members accountable for reaching program goals. Departmental metrics hold department managers responsible for supporting the CE process on an ongoing basis.
Quantifying the Value of the CE Process:
- Much more focus needs to be given to value provided by the [CE] efforts expended (i.e. deploy based on justifiable benefit instead of rote practice).
- We are staffing the PDE function but what are we really getting, where is the focus? - The impact of PDE involvement is under-appreciated by management due to a lack of
quantifiable metrics (i.e. hours and dollars avoided).
The CE metrics system lends focus to the CE process. The formal reporting structure ensures that all levels of management will be aware of the impact of the CE process.
Training/Information Dissemination:
- PDE goals & objectives need to be defined in a written format with appropriate training tools (i.e. PCATs, DFMA, etc.).
- The purpose and responsibilities of PDEs are vastly under publicized to management and the design communities.
- Design guidelines for CE should be created by the PDEs, approved by production, and made available on the intranet for use by the design community.
- There should be no such thing as professional PDEs - PDEs need to revolve in/out of the manufacturing floor at least once a year to keep their skills current.
These concerns were addressed by establishing training criteria for key participants in the CE process. Metrics to measure compliance with these criteria and other suggestions on this list were included in the CE metrics system.
The focus areas of the metrics project recommended by the results of the internal customer survey area are as follows:
Primaryfoci:
* "Best Value Design"
* "PDE Empowerment and Accountability" * "Engagement and Team Cohesiveness" * "PDE Involvement in Proposal Development" Secondary foci:
* "Increased Production Yields"
* "Integration of Product and Process Design" * "Achieve Planned Production Rates"
* "PDE staffing"
4.3 Summary
This chapter explained the process that was used to develop a Raytheon-specific list of goals for the concurrent engineering process. It also described the format of the customer survey that was used to prioritize the goals. Finally, it presented the groupings of goals that were
identified as critical by the survey respondents. Chapter Five describes the process that was used to identify the ideal processes for supporting these goals.
Chapter 5: Identification of Ideal Processes
This chapter describes the process that was used to identify the ideal supporting process for each of the CE goals and how these processes were structured to form the first portion of the Ideal Processes Matrix.
5.1 Identification of Ideal Supporting Processes
The listing of ideal support processes is intended to identify critical concurrent engineering practices that are required to fully support each goal in the context of Raytheon's company culture and operating methods. As such, the listing of ideal support processes presented in this thesis should be evaluated within the context of each company and tailored accordingly prior to any application. The ideal supporting processes were derived from successful methods identified during an extensive literature search as well as successful methods
observed by the author. The listing of ideal processes also went through an extensive iterative review similar to the goals list. This was critical, not only to ensure that the proposed support structure for the goals'was as robust as possible, but to obtain 'buy-in' from the project's customers that the listing actually reflected an "ideal" state.
5.2 The Formation of the Ideal Processes Matrix
Like the goals list, the ideal processes matrix is divided up by the phases of IPDS. Since many of the goals for the requirements and architecture phase and the product design and development phase were the same, these goals have been combined into one section. The goals and their respective ideal supporting processes are divided up by phase. This forms the first two columns of the Ideal Processes Matrix. The complete Ideal Processes Matrix is presented in Appendix A. Starting with the ideal processes rather than the actual processes helped prevent mental 'anchoring' to the current processes. It also created an accepted set of criteria against which the actual processes could be evaluated. Index numbers, the method used for numerical evaluation of actual processes, are described in section 6.2.
5.3
Summary
This chapter discussed the methods that were used to identify the ideal supporting processes for the CE goals. It also discussed how they were used to create the first portion of the Ideal Processes Matrix. Finally, it explained the importance of starting with the ideal processes rather than the actual processes. Chapter Six describes the analysis of actual practices.
Chapter 6: Analysis of Current Practices
This chapter describes the two methods that were used to analyze Raytheon's surface radar group's concurrent engineering processes. The results of the internal customer survey provide customers perceptions of the performance of the concurrent engineering process. The
comparison of actual process to ideal process in the framework of the Ideal Processes Matrix provides feedback regarding current practices.
6.1 Performance Results from Survey
As stated in section 4.2.1, the survey that was used to prioritize the CE goals was also used to measure the perceived performance against those goals. Perceived performance varied from program to program with Program A and Program B receiving CE performance ratings up to 60 and 50 respectively and Program E receiving a CE performance rating of approximately 30 on the same goal. The CE process generally appeared to be performing better on the more important goals; however, this trend was only a strong one on Program A and Program B. The graphs in Appendix B show the scores for each of the programs.2
Respondent responses were converted to a 100-point index (i.e. ideally all performance scores would be 100). The goals are listed on the graphs in descending order of importance based on the survey results. In general, performance was aligned with importance in that performance against more important processes was better than or equal to performance against less important processes.
6.2 Actual Processes in the Ideal Processes Matrix
The actual processes were added to the Ideal Processes Matrix and mapped one-to-one against the ideal supporting processes. This actual (or current) processes listing is comprised of brief
descriptions of how Raytheon's current processes for new product development in surface radars are aligned with the ideal support processes. It is based on interviews with Raytheon personnel and personal observation and was reviewed by many of the managers involved in the concurrent engineering process. Each process was assigned a corresponding index
2 Program F & Program G did not receive enough responses to provide significant program specific analysis.
The responses for these programs are included in the overall performance graph. Overall performance was an average of the performance of all programs.
number. An index number is a subjective rating of the compliance of current support processes with their respective ideal support processes. The rating is essentially a five level scale with 100 possible points (i.e. possible ratings are 20, 40, 60, 80, or 100). The ratings also translate into red/yellow/green ratings of each process to enhance the visual management potential of the matrix 3. A rating of 100 (world class/green) indicates a process that is
matched with the ideal and typically implemented. A rating of 80 (established/green)
indicates a process that largely matches the ideal and is typically implemented. A rating of 60 (defined system/yellow) indicates a process that partially matches the ideal and may not always be implemented. A rating of 40 (ad hoc/red) indicates a process that is inconsistent in nature and application. A rating of 20 (not performed/red) indicates that a process is non-existent.
The index numbers are also used to evaluate the compliance with ideal processes at a goal level. This rough evaluation is established by averaging the index numbers for each support process related to a given goal. This index number is listed in the goal column and is also color-coded for quick inspection. While this method inherently assumes an equal importance weighting for all of the support processes, it is useful in the context of a general overview.
6.3 Summary
This chapter described the perceived performance results from the internal customer survey. It also described the documentation of actual processes with respect to ideal processes. Finally, it described the rating system that was used to provide a rough comparison of the ideal processes to the current processes. Chapter Seven describes the set of CE metrics that was developed based on the CE goals and ideal supporting processes.
3 The color-coding is not shown in the appendix due to MIT thesis formatting standards, but was a key part of the management tool.
Chapter 7: Developing a Set of CE Metrics
This chapter will describe the complete set of CE metrics that was developed for this project. Unless otherwise noted, the selection of metrics and proposed presentation of metrics are direct results of this research. It will also explain how they interrelate to provide feedback to all levels of the organization. Finally, it will describe the reporting structure that was
developed to ensure that data collected is presented at the appropriate levels of the organization.
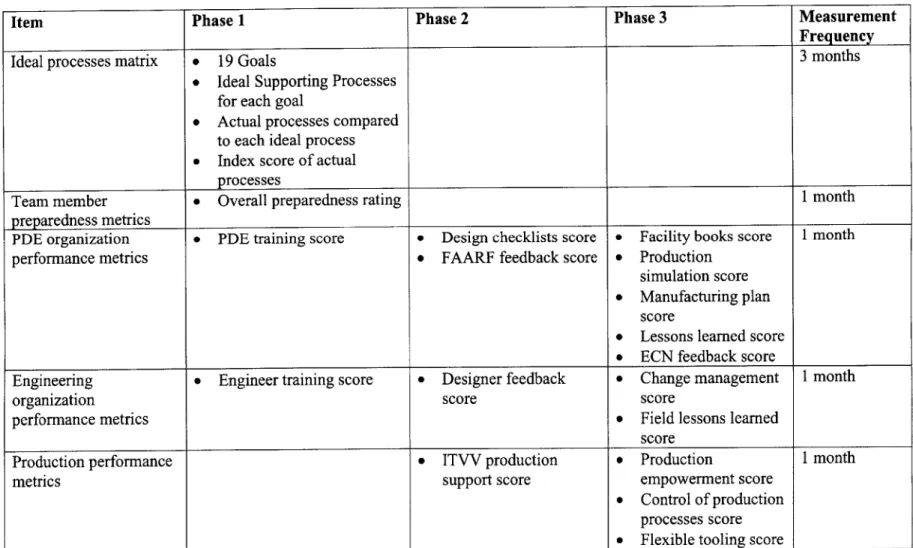
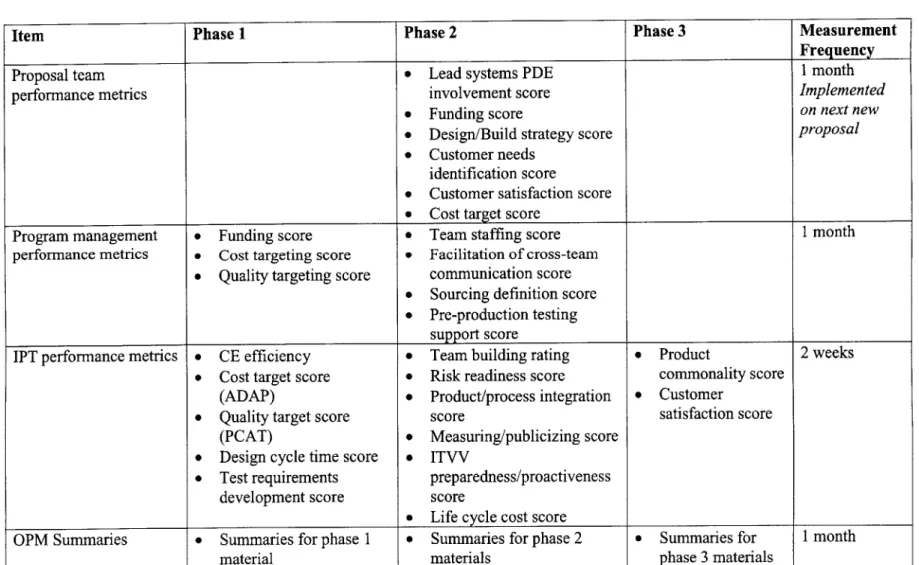
7.1 Overview of the CE Metrics System
The CE metrics system is made up of three main categories. The first category, overall self-evaluation metrics, consists of the measures included in the Ideal Processes Matrix. The
second category, continuous improvement and CE support metrics, consists of the Team Member Preparedness Metrics, the Product Development Engineering (PDE) Organization Performance Metrics, Engineering Organization Performance Metrics, and Production Organization Performance Metrics. The third category, program specific performance metrics, consists of Proposal Team Performance Metrics, Program Management Performance Metrics, and Integrated Product Team (IPT) Performance Metrics. Program specific
performance metrics are at a team level rather than a department level to help break down departmental barriers and encourage teamwork [BMP, 1992, pg. 5]. The continuous
improvement and CE support metrics and the program specific performance metrics are designed to roll up into Oregon Productivity Matrices (OPMs) for summary, tracking, and goal setting purposes. OPMs were developed by the Oregon Productivity Center at Oregon State University in 1986 [Viken, 1995] and are described in more detail in section 7.5. A diagram illustrating the concurrent engineering metrics system is presented in Figure 7.1-1. Raytheon management is responsible for determining the target values for each metric based on their strategic goals and current performance. The calculations presented in this thesis were created for demonstration purposes.
Figure 7.1-1: Diagram of the CE Metrics System
*Increases visibility
*Streamlines goal setting
*Tracks progress
*Measures success
*Establishes common goals
-Encourages cooperation
'Measures quality of program sp
structure for CE
*Encourages early focus on CE
OPM
1Cost Focus
Summaries
Quality Focus
ADAP
IPT Performance
PCAT
Metrics
ecific support
Program Management
Performance Metrics
Proposal Team Performance Metrics
*Measures quality of CE support
structure
'Establishes personal goals
Engineering
Org. Performance
Metrics
PDE Organization
Performance Metrics
Ta
Team Member Preparedness Metrics
Production
Performance
Metrics
s system level self
n
Ideal Processes Matrix
'Oregon Productivity Matrix
'Provide
7.2 Overall Self-Evaluation Metrics - The Ideal Processes Matrix
The ideal processes matrix consists of four components. The first component is the goal column. This is made up of the 19 goals described earlier in Table 4 1 -1 divided by IPDS phase. The second component is the list of ideal supporting processes. The third component
is the current support processes. The fourth component is the index number. The index numbers are also used to evaluate the compliance with ideal processes at a goal level.
The ideal processes matrix serves as a guide for the further development of the concurrent engineering process. It identifies not only where the concurrent engineering process should be, but also the locations of the biggest performance gaps. The ideal processes matrix created
for this project is included in Appendix A.
7.3 Continuous Improvement and CE Support Metrics 7.3.1 Team Member Preparedness Metrics
Team member preparedness metrics are divided into three major categories. The first category of team member preparedness metrics is team skills. The development of these skills is intended to support the goal of increasing engagement of CE processes (and PDEs) and team cohesiveness. This category consists of:
* General team training * Team leader training * Facilitator training * A 360-degree evaluation
" Communication for personality types training * A personal Myers-Briggs evaluation
In the self-managed team environment core team members need to have not only basic team skills but also the more advanced skills of team leader and facilitator. This enables all the team members to step in and keep the team on target throughout the design process. Accessible team members are only expected to participate in general team training so that they are familiar with working in a team environment. The 360-degree evaluation, communication for personality types training, and personal Myers-Briggs evaluation are
intended to make each team member aware of their own work styles as well as the work styles of their teammates so that they can modify their own behavior to best achieve the team
objectives. This training is recommended for all team members.
The second category is CE skills. The development of these skills is intended to support the goal of having well trained staff to support programs. This in turn is divided up into four categories. The first, general CE skills, includes:
* Program management training * Leadership5 training
* Negotiation/conflict resolution training
* Cost as an independent variable (CAIV)7 training (i.e. design to cost (DTC) training) * As designed vs. as proposed (ADAP)8 training
* Design for manufacture and assembly (DFMA)9 training * Voice of the customer (VOC)'0 training
* Quality function deployment (QFD)1 training * Communication for managers12 training * Risk management' 3 training
* Six sigma training (awareness' 4 and specialist'5)
4 Includes conceptions such as identifying tasks, identifying goals, scheduling, and tracking program progress against a schedule.
5 Includes concepts such as identifying your own leadership style, situation based leadership, listening, and
articulating a vision.
6 Includes concepts such as negotiation tactics, identifying the priorities of all parties, and how to use this
information to maximize value for all parties.
7 Includes conceptions such as setting cost goals, deploying these goals to a team level, and tracking team erformance to cost goals.
Described in section 7.4.3.3.
9 Includes concepts such as part reduction, assembly friendly features and identifying critical vs. flexible tolerances.
10 Includes concepts such as asking open-ended questions, listening, identifying latent needs, and collecting and analyzing customer needs based on interviews and observation.
" A technique to translate customer needs into key performance metrics.
12 Includes concepts such as presentation skills and writing skills.
13 Includes concepts such as the different types of risks and techniques for identifying, tracking, and neutralizing
them.
14 This is a basic introduction to the concepts of Raytheon six sigma including concepts such as the purpose of
the process, success stories, and an overview of common techniques.
" Includes concepts such as statistical process control (SPC) and provides practice through the use of simple cases in enough depth that people would be ready to solve simple problems on their own.
Program management training is recommended for all members of the core team in order to aid in their self-management. Leadership training, communication for managers training, and negotiation/conflict resolution training is recommended for the product development
engineers (PDEs) only. Traditionally technical criteria have dominated the design, with cost reduction, quality improvement, and manufacturability considered secondary. The PDEs are
involved in the design processes to advocate these traditionally disadvantaged design characteristics and are therefore in need of extra training in the leadership, communication, and negotiation/conflict resolution fields. CAIV training, ADAP training, risk management training, and DFMA training are recommended for all team members (core and accessible)
since all team members will be expected to participate in the cost reduction, risk mitigation, and design improvement efforts. VOC training and QFD training are recommended for all core team members since these skills are essential in determining customer requirements. This training is recommended only for the core team since this is the most likely group to be involved in VOC and QFD activity. Six-sigma training (awareness and specialist) is
recommended only for the PDEs since they will likely be leading any process improvement initiatives within the team. PDEs also need these skills since they are included in the team as the advocates of designing in quality and production yields.
The second category of CE skills is software training. This includes: * Process capability analysis tool (PCAT) training (introduction and user) * Pro-Engineer (Pro-E) basic training
* Pro-Process training (a module of Pro-E) * Product view training
* Mentor graphics overview training
* Integrated product development system (IPDS) training (overview and tailoring) * Microsoft Visio training
* Microsoft Project training * Risk Manager training * DOE/KISS training
* Geometric dimensioning and tolerancing training
*
PRACS training
* Power builder standards training
PCAT training and power builder standards training are recommended for PDEs since PCAT is used to determine the standard labor hours (of some components) and the designed quality (of most components) inherent in a design. Power builder is used to determine the standard labor hours in designs (assemblies) and provide a defect opportunity count. This information can then be used by the PDEs to identify cost and quality drivers and provide this information the other members of the design team, so that the team can work on improving these
measures. The E (design package for all systems except circuit cards) basic training, Pro-process (module that creates manufacturing plans/work instructions from the Pro-E database) training, Product view (viewer for Pro-E database intended for the casual user) training, and Mentor graphics (CAD package for circuit cards) overview training are all recommended for PDEs, so that they can view engineering information during creation and prototype
development. IPDS overview training is recommended for all team members to ensure that they understand the product development processes presented as Raytheon's standard. IPDS tailoring training is recommended for PDEs, since some of them will be participating in tailoring sessions with program management, and all of them will need to understand how this process affects their scope of work. Microsoft Visio is recommended for the PDEs as a means of documenting their processes assumptions and sketching out ideas. Microsoft Project training is recommended for all team members, so that it can be used a means of communicating status throughout the team and to their customers. Risk manager (software supporting risk management) training is recommended for the PDEs, so that they can track the risks that their team has identified. DOE/KISS (design of experiments software package) training is recommended for all core team members, so that they can use it to optimize their experimentation throughout the design process. Geometric dimensioning and tolerancing training is also recommended for all core team members, so that they can interact successfully with the metal fabrication design documentation. PRACS (production release and control
The third category of CE skills is basic problem solving training. This includes: * Brainstorming
* Root cause analysis * Pareto charts * Flowcharting
* Statistical process control
Basic problem solving training is recommended for all team members so that it can be fully integrated into the team processes.
The fourth category of CE skills is independent study in CE or Engineering field. This includes:
* Attending conferences, meetings, and workshops presented by the Society of Concurrent Engineering (SOCE)
" Attending conferences, meetings, and workshops presented by relevant engineering societies (e.g. the American Society of Mechanical Engineers)
" Reading relevant books and journals recommended by the Raytheon Multidiscipline Resource Center (MRC) library or their supervisor
SOCE conferences and relevant books and journals are recommended for all team members. The engineering society conferences are recommended for the core team, the accessible team members would typically be involved in other societies closer to their core disciplines.
The third category of team member preparedness metrics is production experience.
Developing skills in this area is intended to increase the integration of product and process design as well as reduce engineering support in production through improved designs. It is also intended to encourage PDEs to rotate back out into production. This segment includes: * Workcenter capability training
* Production work experience
0 Hands-on build weeks in production
Workcenter capability training is a general overview of the capabilities of Raytheon's workcenters. This overview is recommended for all team members. Production work
experience and full-time rotations into production are recommended for the PDEs. Since they are included on the design team to represent manufacturing, it is critical that they have
credibility in this area and that their skills remain fresh. Hands-on build weeks in each of the major production areas are recommended for all core team members. This production contact will provide all team members with a systems view of production and a greater appreciation of the impact of their design work.
Different recommendations are made for the training of PDEs, other core team members, and accessible team members. Additionally, the importance of each training item is weighted relative to the other training items for each type of personnel. Team members can then score themselves against the appropriate standard using a binary scale. Their overall score is reached by multiplying their binary scores against the item weightings given for their function and dividing this sum by the total possible score for their function. A sample team member preparedness evaluation is presented in Appendix C.
7.3.2 Product Development Engineering (PDE) Organization Performance Metrics PDE Organization performance metrics are comprised of two major categories. The first category of PDE Organization performance metrics is PDE training. This supports the goal of providing well-trained PDEs to support programs. This metric is designed to measure the
quality of PDEs that are being provided to support the IPTs and the consistency of this
quality. It consists of a table of PDEs and their team member preparedness scores from which the average training score and the standard deviation of the training scores are calculated.
The second category of PDE Organization performance metrics measures performance related to the creation of CE tools. It includes:
" Facility books " Design checklists
* Production simulation tools " Standard manufacturing plans * Lessons learned documentation
* An engineering change notice (ECN) cause and impact database * A first article assembly review form (FAARF) database
The facility books score is based on a listing of all major production areas and a binary score indicating whether or not they have a current facility book. The development of facility books is intended to support the goals of integrating product and process design and reducing factory tooling at the equipment level. The number of current facility books is divided by the total number of desired facility books to create the facility books score. A facility book is considered current if has been updated within a six-month period. A typical facility book would include, but is not limited to:
* A map of the area indicating the location of all equipment
* A brief plain language description of each piece of equipment and its function(s) * A sketch of the piece of equipment
* A possible range of operation for each piece of equipment * A preferred range of operation for each piece of equipment
* An explanation of why the preferred range of operation differs from the possible range * An explanation of the consequences of exceeding the preferred range of operation (e.g.
quantify the reduction in yield)
The design checklist score consists of three categories: tooling checklists, design guideline checklists, and error rates for design details. All of these metrics are calculated by dividing the number of current checklists by the number of desired checklists. A checklist is
considered current if it has been updated within a six-month period. Tooling checklists are intended to support the goal of reducing factory tooling. A typical tooling checklist would include, but is not limited to:
* A listing of currently available tooling and fixturing by function and equipment 0 A brief description of each tool's/fixture's function