HAL Id: hal-02185685
https://hal.laas.fr/hal-02185685
Submitted on 16 Jul 2019HAL is a multi-disciplinary open access archive for the deposit and dissemination of sci-entific research documents, whether they are pub-lished or not. The documents may come from teaching and research institutions in France or abroad, or from public or private research centers.
L’archive ouverte pluridisciplinaire HAL, est destinée au dépôt et à la diffusion de documents scientifiques de niveau recherche, publiés ou non, émanant des établissements d’enseignement et de recherche français ou étrangers, des laboratoires publics ou privés.
High stability of ultra-small and isolated gold
nanoparticles in metal–organic framework materials
Jérémy Cure, Eric Mattson, Kévin Cocq, Hala Assi, Stephanie Jensen, Kui
Tan, Massimo Catalano, Shuai Yuan, Hao Wang, Liang Feng, et al.
To cite this version:
Jérémy Cure, Eric Mattson, Kévin Cocq, Hala Assi, Stephanie Jensen, et al.. High stability of ultra-small and isolated gold nanoparticles in metal–organic framework materials. Journal of Materials Chemistry A, Royal Society of Chemistry, 2019, pp.17536-17546. �10.1039/c8ta12334a�. �hal-02185685�
1
High Stability of Ultra-small and Isolated Gold Nanoparticles in
Metal-Organic Framework Materials
Jérémy Cure1,2, Eric Mattson1, Kévin Cocq3, Hala Assi3, Stephanie Jensen4, Kui Tan1, Massimo Catalano1,5, Shuai Yuan6, Hao Wang7, Liang Feng6, Peng Zhang6, Sunah Kwon1, Jean-François Veyan1, Yasiel Cabrera1, Guoyu Zhang7, Jing Li7, Moon Kim1, Hong-Cai Zhou6,8, YvesJ. Chabal1,*, and Timo Thonhauser4,*
1
Department of Materials Science and Engineering, University of Texas at Dallas, Richardson, TX (USA)
2
LAAS-CNRS, University of Toulouse, 7 avenue du Colonel Roche, 31031 Toulouse, France
3
LCC-CNRS, University of Toulouse, 205 route de Narbonne, 31077 Toulouse, France
4
Department of Physics and Center for Functional Materials, Wake Forest University, Winston-Salem, NC (USA)
5
Istituto Microelettronica e Microsistemi del Consiglio Nazionale delle Ricerche, Via Monteroni, 73100 Lecce, Italy
6
Department of Chemistry, Texas A&M University, College Station, TX (USA)
7
Department of Chemistry and Chemical Biology, Rutgers University, Piscataway, NJ (USA)
8
Department of Materials Sciences and Engineering, Texas A&M University, College Station, TX (USA)
Keywords
Metal-organic framework (MOF), ultra-small gold nanoparticles, Au NPs, localization, nanoparticle stability, HER.
Abstract
Gold nanoparticles (NPs) exhibit optical, catalytic, and physical properties that are scientifically fascinating and essential for many applications. However, the challenge is to synthesize and disperse ultra-small and highly stable NPs. We demonstrate here that isolated and ultra-small (~1 nm) Au NPs can be synthesized by photo-reduction of HAuCl4 inside
2
thiol-functionalized MOFs, including MIL-101 (Cr) and a novel class of MOFs, MOF-808-SH. A combination of physical, imaging, spectroscopic measurements, and ab initio calculations confirms that the Au NPs are dispersed inside the bulk of the MOFs and demonstrate that the thiol group is critical to stabilize the Au NPs deeply inside individual pores which overcomes the major issue of external nucleation on the outer surfaces. The thiol-functionalized MOFs thus fulfill a dual purpose: they foster the nucleation of the Au NP and also provide confinement and a framework that keeps the NPs separate. Moreover, the stability of NPs is tested by a series of wet chemical processes (transmetalation) and photocatalytic water reduction. Spectroscopic and TEM studies of the system after these chemical tests show that the Au NPs are remarkably stable (<1.5% diameter change/hour), even under harsh aqueous and irradiation environments, necessary for catalytic applications.
Introduction
Gold nanoparticles (NPs), in contrast to standard metal NPs, have generated much interest due to their unique physico-chemical properties such as conductivity,1 localized surface plasmon resonance (LSPR),2 stability towards oxidation,3 biocompatibility,4 and catalytic activity.5 Since the pioneering work of Haruta,5 several studies have demonstrated the capacity of gold NPs (<5 nm) to catalyze a large range of chemical reactions like the aerobic oxidation of alcohols or the oxidation of CO into CO2.5
There are several methods to synthesize Au NPs, all requiring stabilizing ligands.6, 7 The central issue is to prepare ultra-small Au NPs (i.e. ~1nm) that can remain stable and dispersed under harsh environments. Small ligand-free Au NPs (~3 nm diameter) have recently been grafted on metal oxides (TiO2, ZnO, CeO2) through decomposition of the HAuCl4 salt by
urea,8, 9 allowing for catalytic applications.10, 11 However, without ligands, these materials have to be stored under dry conditions to avoid aggregation and degradation.
3
A more robust solution is to use metal-organic frameworks (MOFs) as hosts to stabilize metal NPs (e.g. Ru, Pt, Pd, Cu, Ni, Au).12-18 MOFs are porous crystalline three-dimensional materials that can be synthesized with tailored pore sizes19-33 and can even support internal functionalization,25, 34-39 useful for applications such as pollutant sequestration, catalysis, photocatalysis, sensors, gas adsorption, fuel production, and biomedicine.40-46 A few strategies have been proposed, such as impregnation of Au salt/alcohol mixtures with a gas-flow reduction,36 direct incorporation of Au NPs during MOF synthesis,47, 48 or the growth of a MOF shell surrounding pre-existing Au NPs,49-51 all of which suffer serious drawbacks such as contamination resulting from incomplete removal of metal precursor ligands or reductive agents.36, 49 For instance, there have been remarkably few studies of photocatalysis for the hydrogen evolution reaction (HER),52 despite the fact that Au exhibits plasmonic properties in the visible range compared to Pt, because it is extremely challenging to stabilize Au NPs smaller than 2–3nm compared to Pt NPs.53 Gold NPs are prone to block the channels by aggregation on the external surfaces of MOFs or in very close cavities, which drastically reduces the diffusion of the reactive species within MOFs.12, 54-56 To overcome these drawbacks, functional groups have been placed inside the host pores to nucleate and stabilize ultra-small Au NPs57-62 and a method was developed to precisely determine whether the nucleation is internal or on the surface of the guests MOF NPs.50 A milestone was recently achieved by Yan et al. who report the first ultra-small Au Nanoparticles embedded in 2D mixed-ligand MOF nanosheets although in presence of external ligands.57
We present here an alternative method to synthesize Au NPs inside water-stable zirconium-based MOFs,63 based on the photo-reduction of HAuCl4 in an alcoholic MOF
suspension without the need for additional external reducing or stabilizing agents.56, 64, 65 Zirconium-based MOFs are selected because the Zr–O bonds within their multinuclear secondary building units (SBUs, usually Zr6 clusters) are particularly stable in aqueous
4
environments.63 After an extensive search (SI Section C), we focus on [Zr6O4(OH)4(H2O(OH))6](btc)6 [MOF-808] with the SH-functionalized variation66
[Zr6O4(OH)4](btc)6(pmba)6 [MOF-808-SH, btc=1,3,5-benzenetricarboxylate,
pmba=para-mercaptobenzoicacid]. Combining physical (BET), imaging (TEM) and spectroscopic (IR, Raman, UV-vis, XPS, LEIS) techniques with ab initio simulations, we demonstrate that dispersed and ultra-small Au NPs (~1nm diameter) can be synthesized and stabilized deep inside individual pores of MOF-808-SH. Thanks to these techniques, the fundamental
chemical mechanisms leading to such a controlled confinement in MOFs functionalized with –SH groups is addressed. A thorough investigation is performed in order to identify the chemical groups (pores walls) that interact with the nanoparticles inside the MOF pores. Finally, we use photocatalytic HER to precisely measure the stability of Au NPs under harsh aqueous and irradiation environments, without focusing on the yield of such a reaction. We find that the Au NPs are remarkably stable (<1.5% diameter change/hour), opening the door for exploration of catalytic processes.
Results and Discussion
The photo-reduction method is based on the decomposition of HAuCl4 under UV-visible
light irradiation to nucleate and grow guest Au NPs in an ethanolic suspension of the host MOF micro-crystals. As illustrated in Figure 1, the solvent plays a role as the reduction of Au3+ to Au0 occurs through oxidation of ethanol. With MOF as a stabilizing template, UV-visible irradiation can induce reduction without additional or stabilizing ligands that typically degrade device performance.67-69
5
Figure 1. MOFs as nano-reactors for the growth of Au NPs via photo-reduction.
As explained in Section C-1 of the SI, we focus on MOF-808 because we were able to develop a post-synthetic route to graft pmba functional groups on the SBUs of MOF-808 to obtain MOF-808-SH, i.e. thiol groups that are expected to efficiently stabilize Au NPs (SI Section C-2.2 and C-2.5).70 In the following, we combine Brunauer-Emmett-Teller (BET) measurements, high-resolution transmission electronic microscopy (HRTEM), UV-vis spectroscopy, X-ray photoelectron spectroscopy (XPS), X-ray diffraction (XRD) and Raman and IR spectroscopy to determine pore sizes, Au NP diameter and dispersion, and the nature of the interactions of the Au NPs with the MOF structure.
6
Table 1. Experimental surface areas, pore widths and pore volumes for the MOF and
Au/MOFs materials, structural windows and pore sizes, and mean Au NPs size for all studied MOFs.
The internal surface areas of pristine and Au-loaded MOF materials and the original pore sizes (mesopore distribution, Figure S1 and S2 in SI Section C-1) can be extracted from the adsorption-desorption isotherms following a BET analysis, see Table 1. After Au incorporation, the pore volumes decrease, which is expected after filling part of the pores. The loss of surface area for MOF-808 and MOF-808-SH (~30%) suggests that the Au NPs are synthesized inside the MOF crystallites. By themselves, however, the BET results are not sufficient to prove that the majority of Au NPs are inside the MOF because Au agglomerated outside the crystallites would also decrease the overall active surface area. We therefore turn to HRTEM to image the NPs.
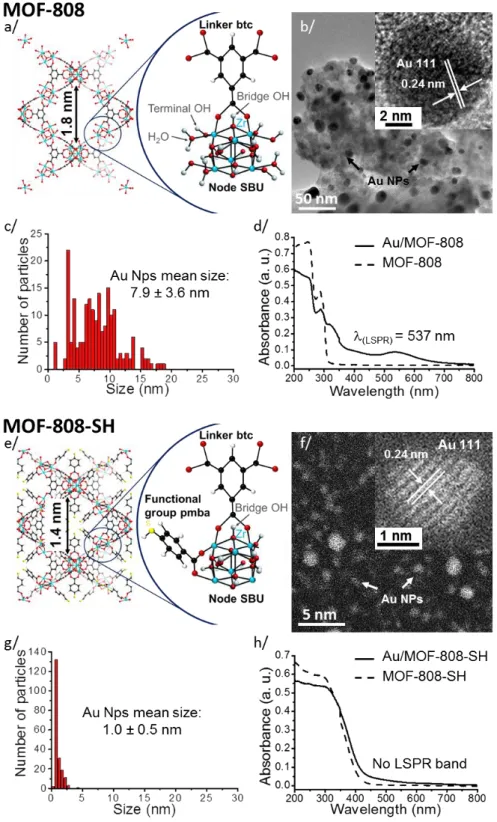
HRTEM images support the conclusion that NPs are inside the MOF and are most useful to estimate the size of these NPs (SI Section C-2). Quantitative image analysis yields 7.9 ± 3.6 nm and 1.0 ± 0.5 nm for the mean diameters in MOF-808 and MOF-808-SH, respectively (Figure 2b, c, f, g), with much more size dispersion in MOF-808. In the Au/MOF-808-SH MOF Au/MOF MOF Au/MOF MOF Au/MOF MOF Au/MOF MOF Au/MOF MOF Au/MOF MOF Au/MOF Experimental surface area (m²/g) 2023 2064 587 458 1521 1022 969 719 1264 808 874 664 3110 1126 pore width (nm) 2.3 ± 0.1 1.8 ± 0.1 1.4 ± 0.1 1.7 ± 0.1 1.6 ± 0.1 1.4 ± 0.1 1.4 ± 0.1 1.4 ± 0.1 1.07 ± 0.05 1.3 ± 0.1 0.86 ± 0.04 0.90 ± 0.01 0.86 ± 0.04 0.86 ± 0.07 pore volume (cc/g) 1.24 1.22 1.37 1.08 0.89 0.55 0.52 0.29 0.56 0.38 0.36 0.27 1.66 0.59 Structural windows size (nm) 1.6; 1.2 - - - 1.8; 0.35 - 0.5; 0.35 - 0.5; 0.35 - 0.6 -0.9; 0.5; 0.35 -pore size (nm) ~3.4; ~2.9 - - - ~1.8 - ~1.4 - ~1.4 - ~0.6 -0.5; ~1.0; ~0.12 -Au NPs mean size (nm) - 4.8 ± 2.3 - 1.0 ± 0.2 - 7.9 ± 3.6 - 7.1 ± 3.6 - 1.0 ± 0.5 - 3.4 ± 0.7 - 3.3 ± 0.9 HKUST-1 MIL-101 (Cr) MIL-101 (Cr) -SH MOF-808 MOF-808-NH2 MOF-808-SH UiO-66
7
material, the Au NPs mean size (1.0 ± 0.5 nm) is matching perfectly with the pore size of the host MOF-808-SH (1.07 ± 0.05 nm), which is expected for a preferred inclusion of the particles inside the cavities throughout the MOF volume.
With independent confirmation by XPS that Au is indeed completely reduced (i.e., Au0; see Figures S10 and S12, Tables S3 and S5, SI Section C-3) and therefore that the features detected by HRTEM are indeed Au NPs (Figure 2b, f), fast Fourier transform analysis of the pictures indicates that the Au NPs inside the MOF are crystalline. Importantly, there is no evidence for Au on the outer surfaces of the MOF crystallites, supporting the original conclusion based on our BET analysis. Note that the Raman and IR spectra of Au/MOFs are in very good agreement with the ones of the corresponding MOF hosts, indicating that the structural integrity of all studied MOFs is well preserved (SI Section C-8). This is further supported by the XRD data performed on MOFs and Au/MOF materials (SI Section C-4), which only show a partial modification of the crystallinity for HKUST-1 and MIL-101-Cr samples.
8
Figure 2. Characterization of MOF-808 and MOF-808-SH: (a/e) Structures of the host MOF;
(b/f) HRTEM observation of the Au/MOF (insert: crystalline Au NPs); (c/g) Au NPs size dispersion in Au/MOFs; (d/h) UV-vis spectra of MOF and Au/MOF.
9
A sensitive method to determine whether the Au NP diameter is greater than 1–2 nm is the detection of LSPR (SI Section C-5).53, 71, 72 In MOF-808, there are both a ligand-to-metal charge transfer transition (LMCT) at < 300 nm and a LSPR band observed at ~ 537 nm (Figure 2d), consistent with diameters > 2nm;73 in contrast, there is no detectable LSPR in Au/MOF-808-SH (Figure 2h), which indicates that the Au NP diameters are less than 2 nm in Au/MOF-808-SH only.53, 74 Importantly, this macroscopic optical measure confirms that the large majority of the Au NPs in Au/MOF-808-SH are smaller than 2 nm over the whole sample, not just in a small volume explored with HRTEM.
As reported by Esken et al., NPs are sometimes distributed throughout the volume of the MOF crystal but still exhibiting a broad size distribution with an average particle size exceeding the dimensions of the pores.56 Such a situation might result in a substantial local damage of the MOF host, opening the door for an aggregation phenomenon of metal clusters inside the pore channels when the NPs sizes are significantly larger than the pore widths.50, 56 This is clearly not the case for the Au/MOF-808-SH material, where the pore widths and NPs mean size are matching.
In addition to our TEM and BET analyses, which already suggest that the Au NPs are located inside the MOF, we also use Low Energy Ion scattering (LEIS),75 which is a more precise technique to validate this conclusion.50 Since low energy ions can only penetrate the first few layers of a material (~1nm), LEIS is a sensitive probe of the near surface region of MOF crystals. It is used here to monitor the time evolution of MOFs after synthesis of Au NPs and the composition of the material after Ar ion sputtering (i.e. depth profiling). LEIS can therefore unambiguously discriminate between the formation of Au NPs at the MOFs surface and within its interior, as detailed in Section C-6 of the SI. The LEIS spectra of Au/MOF-808 and Au/MOF-808-SH (Figure 3) show a clear signature of Zr, but no surface peaks due to Au are detected in the as-introduced samples. After sputtering with a dose of
10
4×1014 cm-2 of 8 keV Ar+ ions, however, a clear Au peak is observed. These results prove that Au is localized below the surface of the as-prepared MOF crystals, as Au particles present at the surface would produce a clear surface peak in the spectra. This is further supported by the observation that, while there is no Au after synthesis, Au appears on the surface after one month of aging (Figure S24, SI Section C-6). This effect, attributed to the migration of Au NPs to the surface over time at ambient temperature, clearly demonstrates that Au is readily detected when it is at the surface and is therefore clearly absent upon synthesis.
Figure 3. LEIS spectra of Au/MOF-808 and Au/MOF-808-SH before (blue) and after (black)
sputtering (4×1014 cm-2 Ar+), using 3 keV He+ ions. Spectra corresponding to the sputtered sample are scaled for ease of comparison to the spectra of the as-prepared material.
A striking observation is that MOF-808 is unable to confine gold within its pore diameter without thiol functionalization, i.e. the mean Au NPs size exceeds the measured or calculated
pore sizes given in Table 1 for all MOFs that are not thiol functionalized. On the other hand, the size of Au NPs (1.0 ± 0.5 nm) in Au/MOF-808-SH corresponds exactly to the size of the pores (1.07 ± 0.05 nm) and more importantly, the size dispersion is very narrow.
11
We therefore hypothesize that the thiol groups stabilize the Au NPs size by preventing Au migration during synthesis and upon ultrasonic treatment. This is reminiscent of Kimura’s earlier observation that an increase in the S/Au ratio leads to a decrease of the mean diameters of Au NPs.74 In the Au/MOF-808-SH material, each pore contains 24 –SH groups (Figure 2e) and a 1 nm diameter Au NP would contain 31 Au atoms with > 95% of the Au atoms as surface atoms; 80% of the Au surface atoms are directly in interaction with –SH groups (Figure S5, SI Section C-2.2) and the rest with the walls.76 Therefore, while Au-MOF interaction could provide additional stabilization besides the main Au-S interaction, the fact that the functional –SH groups are oriented toward the center of the windows (Figure S26, SI Section C-7) helps direct the initial Au nucleation at the center of the sulfur hexagons. Furthermore, the presence of S in MOF-808-SH during the photo-reduction may also be a factor to stop the growth of the nanoparticles.
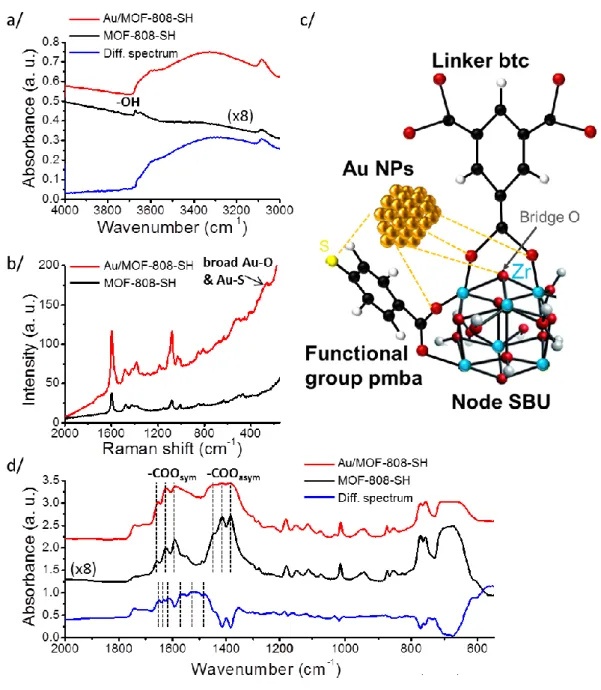
The above hypothesis was first explored by ab initio calculations, as detailed in Section C-7 of the SI. The results show that, during the nucleation, the first gold atom prefers to bind to the sulfur functional group (2.32 eV binding energy) rather than the carboxylate metal cluster node (1.93 eV binding energy) located in the periphery of the pore. The binding of the gold atoms to the sulfur groups likely helps the nucleation process as it initially localizes the first few (24) gold atoms to the ends of the functional groups. This finding is supported by Raman spectra (Figure 5b) of Au/MOF-808-SH where the Au–S stretch vibration (calculated at 254 cm-1 and measured at ~234 cm-1) is in close vicinity to the Au–O mode (calculated at 296 cm-1 and measured at ~259 cm-1) for the pmba/Au film system,77 which is consistent with a larger width for the mode at ~ 259 cm-1 (Table S9). Interestingly, as gold agglomerates into a small cluster, the binding energy of such a cluster to carboxylate linkers and metal nodes increases (2.38 eV binding energy for 16 atoms). Although the binding energy of such a cluster is larger than on an isolated SH group (1.68 eV binding energy), there are 24 thiol groups in the pore
12
vs 12 oxygen atoms in SBUs, so that the total S–Au interaction still dominates over that of the carboxylate groups. Nonetheless, for MOF-808-SH, stabilization of the Au NP to the pore size is enhanced by the Au interaction with the carboxylate groups. Therefore, as the cluster grows, the combined interaction with both thiols and SBUs leads to stabilization within the pore volume, i.e. the Au NP cannot expand beyond the MOF pore boundaries. This is not the case for un-functionalized MOF-808, in which the Au is not initially confined at the center of the pore and therefore can migrate beyond the MOF pore boundaries before a larger cluster is
formed. Note that the binding energy of the cluster near the tip of the functional group is significantly less than that of an individual atom, making it very unlikely that existing clusters interfere with the nucleation of new ones.
13
Figure 4. (a) Infrared spectra of the 4000–3000 cm-1 region; (b) Raman spectra; (c) schematic representation of the interactions between Au NPs and MOF-808; (d) infrared spectra of the 2000–550 cm-1 region for Au/MOF-808 (red curves) and MOF-808 materials (black curves). Differential spectra are depicted as blue.
14
Figure 5. (a) Infrared spectra of the 4000–3000 cm-1 region; (b) Raman spectra; (c) schematic representation of the interactions between Au NPs and MOF-808-SH; (d) infrared spectra of the 2000–550 cm-1 region for Au/MOF-808-SH (red curves) and MOF-808-SH materials (black curves). Differential spectra are depicted as blue.
The calculations further suggest that the –OH and carboxylic chemical groups should be affected after Au NP nucleation in specific ways (SI Section C-7). We have therefore performed IR absorption and Raman scattering78 experiments to characterize the interaction between Au NP surfaces and ligands btc and pmba after synthesis in both MOF-808 (Figure
15
4) and MOF-808-SH (Figure 5). As predicted, the narrow bands at 3675 cm-1 (Figure 4a) and 3671 cm-1 (Figure 5a) for MOF-808 and MOF-808-SH, respectively, assigned to the stretch of the four bridge O–H groups in the SBU nodes (Figure 2a, e),79 disappear after synthesis, consistent with direct bonding of Au to O (SI Section C-8.1).
This finding is consistent with Raman spectra (Figure 4b, Figure 5b) that show the appearance of sharp modes at 262 and 259 cm-1 in the two MOFs respectively, assigned to the Au–O stretch;80-82 this assignment is unambiguous since the precursor HAuCl4 does not have
vibrational modes in the 300–400 cm-1 region (Figure S29).83 Our ab initio calculations find the Au–O mode at 296 cm-1 and show that both the carboxylate and bridging oxygen atoms are also involved (SI Section C-7). Experimentally, resolvable shifts observed for the carboxylate modes (see IR spectra in SI Section C-8.2) are also consistent with recent findings for Au stabilization of citrate, benzoic acid, or phthalic acid ligands.84-86 Because optical spectroscopy probes the bulk system in contrast to HRTEM or surface spectroscopies (XPS and LEIS), these findings confirm that the Au NPs are located deep in the bulk of the MOF crystals.
At this point, it is important to determine the role of thiol groups and MOF pores in nucleating and confining the Au NPs. To that end, we explored a number of MOFs of various pore size and without thiol functionalization: MIL-101 (Cr) with larger pores, and UiO-66 and HKUST-1 with smaller pores than the MOF-808 series (Table 1, SI Section C-1). For all these MOFs, BET measurements show a decrease of the surface areas and pore volumes after the loading of gold (Table 1, SI Section C-1), and LEIS, IR and Raman spectra (SI Section C-6 and 8) confirm that gold is located inside the MOF crystals. However, in all these un-functionalized MOFs, the average Au NPs size is much larger than the pore sizes (Figure S4), as confirmed by the appearance of LSPR bands in the UV-vis spectra (Figure S23). There is no mechanism for stabilization, resulting in continued growth of Au NPs beyond the confines
16
of their pores. The inability of MOF-808 and other MOFs without thiol functional group to confine the Au NPs (SI Section C-2.3) indicates that, while the synthesis is clearly initiated within pores (acting as nano-reactors), the walls of the pore without -SH functionalization are not necessarily sufficient to prevent Au aggregation (Figure S6, SI Section C-2.4).
To determine whether other functional groups could also foster nucleation and confinement, we developed a method to attach –NH2 groups in MOF-808 using
para-aminobenzoic acid. The resulting average diameter of Au NPs in these MOF-808-NH2 is 7.1
± 3.6 nm (SI), much larger than the pore size (1.4 ± 0.1 nm) (Table 1, Figure S4). Therefore, in this structure which has the same SBU nodes [Zr6O4(OH)4] and same number of functional
groups as in MOF-808-SH, there is no confinement of Au NPs, most likely due to the fact that –NH2 groups are less soft than –SH groups in the hard and soft acids and bases theory
(HSAB).70 This finding highlights the particular role of thiol groups in the MOF-808 series. The generic role of thiol group is further explored by functionalizing another MOF with a larger pore size: MIL-101 (Cr), with thiol groups as described in the literature (SI Section C-9).87 The pores size of MIL-101 (Cr) -SH is 1.4 ± 0.1 nm, i.e. larger than MOF-808-SH (1.07 ± 0.05 nm, Table 1). However, in MIL-101 (Cr) -SH, the diameter of Au NPs (1.0 ± 0.2 nm) is very similar to that in MOF-808-SH (1.0 ± 0.5 nm, Figure 2f, g and Figure S4), as confirmed
by the absence of a LSPR band in the UV-vis spectrum (Figure S23), despite the difference in pore size. LEIS, IR and Raman measurements confirm that the NPs are inside the pores of MIL-101 (Cr) -SH (Figure S25, Figure S32-33, see SI Section C-9). Altogether, these findings confirm that the interaction with thiol groups is more important to stabilize Au NPs than the interaction with SBUs or walls of the MOF, although there is clearly a chemical interaction between Au and O (SI Section C-9) for MIL-101 (Cr) –SH as well.
Since the formation and stabilization of Au NPs appears to be very sensitive to the chemical environment (e.g. presence of an SH group), the question arises as to the stability of
17
these NPs once formed. We address this question by testing the system under two harsh treatments, selected for their ultimate value in photocatalysis. The first is the incorporation of Ti into these Zr-based MOFs, since the recent discovery of an enhanced photocatalytic activity for Ti based MOFs was demonstrated.52, 88 The second is to subject the modified MOFs to an actual photocatalytic process in order to measure the stability of ultra-small Au NPs.
Inspired by a new post-synthetic route with a TiCl4 precursor,89 and with the knowledge
that thorough characterization is critical to ensure that metal replacement takes place,90 we developed a procedure to incorporate Ti atoms by transmetalation into both MOF-808 and MOF-808-SH (described in SI Section C-10). Importantly, we used IR spectroscopy and energy dispersive X-ray spectrometry (EDS) to prove that metal replacement takes place without residual titanium oxide nanoparticles or coatings onto MOFs, and to quantify that 18% of the SBU nodes Zr atoms are replaced by Ti atoms covalently bound with the btc carboxylate groups without degrading the MOF structure.
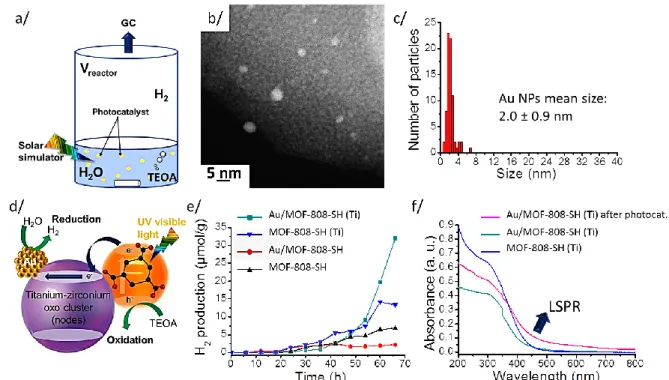
We then subjected 10 mg of MOF-808-SH, Au/MOF-808-SH, MOF-808-SH(Ti), and Au/MOF-808-SH(Ti) to a standard photocatalytic process (see Methods section)52 and measured hydrogen production (Figure 6a). As previously described by Matsuoka et al.,52 under UV-visible irradiation electron-hole pairs are formed in the MOF photocatalyst; the photo-electrons reduce water molecules whereas the holes oxidize TEOA.52 Since the LSPR properties of Au NPs co-catalysts can lead to an enhancement of the photocatalytic activity of the water reduction,91 we monitored the hydrogen production as a function of time even though the initial size of the Au NPs is too small to support LSPR (Figure 6d) and consequently does not exhibit an efficient photo-reduction of water. Indeed, H2 production is
initially negligible for all samples. However, there is a notable increase in hydrogen production rate only for the Au/MOF-808-SH(Ti) material after a ~48 h incubation time
18
(Figure 6e, see SI Section C-12).85 We demonstrate that this enhancement results from the appearance of LSPR properties of our gold nanoparticles due to their increase in size during the observed incubation period of 48h (Figure 6e). Indeed, HRTEM observations show an increase of the Au NPs mean size and size dispersion from 1.0 ± 0.5 nm to 2.0 ± 0.9 nm after the completed photocatalysis experiment (i.e. after 66h UV-visible irradiation, Figure 6b, c). A broad LSPR absorption band appears after 24h around 500 nm in the UV-vis spectra (Figure 6f), expected when the diameter reaches 1.94 nm;74 this resonance is believed to be responsible for the photocatalytic enhancement due to the synergy between the LSPR properties of gold co-catalyst and the presence of titanium in the MOF nodes.52, 89, 92, 93 The actual rate of hydrogen production in Figure 6e is small compared to other systems92, 94-96 (SI Section C-11) but the main point of our experiments is not to find a better system for hydrogen production but rather to show Au NP stability under harsh conditions.
It is clear that the hydrogen evolution reaction (HER) is initially very weak, until the size of the NPs becomes large enough to activate the hybrid photocatalyst during the observed incubation period. However, the focus of using HER in our study is not to yield high catalytic performance known e.g. for Pt NP,52 but rather to use it as a probe: The sharp dependence of the reaction on the NP diameter makes it possible to use this method to finely tune the NP size and explore the photocatalytic process, which opens the door for studying other plasmonic NPs such as Pt, Ag, and Cu.
19
Figure 6. (a) Scheme of the reactor; (b) HRTEM observations and (c) Au NP size dispersion
of Au/MOF-808-SH(Ti) after photocatalysis; (d) Schematic model of the photocatalytic reaction with gold nanoparticles; (e) Hydrogen production as a function of time (grey background for 0 to 48 h time); (f) UV-vis spectra of MOF-808-SH (black), Au/MOF-808-SH (red), MOF-808-SH(Ti) (blue), Au/MOF-808-SH(Ti) before (green-blue) and after photocatalysis (violet).
From these measurements of hydrogen production (SI, Section C-11), the rate of NP diameter increase can be estimated to be 0.015 nm.h-1. This is an upper limit as the growth is highly non-linear. From IR and EDS measurements after photocatalysis (Table S10 and SI Section C-12), we determine that the slow growth of the Au NPs is probably due to removal of part of the pmba functional groups since a ~25% loss of sulfur is measured by EDS (Table S10)—this removal opens up more space in the pores and is thus favorable to NP aggregation, leading to the observe increase of the Au NPs size. Moreover, the EDS spectra performed before and after the photocatalysis (Table S10) clearly evidence the same Au loading: 0.14%
20
and 0.15%, respectively, which strongly support the conservation of larger Au NPs inside the pores after photocatalysis as more detailed in Section C-12 of the supplementary information. Finally, a depth profile of the composition is performed by XPS for Au/MOF-808-SH (Ti) before and after photocatalysis (SI Section C-13). The XPS spectra show that gold is not only detected on the top surface of the MOF crystals but also deeply inside the pores of the MOF-808-SH (Ti) host since a larger quantity of gold is exhibited after sputtering whether before or after photocatalysis.
Overall, these data confirm that the Au NPs are stable under photocatalytic conditions, exhibiting only a small diameter increase which actually fosters photocatalytic activity.
Conclusion
In summary, the presented work not only demonstrates that ~1 nm diameter Au NPs can be synthesized within individual pores of MOF-808-SH and MIL-101 (Cr) -SH by a photo-reduction without additional external stabilizing or reducing agents, but also provides a mechanistic picture of the growth mechanism and in particular the reason why confinement is not achieved in other MOFs, i.e. how the presence of thiol groups located in the pore leads to confinement. The difficult question of whether Au NPs are located inside or on the surface of the MOF, often not fully addressed in the literature, is unambiguously answered using spectroscopic tools (LEIS, IR, Raman and UV-vis) in addition to imaging (TEM) and physical (BET) measurements. Detailed information on the chemical interaction of Au with the functionalized MOF is further provided with input from ab initio calculations. This combination is particularly powerful as other techniques such as tomography, while very useful, can only be applied to a local (nm size) region of the material and not its bulk.
Furthermore, we demonstrate that the new Zr-based MOF-808-SH samples can be doped by titanium transmetalation before Au NP synthesis, allowing us to precisely measure the
21
high stability of our Au NP by monitoring hydrogen production during the solar photocatalytic reduction of water and showcasing a novel way to accurately determine NP stability that may also be applicable to other hybrid materials. The slow growth of the Au NP diameter, i.e. 0.015 nm.h-1, in an aqueous medium under solar irradiation indicates that these Au NPs are stable under particularly harsh environmental conditions.
22
Experimental and Theoretical Section:
Sample preparation: The synthesis of MOF-808, MOF-808-SH, MOF-808-NH2, MIL-101 (Cr), MIL-MIL-101 (Cr) -SH and UiO-66 samples and titanium doping on MOF-808-SH is described in Section A of Supporting Information, as they followed standard procedures reported in numerous publications.66 The Au@MOFs were synthesized by directly mixing and stirring MOF (20 mg) and the gold salt precursor HAuCl4.3H2O (10 mg, 2.5.10-5 mol) in
ethanolic solution (2 mL) under UV-visible irradiation (UV Rayonet system: = 253.7, 300, 350 and 575 nm, 224 Watts, 1 h 30 min). The resulting solution was centrifuged at 6000 rpm during 3 min and the colorless supernatant was removed. The resulting powder was dried under the vacuum of a Schlenk line (1 h).
Characterization: The characterization methods include Brunauer-Emmett-Teller (BET),
High-resolution transmission electron microscopy (HRTEM), X-ray photoelectron spectroscopy (XPS), Ultraviolet–visible spectroscopy (UV-vis), Low energy ion scattering (LEIS) and infrared and Raman spectroscopies, as detailed in Section B of Supporting Information.
Ab initio calculations: The calculations of the binding energy and frequency were
performed in VASP at the density functional theory (DFT) level, using the vdW-DF exchange-correlation potential to capture van der Waals interactions (SI Section C-7).
Photocatalysis: Each sample was immersed in an aqueous solution (10 mL) of
triethanolamine (TEOA, 1.10-2 mol.L-1) as sacrificial reagent in a quartz reactor and irradiated by a solar simulator (Xenon lamp, 300 Watts) for 66 h. The reactor was connected to a gas chromatography (GC) system to measure (every 6 h) the hydrogen production during the photocatalytic reduction of water (Figure 6a).
23
Conflicts of interest
The authors declare no competting financial interest.
Author information
Corresponding authorTimo Thonhauser: thonhauser@wfu.edu Yves J. Chabal: chabal@utdallas.edu
Author Contributions
J. C. prepared all the Au/MOFs materials and performed all the infrared spectroscopic measurements. E. M. took the LEIS measurement. K. C. and H. A. performed the H2
production measurements. S. J. carried out all calculations. K.T. provided support for infrared data analysis and manuscript preparation. All HRTEM images were obtained by M. C. and S. K. under the guidance of M. K.. S. Y., L. F., P. Z. and H.W. prepared the MOFs samples, guided by H.-C. Z. and J. L. J.F.V. performed the XPS measurements. Y. C. performed additional LEIS and IR measurements. G. Z. performed additional XRD measurements. Y. J. C. and T. T. directed and supervised the characterization and modeling research, respectively.
Acknowledgement
All the synthesis and spectroscopic characterization and modeling were supported by the Department of Energy, Basic Energy Sciences, division of Materials Sciences and Engineering (DOE Grant No. DE-FG02-08ER46491). The photocatalytic experiments were supported by the Université de Toulouse (IDEX MUSE) and the CNRS.
24
References
1. C. Farcau, H. Moreira, B. Viallet, J. Grisolia and L. Ressier, ACS Nano, 2010, 4, 7275-7282. 2. L. M. Liz-Marzan, Langmuir, 2006, 22, 32-41.
3. M. Dasog and R. W. J. Scott, Langmuir, 2007, 23, 3381-3387.
4. P. E. cardoso Avila, A. Rangel Mendoza, J. L. Pichardo Molina, L. L. Flores Villavicencio, J. P. castruita Dominguez, M. K. Chilakapati and M. Sabanero Lopez, Toxicol. In Vitro, 2017, 42, 114-122.
5. M. Haruta, S. Tsubota, T. Kobayashi, H. Kageyama, M. J. Genet and B. Delmon, J. Catal., 1993, 144, 175-192.
6. X. Ji, X. Song, J. Li, Y. Bai, W. Yang and X. Peng, J. Am. Chem. Soc., 2007, 129, 13939-13948. 7. H. Al-Johani, E. Abou-Hamad, A. Jedidi, C. M. Widdifield, J. Viger-Gravel, S. S. Sangaru, D.
Gajan, D. H. Anjum, S. Ould-Chikh, M. N. Hedhili, A. Gurinov, M. J. Kelly, M. El Ester, L. Cavallo, L. Emsley and J.-M. Basset, Nat. Chem., 2017, 9, 890-895.
8. R. Zanella, S. Giorgio, C. R. Henry and C. Louis, J. Phys. Chem. B, 2002, 106, 7634-7642. 9. R. Zanella, L. Delannoy and C. Louis, Appl. Catal. A, 2005, 291, 62-72.
10. N. D. Tran, M. Besson, C. Descorme, K. Fajerwerg and C. Louis, Catal. Commun., 2011, 16, 98-102.
11. L. Delannoy, K. Fajerwerg, P. Lakshmanan, C. Potvin, C. Méthivier and C. Louis, Appl. Catal., B., 2010, 94, 117-124.
12. M. Zhao, K. Yuan, Y. Wang, G. Li, J. Guo, L. Gu, W. Hu, H. Zhao and Z. Tang, Nature, 2016, 539, 76-80.
13. F. R. Fortea-Pérez, M. Mon, J. Ferrando-Soria, M. Boronat, A. Leyva-Pérez, A. Corma, J. M. Herrera, D. Osadchii, J. Gascon, D. Armentano and E. Pardo, Nat. Mater., 2017, 16, 760-766. 14. G. Lu, S. Li, Z. Guo, O. K. Farha, B. G. Hauser, X. Qi, Y. Wang, X. Wang, S. Han, X. Liu, J. S.
DuChene, H. Zhang, Q. Zhang, X. Chen, J. Ma, S. C. J. Loo, W. D. Wei, Y. Yang, J. T. Hupp and F. Huo, Nat. Chem., 2012, 4, 310-316.
15. V. P. Santos, T. A. Wezendonk, J. J. D. Jaén, A. I. Dugulan, M. A. Nasalevich, H.-U. Islam, A. Chojecki, S. Sartipi, X. Sun, A. A. Hakeem, A. C. J. Koeken, M. Ruitenbeek, T. Davidian, G. R. Meima, G. Sankar, F. Kapteijn, M. Makkee and J. Gascon, Nat. Commun., 2015, 6, 6451. 16. Q. Yang, W. Liu, B. Wang, W. Zhang, X. Zeng, C. Zhang, Y. Qin, X. Sun, T. Wu, J. Liu, F. Huo and
J. Lu, Nat. Commun., 2017, 8, 14429.
17. S. Dang, Q.-L. Zhu and Q. Xu, Nat. Rev. Mater., 2017, 3, 17075.
18. H. R. Moon, D.-W. Lim and M. P. Suh, Chem. Soc. Rev., 2013, 42, 1807-1824.
19. A. Dhakshinamoorthy, A. M. Asiri and H. Garcia, Chem. Soc. Rev., 2015, 44, 1922-1947. 20. Z. J. Zhang, H. T. Nguyen, S. A. Miller, A. M. Ploskonka, J. B. DeCoste and S. M. Cohen, J. Am.
Chem. Soc., 2016, 138, 920-925.
21. A. Corma, H. Garcia and F. X. Llabrés i Xamena, Chem. Rev., 2010, 110, 4606-4655.
22. M. L. Foo, R. Matsuda, Y. Hijikata, R. Krishna, H. Sato, S. Horike, A. Hori, J. Duan, Y. Sato, Y. Kubota, Takata, M. and S. Kitagawa, J. Am. Chem. Soc., 2016, 138, 3022-3030.
23. K. A. Cychosz, R. Ahmad and A. J. Matzger, Chem. Sci., 2010, 1, 293-302.
24. Q. G. Zhai, X. H. Bu, X. Zhao, D. S. Li and P. Y. Feng, Acc. Chem. Res., 2017, 50, 407-417. 25. Y.-B. Huang, J. Liang, X.-S. Wang and R. Cao, Chem. Soc. Rev., 2017, 46, 126-157. 26. H. Furukawa, K. E. Cordova, M. O'Keeffe and O. M. Yaghi, Science, 2013, 341, 974. 27. P. Q. Liao, N. Y. Huang, W. X. Zhang, J. P. Zhang and X. M. Chen, Science, 2017, 356, 1193. 28. P. F. Ji, J. B. Solomon, Z. K. Lin, A. Johnson, R. F. Jordan and W. B. Lin, J. Am. Chem. Soc., 2017,
139, 11325-11328.
29. B. Li, H. M. Wen, Y. J. Cui, W. Zhou, G. D. Quian and B. L. Chen, Adv. Mater., 2016, 28, 8819-8860.
25
30. B. Y. Li, Y. M. Zhang, R. Krishna, K. X. Yao, Y. Han, Z. L. Wu, D. X. Ma, Z. Shi, T. Pham, B. Space, J. Liu, P. K. Thallapally, J. Liu, M. Chrzanowski and S. Q. Ma, J. Am. Chem. Soc., 2014, 136, 8654-8660.
31. A. Mallick, B. Carai, M. A. Addicoat, P. S. Petkov, T. Heine and R. Banerjee, Chem. Sci., 2015, 6, 1420-1425.
32. W. N. Zhang, Y. Y. Liu, G. Lu, Y. Wang, S. Z. Li, C. L. Cui, J. Wu, Z. L. Xu, D. B. Tian, W. Huang, J. S. DuCheneu, W. D. Wei, H. Y. Chen, Y. H. Yang and F. W. Huo, Adv. Mater., 2015, 27, 2923-2929.
33. N. S. Bobbitt, M. L. Mendonca, A. J. Howarth, T. Islamoglu, J. T. Hupp, O. K. Farha and R. Q. Snurr, Chem. Soc. Rev., 2017, 46, 3357-3385.
34. Y. Wei, S. Han, D. A. Walker, P. E. Fuller and B. A. Grzybowski, Angew. Chem. Int. Ed., 2012, 51, 7435-7439.
35. M. Yadav and Q. Xu, Chem. Commun., 2013, 49, 3327-3329.
36. H. Duan, Z. Y., X. Yao, P. Xing, J. Liu and Y. Zhao, Chem. Mater., 2017, 29, 3671-3677.
37. W. N. Zhang, G. Lu, C. L. Cui, Y. Y. Liu, S. Z. Li, W. J. Yan, C. Xing, Y. R. Chi, Y. H. Yang and F. W. Huo, Adv. Mater., 2014, 26, 4056-4060.
38. Z. Zhou, C. He, J. H. Xiu, L. Yang and C. Y. Duan, J. Am. Chem. Soc., 2015, 137, 15066-. 39. Y.-L. Wong, Y. Diao, J. He, M. Zeller and Z. Xu, Inorg. Chem., 2019, 58, 1462-1468.
40. P. Falcaro, R. Ricco, A. Yazdi, I. Imaz, S. Furukawa, D. Maspoch, R. Ameloot, J. D. Evans and C. J. Doonan, Coord. Chem. Rev., 2016, 307, 237-254.
41. Q. Yang, Q. Xu and H. L. Jiang, Chem. Soc. Rev., 2017, 46, 4774-4808.
42. J. Long, H. L. Liu, S. J. Wu, S. J. Liao and Y. W. Li, ACS Catal., 2013, 3, 647-654. 43. T. Ishida, M. Nagaoka, T. Akita and M. Haruta, Chem. Eur. J., 2008, 14, 8456-8460. 44. J. Juan-Alcaniz, J. Gascon and F. Kapteijn, J. Mater. Chem., 2012, 22, 10102-10118. 45. R. B. Wu, X. K. Qian, K. Zhou, H. Liu, B. Yadian, J. Wei, H. W. Zhu and Y. Z. Huang, J. Mater.
Chem. A, 2013, 1, 14294-14299.
46. K. Na, K. M. Choi, O. M. Yaghi and G. A. Somorjai, Nano Lett., 2014, 14, 5979-5983. 47. H.-L. Jiang, B. Liu, T. Akita, M. Haruta, H. Sakurai and Q. Xu, J. Am. Chem. Soc., 2009, 131,
11302-11303.
48. M. Wen, K. Mori, Y. Kuwahara and H. Yamashita, ACS Energy Lett., 2017, 2, 1-7. 49. H. Kobayashi, Y. Mitsuka and H. Kitagawa, Inorg. Chem., 2016, 55, 7301-7310. 50. A. Dhakshinamoorthy, A. M. Asiri and H. Garcia, ACS Catal., 2017, 7, 2896-2919.
51. W. Shang, C. Zeng, Y. Du, H. Hui, X. Liang, C. Chi, K. Wang, Z. Wang and J. Tian, Adv. Mater., 2017, 29, n/a.
52. Y. Horiuchi, T. Toyao, M. Saito, K. Mochizuki, M. Iwata, H. Higashimura, M. Anpo and M. Matsuoka, J. Phys. Chem. C, 2012, 116, 20848-20853.
53. R. Jin, Nanoscale, 2015, 7, 1549-1565.
54. Y. J. Ding, Y. P. Chen, X. L. Zhang, L. Chen, Z. H. Dong, H. L. Jiang, H. X. Xu and H. C. Zhou, J. Am. Chem. Soc., 2017, 139, 9136-9139.
55. Y. Peng, Y. S. Li, Y. J. Ban and W. S. Yang, Angew. Chem. Int. Ed., 2017, 56, 9757-9761.
56. D. Esken, S. Turner, O. I. Lebedev, G. Van Tendeloo and R. A. Fischer, Chem. Mater., 2010, 22, 6393-6401.
57. R. Yan, Y. Zhao, H. Yang, X.-J. Kang, C. Wang, L.-L. Wen and Z.-D. Lu, Adv. Funct. Mater., 2018, 28, n/a.
58. A. Dhakshinamoorthy and H. Garcia, Chem. Soc. Rev., 2012, 41, 5262-5284.
59. Y. Luan, Y. Qi, Y. Gao, N. N. Zheng and G. Wang, J. Mater. Chem. A, 2014, 2, 20588-20596. 60. P. Falcaro, R. Ricco, A. Yazdi, I. Imaz, S. Furukawa, Maspoch, D., R. Ameloot, J. D. Evans and C.
J. Doonan, Coord. Chem. Rev., 2016, 307, 237-254.
61. B. Gole, U. Sanyal and P. S. Mukherjee, Chem. Commun., 2015, 51, 4872-4875.
62. R. Binaymotlagh, H. Farrokhpour, H. Hadadzadeh, S. Z. Mirahmadi-Zare and Z. Amirghofran, J. Phys. Chem. C, 2017, 121, 8589-8600.
26
64. D. Sun and Z. Li, J. Phys. Chem. C, 2016, 120, 19744-19750.
65. D. Wang, Y. Song, J. Cai, L. Wu and Z. Li, New J. Chem., 2016, 40, 9170-9175.
66. J. Jiang, F. Gandara, Y. B. Zhang, K. Na, O. M. Yaghi and W. G. Klemperer, J. Am. Chem. Soc., 2014, 136, 12844-12847.
67. Q. Ong, Z. Luo and F. Stellacci, Acc. Chem. Res., 2017, 50, 1911-1919.
68. E. Villarreal, G. G. Li, Q. Zhang, X. Fu and H. Wang, Nano Lett., 2017, 17, 4443-4452.
69. J. Cure, H. Assi, K. Cocq, L. Marin, K. Fajerwerg, P. Fau, E. Bêche, Y. J. Chabal, A. Estève and C. Rossi, Langmuir, 2018, 34, 1932-1940.
70. S. Nath, S. K. Ghosh, S. Kundu, S. Praharaj, S. Panigrahi and T. Pal, J. Nanopart. Res., 2006, 8, 111-116.
71. C. Prestipino, L. Regli, J. G. Vitillo, F. Bonino, A. Damin, C. Lamberti, A. Zecchina, P. L. Solari, K. O. Kongshaug and S. Bordiga, Chem. Mater., 2006, 18, 1337-1346.
72. G. Han, Q. Zeng, Z. Jiang, T. Xing and C. Huang, Talanta, 2017, 164, 355-361.
73. K. Leus, P. Concepcion, M. Vandichel, M. Meledina, A. Grirrane, D. Esquivel, S. Turner, D. Poelman, M. Waroquier, V. Van Speybroeck, G. Van Tendeloo, H. Garcia and P. Van des Voort, RSC Adv., 2015, 5, 22334-22342.
74. S. Chen and K. Kimura, Langmuir, 1999, 15, 1075-1082.
75. K. Tan, S. Zuluaga, E. Fuentes, E. C. Mattson, J.-F. Veyan, H. Wang, J. Li, T. Thonhauser and Y. J. Chabal, Nat. Commun., 2016, 7, 13871.
76. N. E. Christensen and V. Heine, Phys. Rev. B, 1985, 32, 6145-6156.
77. W.-Q. Ma, Y. Fang, G.-L. Hao and W.-G. Wang, Chin. J. Chem. Phys., 2010, 23, 659-663. 78. A. Mezni, T. Dammak, A. Fkiri, A. Mlayah, Y. Abid and L. A. Smiri, J. Phys. Chem. C, 2014, 118,
17956-17967.
79. G. Wang, C. Sharp, A. M. Plonka, Q. Wang, A. I. Frenkel, W. Guo, C. Hill, C. Smith, J. Kollar, D. Troya and J. R. Morris, J. Phys. Chem. C, 2017, 121, 11261-11272.
80. A. Gomez-Patricio, A. Santiago-Portillo, S. Navalon, P. Concepcion, M. Alvaro and H. Garcia, Green Chem., 2016, 18, 508-515.
81. C. Wang, H. Gu, M. Lv, R. He and J. Zhang, Spectroc. Acta A, 2014, 122, 65-74.
82. A. A. Bessonov, T. V. Basova, V. G. Kiselev, L. A. Sheludyakova, N. B. Morozova and I. K. Igumenov, Vib. Spectrosc., 2009, 51, 283-288.
83. O. Zaluzhna, Y. Li, C. Zangmeister, T. C. Allison and Y. J. Tong, Chem. Commun., 2012, 48, 362-364.
84. J.-W. Park and J. S. Shumaker-Parry, J. Am. Chem. Soc., 2014, 136, 1907-1921. 85. Y.-C. Chen, I.-L. Lee, Y.-M. Sung and S.-P. Wu, Sens. Actuators B, 2013, 188, 354-359. 86. J. Gao, Y. Hu, S. Li, Y. Zhang and X. Chen, Spectroc. Acta A, 2013, 104, 41-47.
87. T. Liu, J.-X. Che, Y.-Z. Hu, X.-W. Dong, X.-Y. Liu and C.-M. Che, Chem. Eur. J., 2014, 20, 14090-14095.
88. M. Dan-Hardi, C. Serre, T. Frot, L. Rozes, G. Maurin, C. Sanchez and G. Férey, J. Am. Chem. Soc., 2009, 131, 10857-10859.
89. Y. Lee, S. Kim, J. K. Kang and S. M. Cohen, Chem. Commun., 2015, 51, 5735-5738.
90. M. S. Denny Jr., L. R. Parent, J. P. Patterson, S. K. Meena, H. Pham, P. Abellan, Q. M. Ramasse, F. Paesani, N. C. Gianneschi and S. M. Cohen, J. Am. Chem. Soc., 2017.
91. W. Xia, C. Mei, X. Zeng, G. Fan, J. Lu, X. Meng and X. Shen, ACS Appl. Mater. Interfaces, 2015, 7, 11824-11832.
92. J.-D. Xiao, L. Han, J. Luo, S.-H. Yu and H.-L. Jiang, Angew. Chem. Int. Ed., 2018, 57, 1103-1107. 93. Z. Gu, L. Chen, B. Duan, Q. Luo, J. Liu and C. Duan, Chem. Commun., 2016, 52, 116-119. 94. D. Sun, W. Liu, Y. Fu, Z. Fang, F. Sun, X. Fu, Y. Zhang and Z. Li, Chem. Eur. J., 2014, 20,
4780-4788.
95. D. Tilgner and R. Kempe, Chem. Eur. J., 2017, 23, 3184-3190.
96. Y. Wang, Y. Zhang, Z. Jiang, G. Jiang, Z. Zhao, Q. Wu, Y. Liu, Q. Xu, A. Duan and C. Xu, Appl. Catal., 2016, 185, 307-314.
27


![[PDF] Comment utiliser MS PowerPoint pas a pas | Cours informatique](data:image/gif;base64,R0lGODlhAQABAIAAAP///wAAACH5BAEAAAAALAAAAAABAAEAAAICRAEAOw==)