HAL Id: hal-02753496
https://hal.inrae.fr/hal-02753496
Submitted on 3 Jun 2020HAL is a multi-disciplinary open access archive for the deposit and dissemination of sci-entific research documents, whether they are pub-lished or not. The documents may come from teaching and research institutions in France or abroad, or from public or private research centers.
L’archive ouverte pluridisciplinaire HAL, est destinée au dépôt et à la diffusion de documents scientifiques de niveau recherche, publiés ou non, émanant des établissements d’enseignement et de recherche français ou étrangers, des laboratoires publics ou privés.
Effect of a post-weaning restricted nutrition on the
initiation of puberty and the reproductive performances
of early bred Merino ewe-lambs
Fabienne Blanc-Vazeille, Damien Fabre, François Bocquier, Sylvie Canepa,
Carole Delavaud, Alain Caraty, Yves Chilliard, Nathalie Debus
To cite this version:
Fabienne Blanc-Vazeille, Damien Fabre, François Bocquier, Sylvie Canepa, Carole Delavaud, et al.. Effect of a post-weaning restricted nutrition on the initiation of puberty and the reproductive perfor-mances of early bred Merino ewe-lambs. 11. Seminar of the FAO-CIHEAM Sub-Network on Sheep and Goat Nutrition, Sep 2005, Catania, Italy. �hal-02753496�
Effect of a post-weaning restricted nutrition on the initiation of
puberty, plasma leptin and the reproductive performances of early
bred Merino ewe-lambs
F. Blanc (1), D. Fabre (1), F. Bocquier (1), S. Canepa (2), C. Delavaud (3), A. Caraty (2), Y. Chilliard (3), N. Debus (1)
(1) UMR Elevage des Ruminants en Régions Chaudes, Agro.M, 2, place Viala, 34 060 Montpellier (2) UMR Physiologie de la Reproduction et des Comportements, INRA Tours, 37 380 Nouzilly (3) Unité de Recherches sur les Herbivores, INRA Theix, 63 122 St Genes Champanelle
SUMMARY - The study assessed the effect of the nutrition level from weaning to mating on the onset of puberty and the reproductive performances of early mated (9-10 months old) ewe-lambs. Three month-old ewe-lambs were allocated to one of 3 treatments: High group (H, n=10) was fed ad libitum with a ration of dried beet pulp (50%), dehydrated alfafa meal (40%) and straw pellets (10%). Medium (M, n=10) and Low (L, n=10) groups were first underfed (respectively at 70% and 40% of the amount of feeds offered to group H) from 13 to 38 weeks of age and then fed ad libitum until 46th week of age. Three weeks after the beginning of the refeeding period œstrous behaviour
was checked twice a day and ewe-lambs in œstrous were mated. Blood samples were collected twice a week to follow plasma progesterone (P4) and leptin concentrations. Individual food
intake, weight and body condition score (BCS) were respectively measured every day, every week and every 2 weeks. All animals except one in group H, reached puberty (P4 >1 ng/ml) before
the end of the study. Age at puberty did not differ between groups H (32.9±2.0 weeks) and M (32.2±2.0 weeks) but was increased for group L (38.6±3.4 weeks). Only four ewe-lambs in group L reached puberty before the refeeding period at a mean age of 35.3 weeks. Weights (H: 43.5±4.3, M: 36.8± 3.1, L: 32.0±3.4 kg) and BCS (H: 3.2±0.2, M: 2.9±0.2, L: 2.1± 0.2) at puberty decreased with the undernutrition level. Leptinemia at puberty was higher in group H (11.6±5.5 ng/ml) than in groups M and L (5.6±1.3 and 4.6±1.6 ng/ml, respectively). Œstrous detection rates (respectively 90, 70 and 40%) decreased with the feeding restriction, whereas productivity reached 60, 60 and 30%. To conclude, only L treatment delayed the onset of puberty and affected the reproductive performances. Neither weight, nor BCS or leptin per se appeared to be primary cues for puberty even if they could play a permissive role.
Keywords : Puberty, growth restriction, ewe lamb, food intake, adiposity, leptin, reproductive performance
RESUME-« Effets d’une restriction alimentaire post-sevrage sur l’apparition de la puberté, la leptine plasmatique et les performances de reproduction d’agnelles Mérinos d’Arles mises à la lutte précocement ».
L’étude évalue les effets du niveau nutritionnel post-sevrage sur le moment d’apparition de la puberté et les performances de reproduction d’agnelles Mérinos d’Arles mises à la lutte précocement (9-10 mois d’âge). Trente agnelles âgées de 3 mois ont été réparties dans 3 lots expérimentaux : le lot Haut (H, n=10) était nourri à volonté avec une ration composée de pulpe de betterave déshydratée (50%), de luzerne déshydratée (40%) et de bouchons de paille mélassée (10%). Les lots Moyen (M, n=10) et Bas (B, n=10) ont tout d’abord été sous-alimentés (respectivement à hauteur de 70% et 40% des quantités offertes au groupe H) entre 13 et 38 semaines d’âge puis réalimentés à volonté jusqu’à l’âge de 48 semaines. Trois semaines après le début de la période de réalimentation, une détection systématique du comportement d’œstrus a été réalisée 2 fois par jour et les agnelles en œstrus ont été saillies. Des prises de sang ont été réalisées 2 fois par semaine pour déterminer les concentrations plasmatiques en progestérone (P4) et leptine. Les quantités ingérées individuelles ont été enregistrées quotidiennement. Les agnelles ont été pesées une fois par semaine et leur état corporel noté tous les 15 jours. Tous les animaux, à l’exception d’une agnelle dans le groupe H, sont devenus pubères (P4 > 1ng/ml) avant la fin
de l’expérimentation. L’âge à la puberté n’a pas différé entre les lots H (32.9±2.0 semaines) et M (32.2±2.0 semaines) mais a été augmenté dans le lot B (38.6±3.4 semaines). Seules quatre agnelles dans le groupe B sont devenues pubères avant le début de la réalimentation à un âge moyen de 35.3 semaines. Les poids (H: 43.5±4.3, M: 36.8±3.1, B: 32.0±3.4 kg) et les notes d’état corporel (H: 3.2±0.2, M: 2.9±0.2, B: 2.1±0.2) à la puberté ont diminué avec le niveau de sous-alimentation. La leptinémie à la puberté a été plus élevée dans le groupe H (11.6±5.5 ng/ml) que dans les groupes M et B (5.6±1.3 et 4.6±1.6 ng/ml, respectivement). Le taux d’agnelles en œstrus (respectivement 90, 70 et
40%) a diminué linéairement avec le niveau de sous-alimentation, tandis que la productivité numérique a atteint respectivement 60, 60 et 30% pour les lots H, M et B. Pour conclure, seul le traitement B a induit un retard d’apparition de la puberté et a affecté les performances de reproduction des agnelles mises à la lutte précocement. Les résultats de cette étude indiquent que ni le poids, ni l’état corporel, ni la leptine ne constituent en eux-mêmes les signaux déclencheurs de la puberté. Ils pourraient donc ne jouer qu’un rôle permissif.
Mots-clés : Puberté, sous-alimentation, développement post-sevrage, agnelle, ingestion, adiposité, leptine, reproduction
Introduction
In the prepubertal female, the hypothalamic-pituitary-ovarian system is relatively mature but ovulation does not occur because of an insufficiently tonic LH secretion. The pubertal transition occurs when the frequencies of GnRH and LH pulses increase to drive follicular development and the production of oestradiol which evokes the gonadotropin surge and ovulation (Foster et al., 1985). In sheep, the activity of the GnRH pulse generator depends on growth, nutrition and photoperiod (Adam and Robinson, 1994). In immature females, a severe undernutrition is known to delay, even inhibit, the onset of puberty (Foster et al., 1985; Suttie et al., 1991). Yet, the inhibitory effect of undernutrition may be overriden if animals are refed ad libitum (Suttie et al., 1991). The relationships between nutrition and puberty are an important issue for seasonal breeds as they will determine the opportunity to plan the first breeding season at 8-11 months old. Such an early breeding limits the maintenance cost of the replacement ewes by avoiding a 1 year delay in reproduction, and may accelerate the genetic gain in breeding schemes by reducing the interval between generations.
Despite considerable information gained in understanding the mechanisms controlling the sexual maturation process, the question of the link between nutrition and puberty remains unsolved. Successive hypotheses were proposed. The “body weight” hypothesis considered that a critical body weight related to a level of fatness is necessary for puberty to occur. More recent studies favoured the “metabolic hypothesis” that considers that both weight and fatness per se are necessary but are not sufficient and suggests that blood-borne substances signal the brain about the nutritional status and the metabolic readiness for puberty (Foster and Nagatani, 1999). However, the question is still opened concerning the physiological signals recognized by the neuroendocrine system of the young female that reflect its metabolic status and interfere either to initiate, to postpone or to regulate the activity of the hypothalamo-pituitary-ovarian axis. A large array of metabolites and metabolic hormones have been proposed to take part to the regulation of the reproductive axis in the onset of puberty by nutrition (Foster and Nagatani, 1999). Among the candidate signals, leptin focused a high attention as its secretion is linked to adiposity (review of Chilliard et al., 2005), and as studies in rodents have demonstrated that the administration of leptin accelerates the initiation of puberty (Ahima et al., 1997) and can reverse the delay in the onset of puberty in severely food-restricted female rats (Cheung et al., 1997).
This study aimed to analyse the response of Merino ewe lambs to a post-weaning feeding restriction on the timing of puberty and the reproductive performance in relation with their growth, body condition, energy balance and leptinemia.
Material and Methods
Animals, diets and animal management. Lambs were female Merino genotype obtained from the Frejorgues experimental farm. At weaning (12 weeks of age), a total of 30 ewe lambs were allocated to three experimental groups of similar weights (22.3±3.2, 22.4±3.2 and 22.3±3.0 kg), body condition scores (2.85±0.22, 2.95±0.32 and 2.85±0.28) and pre-weaning growths (221±38, 223±35 and 230±30 g/day). The average ages of the animals at the beginning of the experiment were respectively 84.9±6.3, 84.6±4.8 and 83.0±6.7 days for each group. From the 13rd to the 38th week of age, groups were allocated at
random to one of the three nutritional treatments. Treatment HIGH (H, n=10) fed ad libitum a diet composed of dried beet pulp (50%), dehydrated alfafa meal (40%) and straw pellets (10%), which energy density was 6.1 MJ ME/kg DM and crude protein content was 121 g/kg DM. The treatments MEDIUM (M, n=10) and LOW (L, n=10) differed from the H treatment by the amounts of feed offered (respectively 70% and 40% of the amounts of group H). From the 39th week of age, all groups were then fed ad libitum.
During all the experiment, individual feed intake was daily measured by weighing amounts of food offered and refused. The lambs were penned indoors under natural photoperiod. Each day, they were enclosed into individual pens from 16:00 to 8:00 in order to feed them individually. Each morning, at 8:00, they were left to an exercise pen (10 m²/group) where water and salt were available ad libitum. They were also offered a vitamin-mineral premix (50 g/d/ewe).
Three weeks after the refeeding treatment, œstrous behaviour was checked twice a day using mature rams, and ewe lambs in œstrous were mated. Ewes were bred for 1.5 month (from mid november to end of december). Then, they were all grouped and raised in the same pen during all the pregnancy period.
Sample collection, measurements and laboratory assays. Animals were weighed once a week always at the same time (9:00). Body Condition Scores were estimated (on the scale of 1-emaciated to 5-obese) every two weeks at 9:00. Blood samples were collected before feeding (15:30), twice a week by jugular venipuncture using EDTA (leptin analysis) and heparin (progesterone analysis) as anticoagulants. After centrifugation, plasma samples were frozen. Plasma progesterone concentrations were measured by RIA (Terqui and Thimonier, 1974). Plasma leptin concentrations were determined using double-antibody RIA (Delavaud et al., 2000), at the beginning, the middle and the end of the differenciated feeding levels period and during the three first weeks of the refeeding period. Pregnancy was tested measuring PSPB (pregnancy-specific protein B) plasma concentrations by RIA (El Amiri et al., 2003) thirty days after mating. Births were recorded to evaluate the numeric productivities within each group.
Data analysis. ME intake in group H (fed ad libittum) was supposed to satisfy the energy requirements for maintenance and a maximum growth in our experimental conditions. A simple mathematical model (monomolecular function) was considered to predict the energy requirements as a function of body weight. The parameters of this model were estimated from the data set that relies daily ME intakes in group H to the lambs’ weights. The relative energy balances in groups M and L were then calculated by comparing the observed ME intakes in these groups to their theoretic ME requirements, that were predicted from the observed weights of M and L lambs.
All values were expressed as means and standard deviations. The effects of the feeding level and time on weights, fatness (BCS), leptin concentrations and energy intakes were assessed by a repeated measure analysis using mixed model methodology (SAS, 1999; Littel et al., 1998). Onset of puberty was determined when the threshold level of 1 ng/ml progesterone was first detected. Age at puberty was studied by the generalized linear models procedure with weight, body condition score, energy balance and leptin level at puberty as main predictors. Reproductive performance data were expressed as œstrous rates, pregnancy rates and numeric productivity and the effect of the feeding treatment was analyzed with contingency tables and chi-square tests. The null hypothesis was rejected at p<0.05.
Results and discussion
Compared to the estimated energy requirements, treatments M and L induced respective relative energy deficits of 20% and 38% during the differenciated feeding levels period (Fig. 1).
Fig.1 : Changes in energy balance throughout the experiment in groups H, M and L. ME intakes in group H were supposed to account for the energy requirements for maintenance and maximum growth. Relative deficits in ME are (Observed ME intake – ME requirements adjusted on weights) / ME requirements adjusted on weights.
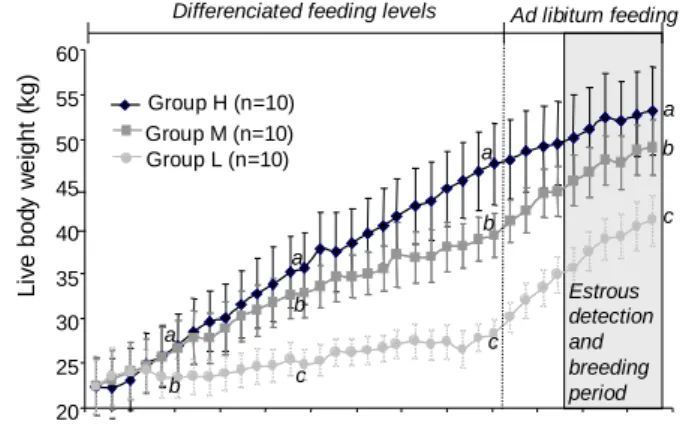
Fig. 2 : Changes in body weights throughout the experiment in groups H, M and L. Data are means ±
s.d. Different superscripts means a significant difference at p<0.05 between feeding levels : weights in groups H, M and L differed from 171 days of age to the end of the experiment.
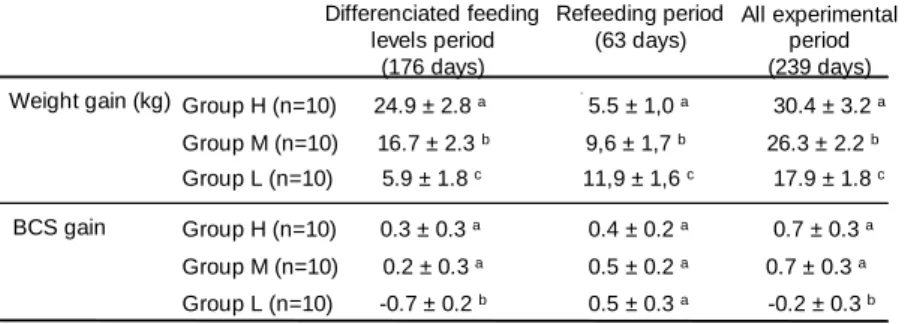
Lambs fed ad libitum (group H) gained weight continuously throughout the study (Fig.2). Average daily weight gains in groups M and L were significantly lower (H : 127 ± 13 g/day , M : 110 ± 9 L : 75 ± 7, p<0.01). Average weight gains differed between feeding treatments and according to the feeding periods
-60 -50 -40 -30 -20 -10 0 10 20 80 100 120 140 160 180 200 220 240 260 280 300 320 -60 -50 -40 -30 -20 -10 0 10 20 80 100 120 140 160 180 200 220 240 260 280 300 320
Group H (n=10) Group M (n=10) Group L (n=10)
Age (days) D ef ic it in M E (% ) Ad libitum feeding Differenciated feeding levels Ad libitum feeding Differenciated feeding levels
20 25 30 35 40 45 50 55 60 80 100 120 140 160 180 200 220 240 260 280 300 320 340 Li ve b od y w ei gh t (k g) Ad libitum feeding Estrous detection and breeding period Differenciated feeding levels
Group H (n=10) Group M (n=10) Group L (n=10) Age (days) a b a b c a b c a b c
(table 1), with compensatory growths observed both in groups M and L during the refeeding period. Only the severe food restricted treatment (group L) had a negative effect on ewes’ body condition (average BCS observed throughout the experiment : H: 3.0 ± 0.3 ; M : 2.9 ± 0.3 ; L : 2.1 ± 0.4, p<0.01). Ewes in groups M had similar BCS changes than ewes in group H throughout the experiment (table 1). In contrast, ewes in group L lost 0.7 units of BCS (-25%, p<0.05) during the underfeeding period.
Table 1 : Effect of the feeding treatment on weight gains (means ± s.d.) and variations of body condition scores in groups H, M and L, according to the feeding periods.
Different superscripts within a column means a significant difference between treatments at p<0.05
From the middle to the end of the restricted feeding period, plasma leptin concentrations measured in groups M and L were significantly lower than in group H (Fig. 3). Such a response in underfed animals was also observed in preweaning lambs (Ehrhardt et al. 2003) and in post-weaning ewe lambs (Recabarren et al. 2004). Changes in plasma leptin concentrations differed between feeding treatments : they significantly increased in group H (from 3.3 ± 0.5 at 3 months of age to 12.9 ± 5.2 ng/ml at 9 months of age, p<0.05), whereas they did not vary with time in the underfed groups (M : from 4.2 ± 0.8 to 5.6 ± 1.2 ng/ml; L : from 3.9 ± 0.5 to 3.8 ± 0.9 ng/ml) (Fig.3). In well-fed Suffolk x Corriedale lambs, Tokuda et al. (2003) observed similar changes in plasma leptin concentrations with levels that increased between 0.5 and 6 months post-weaning from 4 to 10 ng/ml. During the three first weeks of the refeeding period, plasma leptin concentrations highly increased in group M (from 5.6 ± 1.2 to 9.9 ± 3.7 ng/ml, p<0.05). Such an increase took place during the three days following the start of the refeeding treatment, which shows a high reactivity of plasma leptin to variations in nutritional level. In contrast, no significant effect of refeeding was observed on leptinemia in group L (Fig.3), suggesting that in animals severly underfed over a long period, adiposity may be too low (under a limit threshold) to respond by an enhanced leptin synthesis when feeding conditions are improved.
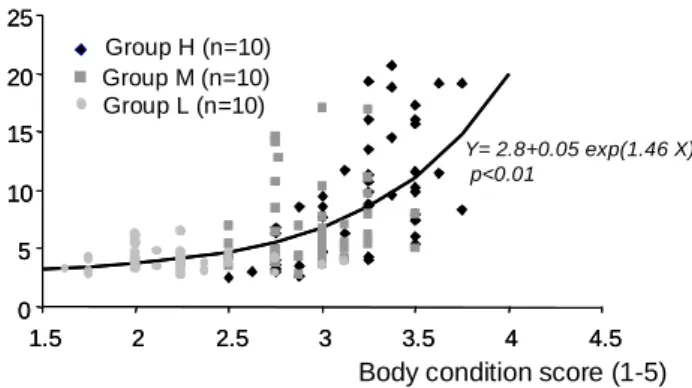
As a whole, plasma leptin concentrations were positively correlated to BCS (Fig. 4). However, within each treatment the relationship between leptinemia and BCS only appeared to be significant in group H. The non-linear response observed between plasma leptin concentrations and BCS (stable leptin levels for BCS<2.5 and exponential increase with adiposity for BCS>2.5) has also been reported by Chilliard et al. (2005) in adult dry ewes. The non significant relationship between leptin levels and BCS in group M confirms that adiposity is not the only factor influencing the variations in plasma leptin concentrations during growth. As proposed by Ehrhardt et al. (2003) and Chilliard et al. (2005), an important nutrition-adiposity interaction occurs in pre-weaning lambs. However, results from group L indicate that leptin synthesis by the adipose tissue would increase only when a threshold level of adiposity has been reached, as in adult ewes.
All ewe lambs, except one in group H, reached puberty (P4 >1 ng/ml) before the end of the experiment.
Mean age at puberty did not differ between groups H (230 ± 14 days) and M (225 ± 14 days) but was delayed for group L (270 ± 23 days). Only four ewe lambs in group L reached puberty before the
refeeding period at a mean age of 247 ± 14 days. Weight, plasma leptin concentrations and energy
balance at puberty were not significant predictors of age at puberty. Only BCS had a significant effect on the timing of puberty. Weights (H: 43.5 ± 4.3, M: 36.8 ± 3.1, L: 32.0 ± 3.4 kg) and BCS (H: 3.2 ± 0.2, M: 2.9 ± 0.2, L: 2.1 ± 0.2) at puberty decreased with the undernutrition level. Leptinemia at puberty was higher in group H (11.6 ± 5.5 ng/ml) than in groups M and L (5.6 ± 1.3 and 4.6 ± 1.6 ng/ml, respectively). Lambs in group L that reached puberty before the refeeding period weighed 28.6 ± 2.3 kg, had a mean BCS of 2.2 ± 0.2 and plasma concentrations of leptin at puberty of 3.0 ± 4.5 ng/ml. As age at puberty did not differ between groups H and M whereas their plasma leptin concentrations were highly
Weight gain (kg) Differenciated feeding levels period (176 days) Refeeding period (63 days) Group H (n=10) 24.9 ± 2.8 a 5.5 ± 1,0 a Group L (n=10) 16.7 ± 2.3 b 9,6 ± 1,7 b 5.9 ± 1.8 c 11,9 ± 1,6 c All experimental period (239 days) 30.4 ± 3.2 a 26.3 ± 2.2 b 17.9 ± 1.8 c BCS gain 0.3 ± 0.3 a 0.4 ± 0.2 a 0.2 ± 0.3 a 0.5 ± 0.2 a -0.7 ± 0.2 b 0.5 ± 0.3 a 0.7 ± 0.3 a 0.7 ± 0.3 a -0.2 ± 0.3 b Group H (n=10) Group M (n=10) Group L (n=10) Group M (n=10)
different, leptin per se does not appear to be the metabolic signal initiating puberty in our study. Such a conclusion was also proposed by Recabarren et al. (2004)
All ewes that reached puberty (9/10) expressed œstrous behaviour in group H, whereas only 70% in group M and 40% in group L (p<0.05). Pregnancy rates determined 30 days after mating, were similar in groups H and M (70%) and significantly lower in group L (30%). Finally, the numeric productivities observed in groups H, M and L respectively reached 60, 60 and 30% because of lambs’ mortality (one in group H and one in group M).
Fig. 3 : Changes in plasma leptin concentrations during the feeding treatments period and the beginning (3 weeks) of the refeeding period in groups H, M and L. Data are means ± s.d. Different superscripts means a significant difference at p<0.05 between feeding levels.
Fig.4 : Relationship between body condition score recorded during the experiment and corresponding leptin level. A significant non linear regression was observed when fitted over all data.
Conclusions
Only the severe underfeeding treatment induced negative effects on the reproductive performances of the early bred ewe lambs. Such a negative influence has multiple components : firstly, the delay in the onset of puberty that increases the risk that puberty occurs too late in regards to the photoperiodic cue; secundly, the expression of œstrous behaviour that seems to be affected by undernutrition. In regards to the initiation of puberty and reproductive performances of overfed ewe lambs, their post-weaning growth does not allow to improve their reproductive efficiency compared to ewes that were moderately underfed.
Our study confirms that adiposity (BCS>2,2) plays a permissive role on the onset of puberty, and that plasma leptin is not the only metabolic signal that initiates puberty in sheep. Further investigations are necessary to test the hypothesis of Foster and Nagatani (1999) who proposed that leptin could interact with other metabolic cues such as glucose availability and insulin-like growth factor-I in timing puberty. References
Adam, C.L. and Robinson, J.J. (1994). The role of nutrition and photoperiod in the timing of puberty. Proc. Nutr. Soc., 53 : 89-102.
Ahima, R.S., Dushay, J., Flier, S.N., Prabakaran, D. and Flier, J.S. (1997). Leptin accelerates the onset of puberty in normal female mice. J. Clin. Invest., 99 : 391-395.
Chilliard, Y., Delavaud, C. and Bonnet, M. (2005). Leptin expresssion in ruminants : nutritional and physiological regulations in relation with energy metabolism. Dom. Anim. Endocrinol., 29 : 3-22.
Delavaud, C., Bocquier, F., Chilliard, Y. Keisler, D.H., Gertler, A. and Kann, G. (2000). Plasma leptin determination in ruminants : effect of nutritional status and body fatness on plasma leptin concentration assessed by a specific RIA in sheep. J. Endocrinol., 165 : 519-526
Ehrhardt, R.A., Greenwood, P.L., Bell, A. W. and Boisclair, R. (2003). Plasma leptin is regulated predominantly by nutrition in preruminant lambs. J. Nutr., 133 : 4196-4201.
El Amiri B., Karen A., Cognie Y., Sousa, N.M., Hornick J.L.,Szenci, O. and Beckers J.F. (2003). Diagnostic et suivi de gestation chez la brebis: réalités et perspectives. INRA Prod. Anim., 16 : 79-90. Foster, D.L., Yellon, S.M. and Olster, D.H. (1985). Internal and external determinants of the timing of puberty in the female. J. Reprod. Fert., 75 : 327-344.
Littel, R.C., Henry, P.R. and Ammerman, C.B. (1998). Statistical analysis of repeated measures data using SAS procedures. J. Anim. Sci., 76 : 1216-1231.
Recabarren, S.E., Lobos, A., Torres, V., Oyarzo, R. and Sir-Petermann, T. (2004). Secretory patterns of leptin and luteinizing hormone in food-restricted young female sheep. Biol. Res., 37 : 371-384.
P la sm a le pt in c on ce nt ra tio ns ( ng /m l) Group H (n=10) Group M (n=10) Group L (n=10) Age (days) Ad libitum feeding Estrous detection and breeding period Differenciated feeding levels Ad libitum feeding
Estrous detection and breeding period Differenciated feeding levels Ad libitum feeding
Estrous detection and breeding period Differenciated feeding levels
0 2 4 6 8 10 12 14 16 18 20 80 100 120 140 160 180 200 220 240 260 280 300 a b a b b a b b a b a b
Plasma leptin concentration (ng/ml)
Body condition score (1-5)
Group H (n=10) Group M (n=10) Group L (n=10) 0 5 10 15 20 25 1.5 2 2.5 3 3.5 4 4.5 0 5 10 15 20 25 1.5 2 2.5 3 3.5 4 4.5 Y= 2.8+0.05 exp(1.46 X) p<0.01
SAS (1999). SAS/STAT User’s Guide. Version 8. 3809 p. Cary, NC.
Suttie, J.M., Foster, D.L., Veenvliet, T.R., Manley, T.R. and Corson, I.D. (1991). Influence of food intake but independence of body weight on puberty in female sheep. J. Reprod. Fert., 92 : 33-39.
Terqui M. and Thimonier J., (1974). Nouvelle méthode radio immunologique pour l'estimation du niveau de progestérone plasmatique. Application pour le diagnostic précoce de la gestation chez la brebis et la chèvre. C. R. Acad. Sc., 279 : 1109-1112
Tokuda, T., Delavaud, C. and Chilliard, Y. (2003). Plasma leptin concentration in pre- and post-weaning lambs. Anim. Sci., 76 : 221-227.