Accelerating the Onboarding of a New Factory Partner By:
Amanda Rikki Lurie
B.S. Earth and Environmental Engineering Columbia University, 2009
Submitted to the MIT Sloan School of Management and the Institute for Data, Systems, and Society in partial Fulfillment of the Requirements for the Degrees of
Master of Business Administration and
Master of Science in Engineering Systems
In conjunction with the Leaders for Global Operations Program at the Massachusetts Institute of Technology
June 2016
@2016 Amanda Rikki Lurie. All rights reserved.
The author hereby grants MIT permission to reproduce and to distribute publicly copies of this thesis document in whole or in part in any medium n known or hereaft r
created.
//
,
-Signature of Author
Signature redacted
Certified by
MIT Sloan School of Management MIT Institute for Data, Mytems, and Society May 6, 2016
Signature redacted
Dr. Stanley Gershwin
Senior Research Scientist, MR Department of Mechanical Engineering
Thesis Supervisor Certified by Professor of Management Accepted by
Signatu
Clarence Accepted bySignature redacted
Dr. Stephen Graves Science, MIT Sloan School of Management Thesis Supervisorre redactea
John N. Tsitsiklis J. Lebel Professor of Electrical Engineering
Engineering IDSS Graduate Officer
gnature
redacted
Maura Herson Director of MBA Program, MIT Sloan School of Management
5I
MASSACHSET ILNSTITUTEOF TECHNOLOGY
Accelerating the Onboarding of a New Factory Partner By:
Amanda Rikki Lurie
Submitted to the MIT Sloan School of Management and the Institute for Data, Systems, and Society on May 6, 2016 in partial Fulfillment of the Requirements for the
Degrees of Master of Business Administration and Master of Science in Engineering Systems
Abstract
Nike established the Advanced Manufacturing team to create a future of manufacturing that will be able to better meet growing customer expectations, battle rising costs of production, and unlock new design capabilities. While new methods of manufacturing are groundbreaking for Nike, there is currently no standard operating procedure on how to properly integrate these new methods into footwear manufacturing. Nike would like to better understand the current process and identify ways to increase the ease of
deployment to ensure profitability and improved speed to market. To do this, the research explored the current state of bringing onboard a new factory partner to the factory network, investigated metrics through which to evaluate inefficiencies, and provided suggestions for process improvements to create a more efficient future state. Future state projections show significant decrease in factory setup time. Preliminary implementation of the suggestions shows encouraging results in decreasing cost and increasing speed to market. While results are currently theoretical, this research
provides a baseline framework to identify waste and develop process improvements to more efficiently onboard a new factory partner.
Dr. Stanley Gershwin
Senior Research Scientist, MIT Department of Mechanical Engineering Thesis Supervisor
Dr. Stephen Graves
Professor of Management Science, MIT Sloan School of Management Thesis Supervisor
Table of Contents
A b stra c t ... 3
Acknowledgem ents ... 5
L ist o f F ig u re s ... 8
1 .0 In tro d u c tio n ... 9
1.1 Nike, Inc. Com pany Background... 9
1.2 Nike Footwear Manufacturing Background ... 10
1.3 Nike Footwear Advanced Manufacturing Background ... 10
1.4 Problem Statement ... 13
1.5 Project Goals ... 13
2.0 Project M ethodology ... 14
2 .1 O v e rv ie w ... 14
2.2 General Approach ... 14
2.2.1 Understand Current Process... 14
2.2.2 Identify M etrics for Success ... 14
2.2.3 Develop Process Im provements ... 15
2.3 Data Collection Lim itations... 15
3.0 Literature Review ... 16
3.1 Process Documentation and Mapping ... 16
3.2 Lean Process Im provement Methods... 17
3.3 Factory Startup Discussion ... 19
3.3.1 Equipment Planning ... 20
3.3.2 Autom ation Im plem entation... 21
3.3.3 Labor and Training ... 21
3.3.4 Im plem enting Change ... 23
4.0 The Current State ... 24
4.1 W ork Stream Methodology ... 24
4.2 Factory O perations ... 25
4 .2 .1 T ra in ing ... 2 6 4.2.2 Product Choice... 27
4.2.3 Factory Location... 28
4.3 Legacy Equipment Ordering... 29
Acknowledgements
I would like to first thank Nike for its support of my project and the Leaders for Global Operations (LGO) program. Being part of the cutting edge, innovative Advanced Manufacturing and New Factory Partnerships teams was an amazing learning
opportunity. A very special thanks to Nguyen Webster, my project supervisor, and Bill Rogers and Michael Newton, my project sponsors. Without your support, guidance, and mentorship, this project would not have been possible. And thank you to my fellow Nike LGOs and Sloanies, Clara Voigt, Blair Holbrook, Andrew Gabris, and Katy Shaw for being my workout partners, sounding boards, and friends during our time at Nike. Thank you to the Leaders for Global Operations (LGO) Program for its support of this work. I would also like to thank my advisors at MIT, Professor Stephen Graves and
Professor Stanley Gershwin, for their time, advice, and assistance through the project. Thank you to my Lambdies and LGBros. The last two years have been a whirlwind experience of laughter, learning, and memories. I can't wait to see the amazing things that the Lambdas achieve.
And to my 371 Amsterdam Ladies, you are my second family. Thank you for your endless support, encouragement, and wit. I am so happy to have all of you in my life.
Finally, and most importantly, I would like to thank my family. My mom and dad for their continuous support throughout my entire academic journey, and each of my siblings, Tobie, Pesy, Adam, and Becky for the love and guidance you have given me through
40 ~ .: A1 e% I- f L I_ L I - o'-r o rm c needledon
Lit years. IAn nU Aunt Harriet and UncUe ChUUk, thank
yuu
ioryour mucned
on-the-ground encouragement during my internship. You have all given me the confidence, skills, and work ethic to be successful.This thesis is dedicated to the memory of my Opie, who passed away during my time at LGO. His wanderlust, passion for helping others, and love of laughter will inspire me forever.
4.3.2 Phase 2 and Phase 3... 31
4.3.3 Pre-Production ... 31
4.4 Novel Equipment Ordering ... 31
4.5 M aterial Ordering... 32
5.0 Identifying W aste... 33
5 .1 R e w o rk ... 3 3 5 .2 W a it T im e ... 3 5 5 .3 H a n d o ffs ... 3 7 5.4. Sum m ary Statistics of Current State... 39
6.0 Kaizen Methodology... 41 6.1 Background ... 41 6 .2 P ro c e s s ... 4 2 6 .3 F in d in g s ... 4 2 6.3.1 Current State... 42 6.3.2 Problem Areas ... 43
6.3.3 Root Cause Analysis... 43
7.0 Future State Discussion ... 49
7.1 Suggestions for Im provement: Internal ... 49
7.2 Suggestions for Im provement: External... 50
7.3 Future State Predictions ... 53
8 .0 C o n c lu s io n ... 5 5 8.1 Areas for Future Research... 55 8 .2 F in a l N o te s ... 5 6 A p p e nd ix 1 ... 5 7 A p p e nd ix 2 ... 5 8 A p p e nd ix 3 ... 6 1 R e fe re n c e s ... 6 2
List of Figures
FIGURE 1: RISING LABOR COSTS ACROSS ASIA:...12
FIGURE 2: THE SEVEN TYPES OF WASTE ... 19
FIGURE 3: FACTORY PLANNING BUILDING BLOCKS...21
FIG U R E 4: R EW O R K ... 34
FIG U R E 5: W A IT IN G T IM E ... 36
FIG U R E 6: HA N D O FFS ... 38
1.0 Introduction
The purpose of this thesis is to better understand and document the current process of deploying new methods of manufacturing to Nike, Inc. (Nike) footwear factories while identifying ways to ease deployment, and ultimately, create a new, more efficient process to ensure profitability and improved speed to market. This research was conducted in conjunction with the Advanced Manufacturing team within Nike.
1.1 Nike, Inc. Company Background
Since its creation in 1964 as Blue Ribbon Sports, Nike has grown to a company with 30.6 billion dollars in revenue (Nike, 2015). Nike is the world leader in three main athletic product categories: footwear, apparel, and equipment. Known as its trademark product around the world, Nike footwear represents 18.3 billion dollars of revenue for the company. Apparel revenue is about half the amount of footwear, totaling 8.6 billion dollars, while equipment totals 1.6 billion dollars (Nike, 2015). This thesis will focus on the footwear part of the business.
Nike produced more than 530 million pairs of shoes in 2015 across six different global markets: North America, Western Europe, Central & Eastern Europe, Greater China, Japan, and the Emerging Markets; in eight different sport categories: running,
basketball, football (soccer), Men's training, Women's training, action sports,
sportswear, and golf (Nike, 2015). Nike sells its products to retail accounts, through Nike-owned retail stores and Internet websites, and through a mix of independent distributors and licensees throughout the world. Nike follows a retail cycle of four selling seasons - spring, summer, fall, and holiday. The planning and design of a new style of shoe begins more than a year in advance of its planned market date and can
1.2 Nike Footwear Manufacturing Background
Like many of its competitors, Nike manufactures its products by independent contract manufacturers. Nearly all Nike footwear and apparel products are produced outside of the United States, while equipment products are produced both in the United States and abroad. Nike is supplied by approximately 146 footwear factories located in 14
countries. 96% of those factories are located in three countries: Vietnam. China, and Indonesia. The remaining 4% of footwear factories are located in Argentina, Brazil, India, and Mexico; these factories manufacture footwear primarily for sale within those countries. While there are a lot of footwear factories, five of the factories each
accounted for greater than 10% of footwear production, and all together, accounted for approximately 69% of footwear production in 2015. The main materials used in Nike footwear are natural and synthetic rubber, plastic compounds, foam cushioning materials, nylon, leather, canvas, and polyurethane films used to make Nike Air-Sole cushioning components. The contract manufacturers are wholly responsible for the procurement of the raw materials and for the management of the suppliers of the materials (Nike, 2015). While the manufacturing operations are run by the contract manufacturer, Nike does have local offices in close proximity to the factories to manage the process and provide guidance if needed.
1.3 Nike Footwear Advanced Manufacturing Background
To maintain a competitive advantage over its competition and to stay the industry leader in footwear, Nike established the Advanced Manufacturing team to create a future of
manufacturing that makes the best use of materials, technology, and people. The Advanced Manufacturing team was created in April 2014 as part of the Manufacturing
Revolution group. The Advanced Manufacturing team is committed to changing the way that Nike produces footwear through the development and implementation of innovative
By developing these new methods of manufacturing, Nike will be able to solve three
main challenges it's encountering with its current manufacturing network:
1) Customer Expectations are Changing: Consumers are pushing for more
customization and a more specialized product as it puts them "back in the center of attention of the footwear producer." Customization allows for "direct, one-to-one contact" where the consumer is "greeted, inquired, scanned, measured, questioned, supported, and assisted in their purchase experience, transforming a simple necessity act, into a ritual that makes the consumer feel that what the company is trying to do is not simply trying to sell an item, but learning more about his or her desires and expectations." While Nike's current manufacturing capabilities are able to meet the present customer expectations of "buying a good pushed by a need," the projected increased growth of customization will certainly overwhelm the manufacturing system. Current manufacturing systems would not accommodate the types of customization that Nike Design projects for the future. The new methods of manufacturing that are to be deployed are designed with these needs in mind (Bodr, C. R., and Sergio Dulio, 2007, pg 27).
2) Production Costs are Rising: As mentioned in section 1.2, virtually all of Nike footwear production is conducted in Asia. Contract manufacturers benefited from the low cost of labor, materials, and other required inputs with manufacturing in Asia. When Nike moved production to Asia more than twenty years ago, labor was plentiful and cheap, but current trends indicate that the labor arbitrage will not continue forever in Asian manufacturing. Wages are steadily rising in each of Nike's main footwear manufacturing countries:
Figure 1: Rising Labor Costs Across Asia (Macquarie Research, 2013): 600 500 400 - China Philippines 300 Indonesia Vietnam 200 Cambodia 100 0 - -2008 2009 2010 2011 2012E
As these costs continue to rise as projected, the current methods of
manufacturing will not be sufficient. The Advanced Manufacturing strategy aims to remedy this problem.
3) Technology is Evolving: While the current methods of manufacturing have led Nike down a successful path, they are outdated. Remarkably, the methods of manufacturing across the footwear industry remain similar to those used by town cobblers nearly 200 years ago. While other industries quickly update and
innovate manufacturing methods, footwear production is still very antiquated. Nike aims to change this, looking to modernize the manufacturing practices and machinery like other industries have done. This same innovation is necessary in footwear manufacturing.
The Advanced Manufacturing group is composed of four teams: Digital Product Creation (DPC), Operations (Ops), Ecosystem (Eco), and New Factory Partnerships (NFP). DPC is tasked with increasing visibility and transparency into the order, production, and distribution process through digital tools and processes. The Ops team is responsible for the demand planning and project management for all of Advanced Manufacturing, ensuring that all of the groups are aligned on the overall goals of the group and Nike, in general. The Eco team works to develop an intelligent supply chain to procure the necessary equipment, materials, and other items that will be needed within the factory.
The NFP team is responsible for all operations and activities that occur within the four factory walls to manufacture the footwear. This thesis will focus on the work done by the
NFP team, but will feature interactions and processes that were done with the other teams within Advanced Manufacturing.
1.4 Problem Statement
Because these new methods of manufacturing are groundbreaking for Nike and the industry as a whole, there is currently no standard process on how to implement new manufacturing techniques into footwear manufacturing. The NFP team within Advanced Manufacturing worked through this process since its inception, working to incorporate new technologies into Nike's manufacturing. As the pioneer of these new methods, the NFP team perceives that the process is not proceeding efficiently: the process is encountering trial and error, non-value added work, and rework at times. These inefficiencies lead to an uncertain and longer than ideal factory-planning process.
1.5 Project Goals
Nike's perception is that the process to deploy new methods of manufacturing is flawed. This research aims to expand Nike's competitive advantage by developing a
streamlined startup process to fix the process for onboarding new factory partners. When attempting to create a better process, the new process should meet specific goals. They are as follows:
1) Reduced Cost: By eliminating waste and unnecessary steps in the process, Nike will be able to utilize fewer resources and lower relative headcount.
2) Improved Speed to Market: By decreasing the number of process steps, Nike will be able to get footwear to market much quicker.
3) Gates and Dates: Stakeholders in the process will be aware of the necessary deadlines and tests to be successful in deploying new methods of manufacturing.
4) Ownership of Responsibilities: A clearer distinction of responsibilities across the stakeholders.
5) Keep the Craft: The new process cannot in any way affect the look, feel, and quality of Nike footwear.
2.0 Project Methodology
The purpose of this chapter is to briefly outline the methodology used for the project, as well as limitations that were encountered during the data collection process.
2.1 Overview
This research aimed to first understand the current process in use by the NFP team at Nike to deploy new methods of manufacturing. Generally, this research was done by conducting interviews to gather data from current stakeholders. Subsequently, a set of
metrics is developed to identify areas of opportunity to improve the process, and ultimately provide recommendations to create a better process.
2.2 General Approach
2.2.1 Understand Current Process
The first step in learning about potential process improvements is to understand the current process. To document the steps and activities, process mapping is utilized.
Process mapping is an important tool to understand process time, stakeholders
involved, and interdependencies between steps. By creating a visual tool to map out the process, stakeholders are better able to identify waste. In addition, those that are adding to each step can answer questions and provide clarification for others (Cobb, 2006).
Finally, a key to understanding the process is learning not only about what was done in each step, but the reasoning and decision-making behind each step.
2.2.2 Identify Metrics for Success
After the process was mapped, it is critical to determine a way to measure inefficiencies within the process. Once inefficiencies can be measured, the steps that require the most
process changes become more obvious. Three metrics are selected to measure waste within the process.
2.2.3 Develop Process Improvements
Based on the three metrics, process steps with the most inefficiency are identified. A 5-why root cause analysis is conducted to determine the root cause of the worst
bottlenecks and problem areas. Based on these root causes, various solutions are proposed to remedy the challenges within the process. These solutions include overall changes in strategy, as well as changes in the step-by-step processes.
2.3 Data Collection Limitations
Data for this project was collected primarily through qualitative methods. As the various steps in the process were not tracked in real time, stakeholder memory and documents are heavily relied upon. Data was generally collected through multiple pathways:
interviewing stakeholders, attending team meetings, shadowing employees, analyzing documents, and visiting Nike factories. If stakeholders had differing opinions on a process step, stakeholders collaborated and agreed upon the answer that is detailed in this thesis.
3.0 Literature Review
This literature review is not intended to be exhaustive. This section provides an overview of the background research that was done to better understand onsite
activities at Nike. The literature informs the decisions and recommendations that will be given.
3.1 Process Documentation and Mapping
Detailing and using process maps is not a new concept, and many individuals have developed ideas on the best way to do so. Frank Gilbreth is the first to be credited with introducing the idea of the process map in his search for the "one best way" to complete a task. In his 1921 address to the American Society of Mechanical Engineers, he
preached to the audience about the need to define a problem and break it down into smaller tasks in order to better understand it, and thus improve it. His initial work described four main parts of a task: the operations, the transportation, the inspection, and the storage/delay (Gilbreth, 1921). Following Gilbreth, in 1947, the Society of Mechanical Engineers established a set of symbols to better standardize process mapping (Graham, 2008). Since then, there has been much work to continue these early endeavors. For the purpose of this research, a sequential flow diagram will be discussed, as the order of operations was most important to Nike.
Sequential flow diagrams aim to "present the discrete steps in a process sequentially in the order in which tasks are accomplished (Colligan et. al, 2010)." In creating such a map, it is important to document the amount of time required for each step, as one of the main goals of this type of map is the timing associated with each and all of the tasks. It is also important to explain the reasons behind a step or decision to shed light into why specific tasks were conducted before or after others, and most importantly, if tasks should be moved around to create a more efficient process (Phillips & Simmonds, 2013). Finally, it is important to note the stakeholders that are necessary for each of the sequential steps. This is critical as it allows for the balancing of work across members of
a team and teams within a group. With the flow diagram, it becomes much easier to visualize the number and types of tasks that will be required at a given time (Anjard,
1999).
3.2 Lean Process Improvement Methods
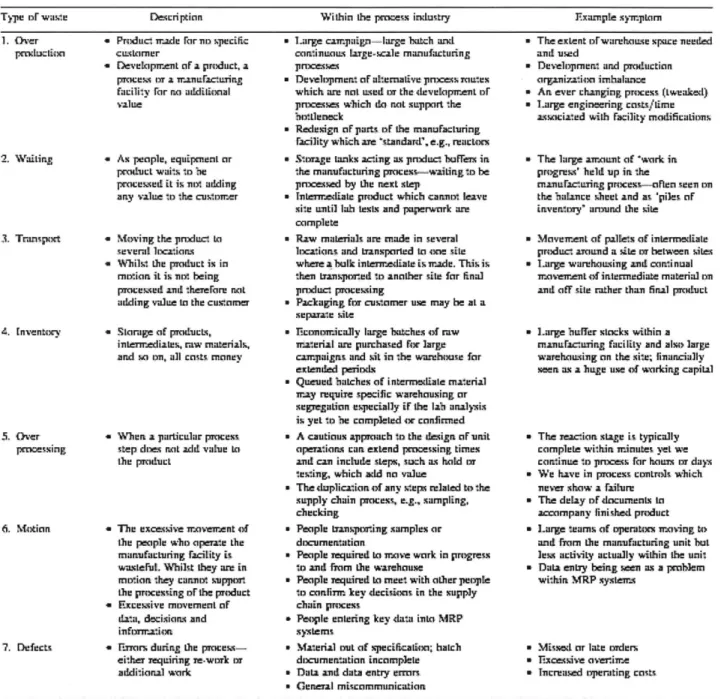
In order to identify inefficiencies and wastes in the current process, principles from lean production are studied. The goals of lean are to eliminate wasteful processes, increase output, improve product quality, and shorten time to market and thus, overall cost (Karlssson and Ahlstrom, 1996). Ultimately, lean aims to remove any business process or task which does not create value for the customer (Womack and Jones, 1996). Astonishingly, according to the Lean Enterprise Research Center, only about 5% of process tasks actually add any value for the customer. To find areas for opportunity and improvements in a process, lean focuses on seven types of waste shown below in Figure 3 (Melton, 2005, pg 666). These lean metrics will be revisited in Chapter 5.
Figure 2: The Seven Types of Waste
Type oF wau-e Descriptinn Within the process industry Example syTrpLam
1. (her - Prcduc: Trade For no specitc
rr:UcttnixrI cucsrner
a Deveapr n oF a product, a
pTocL!--_ in i
Tr~xnurac-usinr-facility For no adtdiliial value
- As people, equiprnent or
pMduct waits to he procelsced it is not adding any value to the custoner
a Moving the pnxluct to
several lrcations - %hilst the prod-uct is in
mo.ion it is not being
processed and thereFare not adding value to the custorner * Storage of products,
intenediaes, raw materials, and si on. all costs rnney
'
When a particular pacess, step dues not ulidd value to
the product
* The excessive Tro.vetrent of
the people whi ope~re the
rmanufacturing Facility is
wasleFul. Whilst they are in
mI)tion they cannti support the procesing oF the product
-* Escessive movemrnlt Of
date, decisiosrs and
infTrati s
P-
Erors during the
proce$sv-either requiring Te-work or addiioarl wark
" Large carrpaign larsge botch end
corasncsuas large-scale manufacturing
pnocesos
* Developrmen of alt:emalive pnrxss TaLLes whki ch are not used in the developrrrenL oF
pnesses which do not support the
ottlene::k
" Redesign oF parts oF the manuFacluring
Facility which are -standardX e.g., reacto
* .S-oage tanks acting as pndxluct ufFers in.
the rnfrUffLturing process-waiting to be
pnressetd by Ow next step
* lnterrr.ediale product which cannot leave
site until lab lesIs and paperwnrk are
canplete
" Raw rnaLetials are mrade in several lrratin.s and transported in 4 -se silte
where a bulk interTrdiale is nude. This is
theri LTInsprT-ed tn anniher rile far linel
pnxILLCt processing
" Packaging frw custorner use may be aL a
sepaTae siLe
" Ticononr.icallr large fxtches of raw
Tr-rerial are purchased for large
carnpaignrs and it in the warehouse far
estendied periods
" Queued hatches af interre-diale material
Tray require specific warehausing ar segTegation especially iF the lab enalrsis
is yet i he completed or confirmed " A cautious approach to the design oF -unit
opertions can. esLend processing tirnes and can include steps, suh as hold or
te.:ing, which add no value
" The duplication of any sreps relaled to the
supply chain process. e.g.. sampling, checking
" People LTramspiring samples or drocumentation
" People required to mcrxve work in progress
to and FTarn the w-arehouse
" People Tequired to mreet with ather people
to corlirrn key decisions in the supply
chain process
" Peisle entering key data inks MRP ystems
" Material rul of specification; halch ditcurnentatinn incomplle " Dau and data entry errors
* General riscommunication
While lean has typically been applied to processes on the manufacturing floor, it can be successfully implemented across the whole supply chain. Specifically, Panwar (2015) discusses that while new and unfamiliar to processes outside of the factory line, lean thinking can and should be implemented elsewhere. With a cross-functional approach that focuses on long-term benefits, lean can help to standardize processes, increase service levels, and ensure proper communication across teams. Panwar goes on to
2. Waitinr 3. Transport 4. nventory 5. Over processing 6. \fstinn 7. Defects
" The essent oFwarehause sxpre needed ani usd
" Development and proiduction
organization irmbalurte
* An ever c han ging proces s (tweakel)
" Large engineering costs 'lime associated with facility modificaLiins.
* The large anraunt of Mwork in progreso' heit up in the
mnnuFactLirg prcess- oflen seen on the balance sheet and as 'piles oF
inventoiy' anend the site * Movenrent of pallets of inerreAliate
product aromund a sate o between sites * Large warehsussing and coitinual
Tnoaveir.nt of intermediate rmaterial on
and off sile rather than final product
* large baiuer stocks within a
ranuFacTuring feciLity and also large
warehousing on the site; linancially
seen as a huge use of working capital
" The Teac-ion. stage is typically complete with.in. T.inutes yet we
continue to prncess Far hars in days
" We have in process controls which
never shaw a Failure
" The delay of dncunents in
accrnpany linisheA product " Large tearns. of operators r.ving to
and Frarn the manufacturing unit but
less eclivily actually within the unit * Deta enLry being seen as a problem
within MRP systers
" Missed nr late orders
" Tixcessive ae-riTre
encourage both upstream and downstream involvement: incorporating both supplier and customer feedback is incredibly important.
While information and data are often abundant in large corporations, lean methodology can help to alleviate issues with the exchange of said information (Karlsson, 1996). Through the use of visual management tools and clear definition of team metrics, information is more easily transferred. Visual management tools allow for open access and increase transparency across stakeholders while metrics make requests for
information more predictable and acceptable. Both visual management tools and metrics that are developed should be clear and easy for all employees to understand. (Bevilacqua, 2015). Kovera (2014) writes that visual management tools are best when they provide both management and peers insight into progress against the
predetermined metrics. She goes on to say that "the best leaders, best teams, and best organizations leverage visual management tools to create a culture of adaptability, trust, respect, and continual learning that ensures a safe workplace (pg 36)."
3.3 Factory Startup Discussion
In establishing a new manufacturing environment or greenfield factory, there are many concerns that must be addressed for a successful factory startup. Most often, it is difficult to know how and where to start, but these decisions can have an incredible
impact on future factory performance. What is agreed upon is the need for a "holistic" approach to factory planning. With this in mind, a factory startup can occur in two ways:
1. Production planning includes the design of the factory layout, including the machines, people, and processes.
2. Production planning happens in a more iterative process as the factory is being designed and built, adapting to the constraints that become
apparent.
It is recommended that the design of the factory along with the planning of production happen in parallel to create a more adaptive process (Ackermann, 2013).
Arsenault (1998) believes the factory planning process is "objective and analogous to building a block wall (pg 2809)." It is necessary to follow a process that allows for the build up of steps for a successful factory launch; you cannot complete the steps at the top of the blocks before those on the bottom. Following this approach should reduce errors and delays.
Figure 3: Factory Planning Building Blocks
5. Financial
P40
DP sk~3.3.1 EuipmentPlang
4. Facility
npIs ar4nedd I~~ ________I ____3. Alternatives
man Nfi n e arli SrtedOM2. Technology Toolng achiapct of th pacty
1. Scope n p04rr rn l
3.3.1 Equipment Planning
Equipment is most often described in literature as the first item to consider when
planning for production. The following questions should start the equipment discussion (Lubash & Porter, 1997):
1. How many. pieces of equipment are needed?
2. How many fixtures are needed?
3. What is the desired daily capacity of the line?
4. How many operators are needed on the line?
5. What strategies maximize the throughput?
Because a greenfield is a blank slate, the installation of new equipment and processes comes without historical benchmarks and data to compare performance. Armed with the
answers to these questions, a model can be constructed to test how various machines would affect the line performance with little risk. Inputs into the model should include,
but are not limited to: process flow, product demands, equipment set-up, equipment capacity, staffing levels, process times, equipment downtime, lot size, and rework.
Careful record keeping and documentation eliminates the worry that any data is left out of the model (Lubash & Porter, 1997).
It is important to set and communicate standards and project deliverables to all supplier partners from the beginning. The starting point for selecting equipment should be the "large machines or plant installations that will form the core of the project (Schmidt, 2011, pg 15)." This choice is mainly a financial one, but it is also important as it sets the equipment standards for the smaller machines. Setting this precedent from the start will make it easier for engineers working on the plant to install the equipment and balance the line when production is set to begin. (Schmidt, 2011).
3.3.2 Automation Implementation
There are also many important questions to consider when it comes to the factory's automation system, including:
1. How far processes should be automated?
2. Whether all systems of the plant should be automated?
Establishing and planning for automation in stages is recommended: the initial factory will most likely not be fully automated, but knowing the future automation plans can help in selecting factory control systems. Such control systems should have the capacity to accommodate prospective automation technology. The way in which the plant will be operated is directly related to the automation system that is chosen (Schmidt, 2011). It is important to remember that a high rate of automation makes it far more difficult to
remain adaptive, most notably in the case with a higher variety of products (Ackermann, 2013).
3.3.3 Labor and Training
Based on factory planning and equipment requirements, a labor force will need to be trained to staff the factory. Zheng (2014) discusses a framework to decide the best
employee for the job. There are three different parameters through which to measure a possible employee: learning ability, skill at the job, and attitude. There are eight types of potential employees for which you have to adapt the training strategies for:
1. Good learning ability, low skill, bad attitude 2. Good learning ability, low skill, good attitude 3. Good learning ability, high skill, bad attitude 4. Good learning ability, high skill, good attitude 5. Bad learning ability, low skill, bad attitude 6. Bad learning ability, low skill, good attitude 7. Bad learning ability, high skill, bad attitude 8. Bad learning ability, high skills, good attitude
He goes on to discuss the need for specific metrics during the training process to show progress for the future factory workers. Rather than a "see and do" method, tangible metrics and standard operating procedures will produce a successful training.
Lanzara and Patriotta (2007) describe another framework, this time for conducting the training process. They advocate for the creation of a "manufacturing community" in order to institutionalize the manufacturing methods to the new labor force (pg 641). It is a four-step process:
1. Making the workforce: "an intensive formal training program based on classroom lectures and practical exercises (Lanzara and Patriotta, 2007, pg 641)."
2. Making the plant: co-locate training and "involve the future workforce in the construction of the factory (Lanzara and Patriotta, 2007, pg 643)."
3. Making the product: the "repetitive act of assembling and disassembling (Lanzara and Patriotta, 2007, pg 649)."
4. Closing the box: the establishment of "institutionalized rules and the collective task of manufacturing (Lanzara and Patriotta, 2007, pg 645)."
Through these distinct stages of training, the greenfield training experience gives the workers a heightened sense of community and "collective appropriation (643)." The new
labor force recognizes that they are part of something new, developing and training in parallel with the factory, itself.
3.3.4 Implementing Change
While process improvements can bring more efficiency to an organization, implementing the changes can be even harder than determining what to improve in the first place. Tensions and frictions are certain to arise as stakeholders struggle with their changing roles and tasks. Poor commitment from top management is one of leading reasons that process improvements fail. Without this support, employees lack the motivation to adopt the improvements. Another obstacle to implementing process improvements is the wrong choice of tool. With hundreds of improvement tools, an organization must be clear about its methodology for tool-choice. Stakeholders also need to be shown exactly
how these tools will be able to improve their tasks - leadership must detail with case studies and data to back up the claims (Tickle et al, 2014).
If the new process is to be accepted, it must become institutionalized across teams. The institutionalization happens in two phases: the creation of a template followed by
enaction and reproduction of the template. The template can take the form of cognitive tools such as rules, procedures, visual management systems, project management
applications, and so on. It is through this template that the standard operating procedures become clear to stakeholders. The template persuades stakeholders to adopt the common practices and provides a reference during the implementation of the change (Jensen et al, 2003). The implementation phase happens through inscription and delegation mechanisms. Inscription is the form of codifying the process and delegation ascribes action to stakeholders to complete the process (Lanzara and Patriotta, 2007).
4.0 The Current State
In order to develop a strategic plan for improvement, it is necessary to understand the current work process. This section provides an overview of the current state. The current state was defined as the state of the system from September 2014 thru September 2015. The current state research was very important because trying to improve the actions of others without truly understanding the current state of the processes and procedures of an organization is a recipe for failure. The current state map can be found in Appendix 1, laid out by work stream. Due to the proprietary nature of the work streams, summaries are provided in this chapter, but the details of the steps are not discussed. In addition, names are disguised as "Alpha," "Beta," etc.
4.1 Work Stream Methodology
To determine the critical path, research of the current process was conducted over a three-month period. The interviews, conversations, document gathering, and factory visits allowed stakeholders to detail the steps through which they completed tasks. During this process, stakeholders are asked to discuss the sequence of steps, the teams (both internal and external) that are involved in each process step, and the amount of time that each step takes. The following process was used when gathering information:
1. Overview of the project and goal of the research.
2. Explanation of the part of the current state that was to be discussed. 3. Explanation of the information that is needed to build a successful process
map (see above paragraph).
4. Mapping of tasks, steps, information flow, and stakeholders.
5. Discussion of key metrics through which to measure the success of each step (To be detailed in Chapter 5).
6. Clarification and opportunity for the employee to correct or modify any of the process steps.
Through this research, four work streams are defined: factory operations; legacy equipment for a pilot factory (later, referred to as a learning factory) and production factory; novel equipment for the production factory; and materials to be ordered for the learning factory and production factory.
4.2 Factory Operations
This work stream includes processes related to key decisions around product choice, factory location, and training of the new partner. Mapping the manufacturing steps to make footwear was conducted during the research and will be only briefly discussed due to proprietary concerns, though key learnings will be mentioned.
To teach the new partner how to make footwear, Nike established a learning factory line in location Alpha, separate from the production factory line, located in Beta. Nike also selected a current factory partner, Gamma, to supply components and general guidance throughout the learning process. Gamma was located in a third, separate location. Gamma was selected based on four characteristics:
1. Equipment Level: how sophisticated and well maintained is the existing equipment in the Gamma factory.
2. Capacity: bandwidth availability to assist in training based on the physical factory size.
3. Resources: bandwidth availability to assist in training based on labor. 4. Logistics: how easy or hard would it be to travel to the Gamma factory.
As this research details what happens before full-scale production began, products were made in Alpha on the learning factory line. This factory line was integral in teaching stakeholders how footwear is currently manufactured and how they could potentially be better manufactured in the future with new methods of manufacturing. As it pertains to the learning factory line, this section will discuss how factory workers are trained, how
products are chosen for new methods of manufacturing, and how the location for a production factory is determined.
4.2.1 Training
Training on the learning factory line was a cross-functional task for Nike. While the NFP team was ultimately responsible for helping to teach the front line workers, the process requires assistance from many areas of Nike's business. As the learning process began, key stakeholders outside of Advanced Manufacturing traveled to Alpha to transfer their knowledge to the new factory partner. Most often, the stakeholders would visit for a week at a time and teach as much as possible within that amount of time; they would then go back to the Nike campus, returning if there was a request for additional training. It is important to note the teaching was done through a "watch as I do"
methodology. For example, a machine expert would show those working on the learning factory line exactly how to use a specific machine or complete a certain stitch, expecting that the knowledge would be transferred.
The training process was crafted into three phases with added difficulties at each step: 1. Phase 1: Assembly of specific parts of the shoe
2. Phase 2: Assembly of all parts of shoe and full formation of the shoe 3. Phase 3: All of the above plus creation of the subcomponents of the shoe Gamma was integral at each of these steps because it supplied the input materials and the knowledge on footwear production. As part of the training process, the new factory partner was required to make a certain number of shoes by a due date. When the quantity was reached and the NFP team was comfortable, the new factory partner could move onto the next phase of training. It was expected that the new factory partner would grade its own products to measure quality. Quality checks were done at the end when a shoe was finished, but were most often cosmetic checks, as the new factory partner did not have any lab equipment to test tolerances of a shoe onsite. Tolerance testing was done by the Nike team and often took weeks to complete. It is important to note that a
member of the NFP team was always on site throughout the training process. There was no one that was stationed permanently, but NFP was diligent about maintaining supervision over the new factory partner.
4.2.2 Product Choice
Product choices for the learning process and production process are extremely
important and should not be approached lightly. Product choice was deliberated over a three-day period between two members of the NFP team. The team started this process by looking at three factors:
1. New Technology Roadmap: Nike creates a roadmap to plan out new technologies that could be incorporated into footwear over the next five to fifteen years. The NFP team examined which of these new technologies could be incorporated into the chosen product. NFP wanted to avoid teaching the new factory partner a possibly outdated manufacturing technology.
2. Ease of Manufacturability: By training the new factory partner on a product that was less complicated, the NFP team hoped that it could teach the partner the basics of shoe manufacturing before moving on to more advanced
products. Manufacturability was mostly determined by the number of parts in the shoe and number of steps in the process to manufacture the shoe. 3. Methods of Make: The NFP team evaluated whether new methods of
manufacturing could be incorporated into the production process of a specific model. Choosing a product that can only be manufactured by current
manufacturing processes would not be a good choice for the new factory partner as it negates the whole goal of the project.
Using these factors as a lens through which to evaluate the full Nike product line, the NFP team settled on ten preliminary models for the new factory partner to manufacture. It is important to note that the models would not be redesigned to make them easier to manufacture. Taking those ten models and researching which models would most
compliment the skills of the Gamma factory, the NFP team narrowed the pool to five models. These five models were then presented to the Advanced Manufacturing leadership, who again narrowed the pool to three models:
1. Model X: a running shoe that is widely available, globally and one that the Gamma factory currently manufactures. The Gamma factory is the number one producer of Model X with extensive experience on its production. 2. Model Y: a less common shoe, but one that would allow the new factory
partner to learn many different types of technologies on the roadmap, as well as investigate new methods of manufacturing. The Gamma factory has some, but not extensive experience making Model Y and there is also limited
demand for the shoe, worldwide; it exists in a niche market.
3. Model Z: also a running shoe that is widely available, though less so than Model X. Assembling the shoe is quite complicated and it contains parts that are only made in one factory in the world. The new factory partner would not be able to take on the manufacturing of that part as it is proprietary. There is worry that this part could become a bottleneck in assembly. Gamma has experience with Model Z and it would also allow the new partner to gain new skills as it relates to the new technology roadmap.
NFP then presented these models to the Manufacturing leadership, who decided that Model X would be produced because of its simplicity and ubiquity as a Nike product.
4.2.3 Factory Location
The locations of both the learning factory (Alpha) and production factory (Beta) are two more critical decisions for this process. The learning factory was chosen as it was close to the new factory partner's headquarters and provided fairly easy access for Nike. The
production factory was chosen based on a collaboration between the NFP team and the Ecosystem team. Various factors were considered: safety of factory location, available and existing footwear supplier network, and ease of travel to the factory for the partner
and Nike. It is important to note that Alpha and Beta were fairly far away from each other and were managed by different leadership. Also, Beta was chosen midway through the factory setup process; stakeholders were forced to make plans without full knowledge of where the factory would be.
4.3 Legacy Equipment Ordering
In order to implement new methods of manufacturing, the new factory partner needed to first master current manufacturing methods. To do this, the new partner would need to acquire machines used in factories that are currently making Nike footwear. Determining the types of machines, no less the exact machines was not an easy task. This work stream discusses how the NFP team decided on, ordered, and tracked the delivery of
legacy equipment that would be necessary for both the learning stages and production stages.
4.3.1 Phase 1
Each product has a specification diagram called a Product Flow Chart (PFC) that details the steps and machines necessarv to manifacture the product. A current factory partner in Asia creates the PFC as the shoe is being developed. With the PFC for Model X, the NFP team determined which equipment would be necessary for the assembly required in Phase 1. More often, though, the PFC is not detailed enough to know the exact type of equipment. For Phase 1, this was not a big problem as it was acceptable to find equipment that was close enough to the specifications because the new partner was simply getting familiar with the manufacturing process. About 80% of the equipment was ordered by the NFP team from internal manufacturing resources that had test
equipment on site. The new factory partner then purchased the equipment from Nike to be used in the Alpha factory. The remaining 20% of equipment was purchased from outside vendors with the help of the Ecosystem team. The new partner then purchased this equipment from Nike to be used in the Alpha factory.
4.3.2 Phase 2 and Phase 3
In the second and third phases of the learning process, equipment ordering became far more complicated as specific rather than general equipment was necessary. For
example, in Phase 1, it was acceptable to say the new partner would need a heat press that got to 50 degrees Celsius, but in Phase 2 and Phase 3, the specific brand, model,
and SKU was necessary for the machine. Following the same methodology as above, about 20% of equipment could be acquired from internal manufacturing resources within Nike and then sold to the new factory partner. The remaining 80% of equipment proved to be difficult to obtain.
4.3.3 Pre-Production
In the pre-production phase of the learning process, equipment needs were very specific as the equipment was destined for the production facility. The product was already determined and most of the learning had already been done in the learning facility. Information needed for the production equipment was entered into a common spreadsheet, shared with NFP, the new factory partner, and the Eco team. The NFP team input the type of equipment, the factory partner would determine exactly which piece of equipment was required down to the SKU and the Eco team would then put the order through. This worked fairly well as each stakeholder was familiar with the process at this point. Similar to Phases 2 and 3, Nike had to purchase all of the equipment due to secrecy reasons, and the new factory partner would then purchase the equipment from Nike.
4.4 Novel Equipment Ordering
After ordering legacy equipment, the new factory partner had to focus attention on new types of equipment that would be part of the new method of manufacturing strategy. This equipment required a much more difficult decision process: unlike the legacy
would be modernized, the NFP team and the new factory partner took multiple joint trips to the manufacturing lines in Asia. On those same trips, the new factory partner visited the Manufacturing Modernization innovation centers where modernized equipment was already being integrated into existing facilities. To decide which steps to modernize, priorities were set through the ROI, the availability of equipment, the project schedule and timelines, and the business priority determined internally. After the steps were selected, the new partner had to decide which equipment would be developed internally versus which equipment would be procured from the Manufacturing Modernization. While this decision was made jointly between the NFP team and the new factory partner, there was little alignment between the Advanced Manufacturing goals and the Manufacturing Modernization goals. Because of this, the new factory partner had to reverse many of their decisions to develop new equipment. They later realized that Manufacturing Modernization had already done exactly what they were doing. These types of confusions led to a large amount of rework and lost time.
4.5 Material Ordering
Material ordering followed a very similar process to that of the legacy equipment
ordering. The biggest difference was that in the early stages (Phase 1 and Phase 2) of the process, the Gamma factory was able to provide all the necessary material; Nike and new factory partner were able to rely very heavily on the knowledge of the Gamma factory leadership. While helpful throughout the beginning stages, this acted as a crutch for Phase 3 and the pre-production stages when material decisions had to be made. It was sometimes unclear who should be leading the material ordering: NFP, Eco, or the new factory partner. Similar to the pre-production equipment stage, stakeholders used a spreadsheet to coordinate the material ordering process.
5.0 Identifying Waste
In order to find inefficiencies in the current state, the process must be measured in some way. This section discusses the metrics through which to do so. Metrics are a key component to a successful process improvement as they provide an agreed upon way to measure. While it can be difficult to decide on the exact metrics to show success or failure in a process, this is an important step in the journey to improvement for an
organization. On the manufacturing floor, metrics might seem more obvious as it relates to productivity and factory output. But, when it comes to factory planning and the work done before production, metrics can sometimes be unclear. To remedy this, Fabrizio and Tapping apply lean methodology to the wastes often seen in an office environment. They arrive at these 7 deadly wastes:
1. Rework 2. Waiting 3. Unnecessary Motion 4. Over processing 5. Equipment downtime 6. Inventory/Storage
7. Inspection (Fabrizio and Tapping, 2006)
While it would have been preferable to investigate all seven of the wastes, due to time constraints and availability of stakeholders, only three of the wastes could be calculated for the steps in the process. The three metrics are: rework, wait time, and
over-processing. These three were chosen as they were straightforward to measure and could be applied to all the documented steps. Also, from the preliminary qualitative research, stakeholders consistently voiced concerns about rework, having to wait on other stakeholders, and the number of handoffs that occurred throughout the process.
5.1 Rework
Fabrizio and Tapping detail rework as "all the time spent redoing, correcting, or
projects should be performed correctly - the first time. This type of waste results in loss of valuable time, materials, equipment, and people-hours. An example of this is an incorrect entry of a piece of data or order requirement into an excel document. While this error seems benign, it can lead to production delays, late or incorrect deliveries, and even overtime costs.
After mapping out the current state, rework time is investigated (See Figure 4 below). Each process step is defined as a distinct task that had a beginning and ending as identified by stakeholders who were interviewed. Total time is the amount of time from when a stakeholder began the task to when it was completed. Rework time is the amount of time that the stakeholder spent correcting errors or redoing work throughout that task. Methods for calculating rework time include: time stamps on spreadsheets and documents, email conversation timelines, and recorded changes to other official forms. Names and details of tasks are removed. Steps are not in sequential order. Figure 4: Rework
Process Rework time Total time % Rework
Step (weeks) (weeks) Time
1 1 3 33% 2 2 4 50% 3 18 36 50% 4 5 10 50% 5 5 12 42% 6 1.5 4 38% 7 2 6 33% 8 2.5 8 31% 9 3 10 30% 10 1.5 5 30% 11 0.5 2 25% 12 1 4 25%
14 1 4 25% 15 5 20 25% 16 1 4 25% 17 8 44 18% 18 0.5 3 17% 19 4 24 17% 20 3 20 15% 21 0.5 4 13% 22 1.5 12 13% 23 0 4 0% 24 0 5 0% 5.2 Wait Time
Fabrizio and Tapping detail wait time as "idle time causing work to stop. It means that people and operations are idle." The act of waiting for anything in a process - "people, paper, machines, or information" - is a form of waste (Fabrizio and Tapping, 2006, pg
11). Often wait time is easily eliminated by simple process improvements that allow for better exchange of information. An example of wait time is: Team A needs a specific piece of data from Team B to place an equipment order. Unfortunately, until Team B supplies that piece of data, Team A cannot proceed with the order. Time is a resource that stakeholders can never recover. It is incredibly important to get rid of process wait time whenever possible.
After mapping out the current state, wait time is also documented in a similar fashion to rework (See Figure 5 below). Total time is the amount of time from when a stakeholder began the task to when it was completed. Wait time was more difficult to calculate than
rework time: it was calculated based on the delays that were communicated by
stakeholders. The same process steps are found below with their associated wait times. Figure 5: Waiting Time
Step Waiting Time Total time % Waiting
Number (weeks) (weeks) Time
1 1 3 33% 2 1 4 25% 3 11 36 31% 4 4 10 40% 5 2 12 17% 6 1 4 25% 7 2 6 33% 8 3 8 38% 9 1 10 10% 10 1 5 20% 11 0 2 0% 12 2 4 50% 13 4 8 50% 14 1 4 25% 15 4 20 20% 16 1 4 25% 17 14 44 32% 18 1 3 33% 19 8 24 33% 20 5 20 25% 21 1 4 25% 22 3 12 25% 23 1 4 25% 24 2 5 40%
5.3 Handoffs
Handoffs are a great measure of over-processing during a task or project. In this
process, a handoff is defined as an exchange of an item or piece of information between individuals or teams of stakeholders. Fabrizio and Tapping discuss how "putting work or effort into something a customer doesn't want or ask for is waste." Over-processing does not add value for the customer, and the customer will not pay for it (Fabrizio and Tapping, 2006, pg 12). As handoffs increase, so too does the non-value added work. Confusion on objectives and requirements increase the likelihood of over-processing, as stakeholders have to go back and forth to arrive at a final product. Fabrizio and Tapping believe that over-processing can be eliminated if goals are communicated properly across teams.
After mapping out the current state, the number of handoffs is also documented in a similar fashion to rework and wait time (See Figure 6 below). The same process steps are found below with their associated number of handoffs. While a low number of handoffs is desired, handoffs are inevitable. To address this issue, stakeholders were asked what the ideal number of handoffs would be if the process was at its most efficient. Those numbers can be found in the third column.
Figure 6: Handoffs
Step # of Desired # of
Number Handoffs Handoffs
1 8 5 2 8 4 3 10 6 4 11 6 5 6 4 6 6 5 7 10 7 8 11 6 9 3 3 10 4 3 11 4 3 12 3 3 13 5 4 14 8 7 15 13 8 16 6 4 17 10 7 18 4 3 19 15 9 20 11 8 21 5 4 22 4 4 23 4 3 24 3 3
5.4. Summary Statistics of Current State
While the current state steps are proprietary to Nike, providing insight into the
complexity of the process is important. Key statistics in the current state process map: - Duration of Process: 1 year (September 2014 to September 2015)
- Total work time (value-add + non value-add): 256 person-weeks
A person-week is defined as the amount of time that a person works over the unit of time of a week.
- Value-add time: 112.5 person-weeks - Non-value-add time: 143.5 person-weeks e Number of Tasks: 166
- Number of Teams involved: 10 - Number of Decision-Points: 43
A decision-point is a point at which a member of the team had to make a decision about how to proceed in the process.
6.0 Kaizen Methodology
In this chapter, the Kaizen methods of continuous improvement are discussed. With the above metrics of rework, wait-time, and handoffs to signal areas that needed
improvement, Kaizen was used as a means to improve the process.
6.1 Background
The word Kaizen in Japanese is written with two kanji characters: one meaning, "to change" and the other meaning, "for the better." While the origins of the word Kaizen are not completely known, the term has roots as far back as 1644 in China with a similar meaning of improvement. When Fredrick Taylor and Frank Gilbreth began to popularize standardization and process improvement, the Japanese adopted Kaizen as the word to properly summarize their methods of improvement.
The Kaizen way of life includes fives main steps for process improvement: 1. Identify the Problem
2. Establish a Goal
3. Identify a Better Means
4. Propose and Evaluate the Method 5. Implement Improvement
It is incredibly important for employees to take part in the Kaizen process, as they must feel empowered to better methods they know and practice so well (Kato and Smalley, 2011).
To implement Kaizen in the NFP factory onboarding process, members of the Advanced Manufacturing team took part in a Kaizen event to provide suggestions and tangible ways to improve. The new factory partner was also consulted.
6.2 Process
The agenda for the Kaizen event is as follows:
1. Current State: Stakeholders were guided through the current state work-streams and encouraged to provide feedback.
2. Problem Areas: In this case, a problem area is defined as a task that slows down the onboarding process and was difficult for team members to
complete. Problem areas that were identified based on the aforementioned metrics were discussed with stakeholders. Participants were encouraged to bring up any other problem areas from their qualitative experience. The problem areas that were seen from the metrics matched those from the stakeholders. The top three problem areas were chosen as the main topic for the Kaizen event.
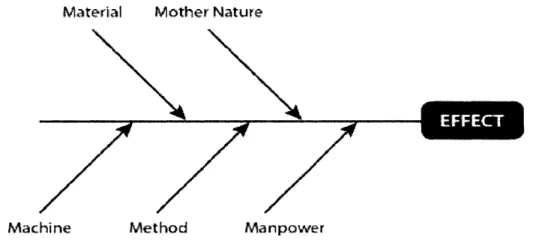
3. Root cause analysis: Using lean methods, such as the 5-Whys and Fishbone diagrams, root causes were identified for each of the bottlenecks.
4. Solution/Implementation: Stakeholders provided possible solutions and implementation ideas to solve the root cause problems.
6.3 Findings
6.3.1 Current State
A standard Kaizen event would have stakeholders define the current state during the event as the first part of the day. But, to save time, this was done prior to the event through interviews and other documentation as mentioned above. Also detailed above, four work streams were defined for the current state: factory operations; legacy
equipment for the learning factory and production factory; novel equipment for the production factory; and materials to be ordered for the learning factory and production factory.