HAL Id: hal-00452366
https://hal.archives-ouvertes.fr/hal-00452366
Submitted on 2 Feb 2010HAL is a multi-disciplinary open access archive for the deposit and dissemination of sci-entific research documents, whether they are pub-lished or not. The documents may come from teaching and research institutions in France or abroad, or from public or private research centers.
L’archive ouverte pluridisciplinaire HAL, est destinée au dépôt et à la diffusion de documents scientifiques de niveau recherche, publiés ou non, émanant des établissements d’enseignement et de recherche français ou étrangers, des laboratoires publics ou privés.
Nitrogen and carbon isotope values of individual amino
acids: a tool to study foraging ecology of penguins in the
Southern Ocean
Anne Lorrain, Brittany Graham, Frédéric Ménard, Brian Popp, S. Bouillon,
Peter van Breugel, Yves Cherel
To cite this version:
Anne Lorrain, Brittany Graham, Frédéric Ménard, Brian Popp, S. Bouillon, et al.. Nitrogen and carbon isotope values of individual amino acids: a tool to study foraging ecology of penguins in the Southern Ocean. Marine Ecology Progress Series, Inter Research, 2009, 391, pp.293-306. �hal-00452366�
Nitrogen and carbon isotope values of individual amino acids: a tool to study foraging ecology of penguins in the Southern Ocean
1 2 3 4 5 6 7 8 9 10 11 12 13 14 15 16 17 18 19 20 21 22 23 24 25 26
Anne Lorrain1, Brittany Graham2,3, Frédéric Ménard4, Brian Popp5, Steven Bouillon6,7,8, Peter van Breugel6, and Yves Cherel9
1
IRD/LEMAR, Centre IRD de Brest, BP 70, 29280 Plouzané, France
2
Department of Oceanography, University of Hawaii, USA
3
SINLAB, Canadian Rivers Institute, University of New Brunswick, Fredericton, New
Brunswick, Canada E3B 5A3
4
IRD, UMR 212 EME, Centre de Recherche Halieutique (CRH), Sète Cedex, France
5
Department of Geology and Geophysics, University of Hawaii, USA
6
NIOO-KNAW, Yerseke, The Netherlands
7
Vrije Universiteit Brussel, Dept. of Analytical and Environmental Chemistry, Brussels
8
Katholieke Universiteit Leuven, Dept. of Earth & Environmental Sciences
9
CEBC, UPR 1934 du CNRS, BP 14, 79360 Villiers-en-Bois, France
Running header: Compound-specific isotope analysis and penguin isotopic niches
ABSTRACT 27 28 29 30 31 32 33 34 35 36 37 38 39 40 41 42 43 44 45
We determined the δ15N and δ13C values of individual amino acids (AAs) isolated from chick blood of four penguin species that forage in different oceanic regions (from the subtropics of the Indian Ocean to Antarctica) to test if (1) the δ15N values of phenylalanine (δ15Nphe) revealed different foraging areas among the species, (2) the difference between
glutamic acid and phenylalanine δ15N values (Δδ15N
glu-phe) accurately predicted trophic levels
(TL), and (3) the δ13C value of AAs could resolve species foraging locations, as bulk δ13C values did. The δ13C values of all AAs decreased with latitude, were positively correlated with bulk δ13C data, and therefore, tracked the isotopic baseline. However, we were not able to discern additional ecological information from these δ13C values. In contrast, the δ15N analysis of individual AAs in blood distinguished the isotopic value of the nitrogen at the base of the food web from the trophic level of the consumer, providing new insight for the study of the trophic ecology of seabirds. The difference in the bulk δ15N values of northern and southern rockhopper penguins was due to both a difference in their foraging location (≠δ15Nphe) and their trophic levels (≠Δδ15Nglu-phe). The δ15Nphe values of king and Adélie
penguins were higher than those from rockhoppers and we hypothesize that this difference reflects foraging on mesopelagic prey and in the highly productive Antarctic shelf waters respectively. The Δδ15N
glu-phe accurately reflected relative penguin’s TL but further work is
INTRODUCTION 46 47 48 49 50 51 52 53 54 55 56 57 58 59 60 61 62 63 64 65 66 67 68 69 70
Determining dietary preference together with foraging habitat of marine predators is challenging because of the extent of their pelagic environment and their long-distant movements. Traditionally, the diet of predators has been determined by stomach content, bulk stable isotope, and fatty acid analyses (Hyslop 1980; Michener & Schell 1994; Iverson et al. 2004). Foraging habitat can be investigated with tagging technologies (Wienecke et al. 2000, Charrassin & Bost 2001, Bost et al., 1997) or by linking a predator’s stable isotope compositions to the isotope values of the local environment (Lee et al. 2005; Wallace et al. 2006; Cherel et al. 2006, 2007). The δ13C and δ15N values of phytoplankton at the base of
marine food webs can vary greatly due to different factors including phytoplankton community composition, nutrient utilization, differences in nutrient sources (e.g., denitrification vs. N2 fixation) and the subsequent biological transformations of these
nutrients (Altabet 2001; Sigman and Casciotti 2001; Karsh et al. 2003; Montoya 2007; Tamelander et al. 2009). The resulting spatial gradients in phytoplankton or zooplankton δ13C
and δ15N values (e.g., inshore/offshore, pelagic/benthic, latitudinal) have been shown to propagate up to consumers and have served as proxies for foraging habitat (Best and Schell 1996). For example, bulk δ13C values have been used to determine the foraging habitats of cetaceans and seabirds (Best & Schell 1996; Cherel et al. 2006, 2007; Quillfeldt et al. 2005) and bulk δ15N analyses have been used to delineate temporal changes in the foraging regions
of marine mammals (e.g., Burton & Koch 1999; Newsome et al. 2007). However, only a few of these studies directly compare the baseline and predator isotope values (Lee et al. 2005). Instead, the spatial variation in the isotopic baseline is inferred by knowledge of the local oceanography and from previous studies that measured proxies for the isotopic baseline (e.g., POM, zooplankton, etc.) (Cherel & Hobson 2007; Ménard et al. 2007). A spatial knowledge
71 72 73 74 75 76 77 78 79 80 81 82 83 84 85 86 87 88 89 90 91 92 93 94
of baseline isotope variations and an understanding of the physiology and ecology of the marine predator are required for robust interpretation of the bulk δ13C and δ15N values of predators. However, characterizing the isotopic baseline at the scale of ocean basins is logistically challenging (Jennings & Warr 2003) and speculative for historical periods when archived specimens are examined.
Recent evidence suggests that compound-specific isotopic analyses (CSIA) of individual amino acids isolated from marine consumers could distinguish the isotopic value of the nitrogen at the base of the food web from the trophic level of the consumer (McCelland & Montoya 2002; Popp et al. 2007; Hannides et al. 2009). Results of the laboratory experiments of McClelland and Montoya (2002) showed that the δ15N value of “trophic” AAs (e.g.,
glutamic acid) can be enriched by as much as ~ 7‰ in the marine rotifer Brachionus plicatilis relative to the δ15N value in the alga Tetraselmis suecica, whereas other “source” AAs (e.g., phenylalanine) are little affected by trophic status and retain the δ15N values of the phytoplankton at the base of this food web. The implication of these results are that both trophic level and the nitrogen isotopic baseline where predators foraged can be determined by analyzing the δ15N values of individual amino acids isolated from a predator’s tissue (see also Schmidt et al. 2003; Hannides et al. 2009). However to date, CSIA of individual AAs has been mainly applied to low trophic levels (McCelland & Montoya 2002; Schmidt et al. 2004; Hannides et al. 2009), with only one vertebrate predator study (tuna, Popp et al. 2007), and no work has yet been conducted on birds or mammals. Carbon CSIA on individual AAs has mainly focused on the metabolic pathways of animals (e.g., O’Brien et al. 2005) but the results of Fantle et al. (1999) on blue crabs suggested that the δ13C values of individual amino acids (both essential and non essential AAs) could complement bulk results to decipher a consumer’s food sources.
In this paper, we analyzed the δ15N and δ13C values of individual amino acids isolated
from chick blood of four Southern Ocean penguin species: the northern rockhopper (NRP,
Eudyptes chrysocome moseleyi), southern rockhopper (SRP, Eudyptes chrysocome
chrysocome), king (KP, Aptenodytes patagonicus) and Adélie (AP, Pygoscelis adeliae)
penguins. These Southern Ocean penguins could be ideal species to test the efficacy of amino acid δ15N and δ13C analyses to determine the ecological niches of seabirds as their food habits and foraging habitats are well documented and diverse (details in Cherel & Hobson, 2007). Both bulk stable isotope and stomach content analyses showed different foraging strategies among these species (e.g., fish vs. crustaceans, see Table 1). Furthermore, their foraging habitats differ (see Table 1 and related references) and their breeding colonies are located at sites encompassing a large latitudinal range, from the subtropical Amsterdam Island north of the Subtropical Front, the Crozet Island in the Polar Frontal Zone to Adélie Island, Antarctica (Table 1). These regions exhibit different oceanographic characteristics (temperature, chlorophyll a concentrations, sea ice extent) that could lead to spatial variations in the carbon and nitrogen isotopic compositions at the base of the food web (Fig 1; Altabet & François 1994; Trull & Armand 2001). In the southwest Indian Ocean, the δ13C and δ15N values of particulate organic matter show an abrupt decrease between 40 and 45°S (François et al. 1993; Altabet & François 1994) leading to a north-south gradient across the subtropical frontal zone. This latitudinal gradient can however be complicated by inshore-off shore productivity gradients (Cherel and Hobson, 2007), the influence of blooms and nutrient utilization (Karsh et al. 2003; Tamelander et al. 2009), the mixing of water masses across the frontal zone, and the contribution of sea ice phytoplankton to the food web (Hobson et al. 1995; Gibson et al. 1999; Norkko et al. 2007).
95 96 97 98 99 100 101 102 103 104 105 106 107 108 109 110 111 112 113 114 115 116 117 118 119
The present study is the first to analyze carbon and nitrogen isotopes of individual amino acids in seabirds, and also the first to analyze amino acids isolated from whole blood. It
120 121 122 123 124 125 126 127 128 129 130 131 132 133 134 135 136 137 138 139 140 141 142 143 144
should be noted that adult penguins can segregate their diet from the food they feed their chicks (Cherel 2008). This study is limited to the chicks’ diet and the adults’ foraging areas when they feed their chicks, but does not relate to the adult’s diet. Based on our current knowledge on this species, three predictions were tested:
1. Northern rockhopper penguin chicks (NRP) have δ15N values 2.4‰ higher than those of Southern Rockhopper penguin chicks (SRP, Cherel & Hobson 2007). As NRP forage in the Subtropical Zone where δ15N values of particulate organic matter (POM) are higher than at latitudes North of the front (Altabet & François 1994), we expect this bulk isotopic difference to be mainly due to isotopic baseline differences. Since phenylalanine (phe) is a source amino acid and should reflect the isotopic baseline, the δ15N
phe values in the blood of
NRP should be higher compared to SRP that forage within the Polar Frontal Zone (Cherel & Hobson 2007).
2. King penguins feed heavily upon fish relative to SRP, NRP and AP, which mainly prey upon crustaceans. Thus KP should have the highest trophic level (Cherel et al. 2007, 2008) and we therefore predict KP to have the greatest difference between source and trophic amino acid δ 15N values.
3. High-latitude oceanic ecosystems (without considering onshore-offshore gradients) typically have much lower POM δ13C values than subtropical regions (François et al. 1993; Goericke & Fry 1994) and reflect the δ13C values of phytoplankton (Popp et al. 1999). The bulk δ13C values of these penguins decreased with increasing latitude, which was attributed to
the difference in the δ13C values of the baseline in their respective foraging areas (Cherel & Hobson, 2007). If some AAs provide information about the carbon source incorporated in food webs, the δ13C values of these AAs should also track spatial variations in the δ13C values and we expect the δ13C value of some specific AAs to decrease with increasing latitude, similar to the bulk δ13C values.
MATERIALS AND METHODS 145 146 147 148 149 150 151 152 153 154 155 156 157 158 159 160 161 162 163 164 165 166 167 168 169 Sample collection
A detailed description of breeding colony sites, collection methods and bulk isotope analyses for these penguin samples can be found in Cherel & Hobson (2007) and in Table 1. We present here only a brief description of the methods used to collect blood samples from penguin chicks. Four different species of penguins were sampled from 3 different breeding areas during the austral summer 2001-2002 (Fig. 1). Northern and southern rockhopper penguins were collected from Amsterdam and Crozet Islands, respectively. King penguins were also collected from Crozet Islands, while Adélie penguins were collected at Pointe Géologie Archipelago, Adélie Island, Antarctica. Chicks were sampled at the end of the chick-rearing period when the majority of growth has already occurred to minimize any growth effect on blood δ15N values (Sears et al. 2009). During this period, food is only
provided by the adults and, therefore, the isotopic values of chick blood will reflect their diet and the foraging locations of adults. Chicks were selected at random from each site and whole blood was collected via venipuncture, stored in 70% ethanol and then at -20ºC until analysis. Storage in 70% ethanol does not alter the bulk δ15N values of blood (Hobson et al. 1997;
Bugoni et al. 2008) while some studies reported a slight increase on bulk δ13C values of blood. Lipids were not removed from these samples as it has been show that its low lipid content does not necessitate lipid extraction (Cherel et al. 2005).
Sample preparation for compound-specific nitrogen isotope analysis
Prior to compound-specific stable isotope analysis (CSIA), ethanol was evaporated and the whole blood samples were freeze-dried. Blood samples from three chicks from each species were selected for CSIA. Preparation of blood samples for CSIA followed previous
170 171 172 173 174 175 176 177 178 179 180 181 182 183 184 185 186 187 188 189 190 191 192 193 194
protocols for muscle samples (e.g., Popp et al. 2007; Hannides et al. 2009). Only an overview of the CSIA method is presented here and we refer the reader to Popp et al. (2007) and Hannides et al. (2009) for specific details on the methods and materials. To hydrolyzed samples, 4-6 mg of dried (whole) blood were transferred to high-temperature reaction vials, ~1 mL 6N HCl added, heated to 150°C for 70 minutes, and cooled. These hydrolysates were evaporated and the residue redissolved in 1 mL 0.01N HCl and the solution filtered (0.2 µm). The solution was further purified using the cation-exchange method of Metges et al. (1996). Prior to the derivatization, samples were re-acidified.
Amino acid derivatization included esterification of the carboxyl terminus followed by trifluoracetylation of the amine group. Samples were esterified using 4:1 isopropanol:acetyl chloride and by heating at 110°C for 60 min. Samples were dried and acylated by the addition of 3:1 methylene chloride: trifluoroacetic anhydride (TFAA) and heating at 100°C for 15 minutes. The derivatized samples were further purified using the method of Ueda et al. (1989). Finally, to insure complete derivatization of the samples, the TFAA acylation step was repeated. The resulting TFA derivatives were stored in 3:1 methylene chloride:trifluoroacetic anhydride at 4°C.
Compound-specific δ15N Stable Isotope Analyses
The δ15N values of individual amino acids were analyzed by isotope ratio monitoring
gas chromatography-mass spectrometry (irmGCMS) using a ThermoFinnigan Delta-Plus XP mass spectrometer interfaced to a Trace GC gas chromatograph through a GC-C III combustion furnace (980°C), reduction furnace (680°C), and liquid nitrogen cold trap. L-2-aminoadipic acid (AAA), for which the δ15N value was known, was co-injected as an internal reference. Samples (1-3 µl), plus the AAA reference, were injected (split/splitless, 5:1 split ratio) onto a 50 m HP Ultra-2 column (0.32 mm i.d., 0.5 µm film thickness) at an injector
temperature of 180°C and a constant helium flow rate of 2 mL min-1. The column oven was initially held at 50°C for 2 min, ramped to 190°C at 8°C min-1 and then to 280°C at 10°C min-1, and finally held at 280°C for 10 min. The irm-GCMS method allowed isotopic determination of alanine, glycine, leucine, isoleucine, proline, aspartic acid, glutamic acid, phenylalanine, and histidine. Samples were analyzed at least in triplicate and the measured isotopic ratios were normalized to the δ15N value of the aminoadipic acid reference peak in each chromatogram. Reproducibility associated with these isotopic measurements averaged 0.8‰ and ranged from 0.1 to 1.8‰. All δ15N values are reported relative to AIR.
195 196 197 198 199 200 201 202 203 204 205 206 207 208 209 210 211 212 213 214 215 216 217 218 219
Sample preparation for compound-specific carbon isotope analysis
For δ13C measurements on individual total hydrolyzable amino acids (THAA), 2.3 to 7.5 mg of freeze-dried blood was homogenized and hydrolyzed at 110°C in 1 mL 6M HCl in screw-cap vials with a N2 headspace. After addition of an internal standard (Norleucine), the
hydrolysate was evaporated under a gentle N2 flow at 60°C. The dried THAA extracts were
redissolved in MQ water and stored frozen (-20°C). Prior to analyses on the HPLC-IRMS, samples were centrifuged at 3000 rpm for 10 min.
Compound-specific δ13C Stable Isotope Analyses
The δ13C values of specific amino acids were analyzed using a modified HPLC-IRMS
method, based on the protocol suggested by McCullagh et al. (2006). A Surveyor HPLC was coupled to a Finnigan Delta V IRMS via the LC Isolink interface (Thermo Electron, Bremen). Amino acid separation was performed using a Primesep A column (3.2 X 250 mm, particle size 5 μm, pore size 100Å, Sielc Technologies, Prospect Heights, IL, USA) by applying a gradient program with two mobile phases (100% H2O (Milli-Q) and 0.2 %(v/v) H2SO4,
220 221 222 223 224 225 226 227 228 229 230 231 232 233 234 235 236 237 238 239 240 241 242 243
phase composition. Pure H2O was used for the first 22 min, after which the mobile phase was
switched to linearly increase to 100% 0.2% H2SO4 after 75 min. The mobile phase then
remained at 0.2% H2SO4 for 40 min and switched back to 100% H2O until the end of the run
(138 min). All mobile phase and reagent solutions were ultrasonically degassed under reduced pressure prior to use, and stock solutions were continuously purged with He during analysis. The column flow rate was kept stable at 500 μL min-1 at 22°C. All samples were analyzed with 10 μL partial loop injections using a 50 μL injection loop.
Separated amino acids eluting from the HPLC are oxidized online with a mixture of 0.67 M sodium peroxidisulfate (Merck, Darmstadt) and 1.5 M phosphoric acid (Fluka Sigma Aldrich, Buchs) at 99.9°C. The flow of both reagents is kept at 30 μL min-1. The resulting
CO2 is extracted from the liquid in a phase separator with a 1 mL He flow (see Krummen et
al. 2004). The He containing the CO2 from the individual amino acids is dried over a Nafion
tube and subsequently transferred to the IRMS through an open split.
To calibrate δ13C values of amino acids, a mixture of individual amino acid laboratory reference compounds was used. The δ13C values of these compounds were determined
independently with an EA-IRMS using IAEA-CH-6 and an internal laboratory reference compound (Schimmelmann acetanilide). The δ13C value of each of these compounds was previously calibrated using NBS 19 and SVEC on the VPDB scale where NBS-19 and L-SVEC are defined as exactly +1.95 and -46.6‰, respectively (Coplen et al., 2006). Individual AA calibration was required because the offset in δ13C values between measurements made
on the HPLC-IRMS and those obtained on the EA-IRMS were different for some amino acids (corrections ranged between -3.8 ‰ for glycine and +5.7 ‰ for threonine). Repeated analyses of glycine over a range of concentrations (200-1000 ng C) showed excellent reproducibility, with the δ13C value averaging -39.8 ± 0.15‰ (n=15).
244 245 246 247 248 249 250 251 252 253 254 255 256 257 258 259 260 261 262 263 264 265 266 267 268
The Primsep A column is a mixed-mode column, with negatively charged functional groups due to the embedded anionic ion-pairing reagent. Amino acids with more than one charge state within the pH range (e.g., aspartic acid and glutamic acid) have retention times that shift in function of the mobile phase pH, which can result in co-elution of amino acid peaks. In the analytical conditions used here, glutamic acid, cysteine and serine showed co-elution, as well as, isoleucine, norleucine and leucine and were therefore not considered in this study. Six amino acids were analyzed for both δ15N and δ13C values (alanine, aspartic
acid, histidine, glycine, phenylalanine and proline).
Statistical modeling of AA δ15N values
Statistical analyses must account for the different sources of variation induced by the sampling strategy, and for the small number of samples analyzed. First, blood samples were collected from several individuals per species (two or three individuals selected at random). Secondly, several replicates were performed on each blood sample (at least three replicates, but some amino acid isotope data were removed because of peak co-elution). Simple averages cannot account for the within-individual variability and for the between-individual variability. On the contrary, linear mixed-effects models (LME model; Pinheiro & Bates 2000) are well suited to deal with unbalanced sampling schemes and they allow different sources of variation to be included. In our case, we coped with replicates per blood sample, and with several individuals per species. Therefore, LME models were fitted to the δ15N values of individual
amino acids, and data were grouped by individual (measurement replicates) and by species. The individual effect was treated as random variations around a population mean. The species effects represent average characteristics of the populations of the four penguin species (i.e., the fixed effect in LME terms). These models allowed us to predict population values of AA δ15N for each penguin species. These predicted values were then used as the best estimates as
269 270 271 272 273 274 275 276 277 278 279 280 281 282 283
they account for the different sources of variation. Parameter estimation used the maximum likelihood method and all computations and tests were performed in S-Plus.
Comparison of source AA δ15N values and trophic level estimates.
These LME models were applied to predict population values of δ15N
glu and δ15Nphe
for each species. Indeed, following Schmidt et al. (2004), we assumed (i) that phenylalanine does not fractionate between trophic levels (i.e., a source amino acid), (ii) that glutamic acid demonstrates a step-wise trophic enrichment (i.e., a trophic amino acid) from one trophic level to the next above the primary producers, and (iii) therefore that Δδ15N
glu-phe = δ15Nglu −
δ15N
phe can be considered as an index of trophic level for each penguin species. We then
computed Δδ15N
glu-phe for each replicate and modeled these data with an extra LME model.
Finally, population predicted values of Δδ15N
glu-phe from the LME model were used to
compare the relative trophic levels of each penguin species.
In addition, a trophic level (TL) for each penguin species can be estimated from the equation of Hannides et al. (2009):
1 ) N ( - ) N ( 15 glu-phe penguin phe -glu 15 + ⎥ ⎥ ⎦ ⎤ ⎢ ⎢ ⎣ ⎡ Δ Δ = TEF
TLpenguin δ δ phytoplankton (1),
284 285 286 287 288 289 290 291
where TEF is the trophic enrichment factor that results from a shift in one trophic level. Equation 1 has three unknown variables: TLpenguin, (Δδ15Nglu-phe)phytoplankton, and TEF. The trophic enrichment factor has been determined directly and indirectly to be ~7‰ for samples of fish and crustaceans muscle tissue and whole organisms (McClelland and Montoya 2002; Schmidt et al. 2004; Popp et al. 2007). In addition, (Δδ15N
glu-phe)phytoplankton was set to 4‰, i.e. the value obtained by McClelland and Montoya (2002) in their lab cultures of the marine alga
292 293 294 295 296 297 298 299 300 301 302 303 304 305 306 307 308 309 310 311 312 313 314 315
been rigorously tested, they have produced reasonable TL estimates for marine zooplankton (Hannides et al. 2009), krill (Schmidt et al. 2004), and yellowfin tuna (Popp et al. 2007).
RESULTS
Patterns in δ15N Amino acid values
Bulk δ15N values ranged 3.7‰ among all the penguin blood samples (Table 2; Cherel
and Hobson 2007). The δ15N values of amino acids (AAs) isolated from penguin chick's
blood ranged from -0.2 to +26.0‰ (Table 2; Fig. 2). The trophic AAs (glutamic acid, alanine, aspartic acid, isoleucine, leucine and proline; mean: 17.9 ± 3.0‰) were enriched in 15N relative to the source AAs (glycine, phenylalanine and histidine; mean: 5.1 ± 3.5‰) (Table 2). Aspartic acid (asp) (mean: 14.7 ± 2.1‰) showed the least 15N enrichment of the trophic AAs. Among the source AAs, glycine (gly) (mean: 9.2 ± 2.8‰) was enriched in 15N relative to phenylalanine (phe) (mean: 2.5 ± 1.2‰) and δ15N
gly values did not reflect the species-specific
patterns observed in δ15N
phe values (Table 2; Fig. 2). Except for gly and asp, the patterns
observed in amino acid δ15N values of penguin chicks followed previous CSIA trends in
trophic and source AAs measured in marine invertebrates and fish (McClelland & Montoya 2002; Schmidt et al. 2004; Popp et al. 2007; Hannides et al. 2009).
The linear mixed-effects models fitted to the δ15N
phe and to the δ15Nglu data indicated
that the species effect was significant (p=0.022 and p=0.002, respectively). The δ15N
phe and
δ15N
glu differed then by penguin species (Table 2). Adélie penguins (AP) had the highest
LME estimated δ15N
phe values (3.5±0.3‰), whereas southern rockhopper penguins had the
lowest LME estimated values (1.1±0.5‰). Fig. 3 displays the LME values with their standard errors (SE) for the four species. Northern rockhopper penguins had LME predicted δ15N
316 317 318 319 320 321 322 323 324 325 326 327 328 329 330 331 332 333 334 335 336 337 338 339 340
values (2.1±0.5‰) higher than SRP (1.1±0.5‰) while king penguins (KP) had moderate δ15N
phe values (2.6±0.5‰).
Trophic level of Southern Ocean penguins
Table 4 displays the LME estimates for the index of trophic level Δδ15N
glu-phe for the
four species. The species effect was significant (p = 0.018). Among penguin species, KP had the highest index of trophic level (Δδ15N
glu-phe = 17.2‰, Table 3), and SRP had the lowest
(Δδ15N
glu-phe = 14.1‰). Estimates for NRP and AP were close, with a slightly higher Δδ15N glu-phe for NRP (15.5 vs 15.0‰).
Using Eq. 1 with a TEF of 7‰ and a Δδ15N
glu-phe in phytoplankton of 4‰, provided
consistent underestimates of TL (2.6, 2.4, 2.9 and 2.6 for NRP, SRP, KP and AP respectively) relative to independent TL estimates based on bulk stable isotope analyses for three of the four species (4.0, 4.5 and 3.9 for SRP, KP and AP, respectively; see Table 4, Cherel et al. 2008). To match these TL, a TEF for penguin chick’s blood was calculated. This TEF estimation is based on the model estimated differences (Δδ15N
glu-phe, see Table 4) and a
Δδ15N
glu-phe of 4‰ for phytoplankton (McClelland & Montoya 2002). Given these
assumptions (these will be addressed in the Discussion), the new TEF would be 3.4, 3.8 and 3.8‰ for SRP, KP and AP respectively (3.6‰ on average), which is less than the 7‰ cited in previous studies.
Patterns in δ13C Amino acid values
While bulk δ13C values ranged 5.5‰ among the penguin samples (see Table 1 and 3),
the δ13C values of AAs isolated from penguin chick's blood ranged from -5.0 to -34.0‰
(Table 3; Fig. 2, 4). There was no clear pattern of 13C enrichment related to essential (arginine, histidine, lysine, phenylalanine, threonine) and non-essential essential AAs
341 342 343 344 345 346 347 348 349 350 351 352 353 354 355 356 357 358 359 360 361 362 363 364 365
(alanine, aspartic acid, glycine, and proline) (Table 3; Fig. 2). Instead, there were three general δ13C groups of amino acids, where 2 of the 3 groups included both essential and
non-essential non-essential AAs: (1) a group of AAs with high 13C enrichment (threonine, glycine, and histidine, mean: -9.9 ± 2.3‰), (2) an intermediate group of AAs with δ13C values similar to
bulk δ13C values (proline, alanine, phenylalanine, aspartic acid, and lysine, mean: -22.2 ±
4.3‰), and (3) a final group of only essential AAs that were very depleted in 13C (arginine, mean: -31.3 ± 1.6‰). The bimodal pattern observed in the δ15N values of source and trophic AAs was not seen in the δ13C values. Instead, the δ13C values of all AAs decreased with
increasing latitude, which mirrored the bulk carbon isotope trend (Fig. 4a). A covariance analysis showed that a model with separate slopes for bulk and all the AAs was justified compared to a model with parallel regressions (p = 0.006). Slopes varied between -0.10 ± 0.03 (lys) and -0.26 ± 0.03 (pro) with one group of four AAs having parallel slopes with bulk (phe, his, arg and gly, Fig. 4a). In addition, the links between the δ13C values of all AAs and
bulk were investigated with an extra covariance analysis: the model with separate slopes was significant (p = 0.002; Fig 4b). Slopes varied between 0.52 ± 0.18 (thr) and 1.51 ± 0.18 (pro). For six AAs (pro, ala, gly, arg, lys and phe) the correlation between bulk and AA-specific δ13C was highly significant (R² > 0.8 and p < 0.01), but there are clearly different patterns in
the slope of the relationship (Fig. 4b). Looking at those AAs where there is a good correlation between bulk and AA-specific δ13C: for all non-essential AAs but asp, the slope is >1, i.e. the range in δ13C-AAs is higher than in the bulk. In contrast, for all the essential ones the slope is < 1. From all AAs that have good correlation with both bulk and latitude, phenylalanine has the closest values to the bulk.
DISCUSSION 366 367 368 369 370 371 372 373 374 375 376 377 378 379 380 381 382 383 384 385 386 387 388 389 390
Penguin δ15N values and foraging habitat (hypothesis 1)
Small but significant differences were found in δ15Nphe values among penguin species
(maximum range 3‰). These results suggest then that phenylalanine δ15N values can be used as a source AAs to study the foraging habitat of penguins. Northern Rockhopper penguins’ δ15N
phe values were higher – even if the difference is relatively small - than SRP δ15Nphe
values (2.1±0.5‰ vs. 1.1±0.5‰), which confirms the hypothesis of Cherel & Hobson (2007) that the observed difference in their bulk δ15N value (2.4‰) relates in part to differences in
the isotopic baseline of their foraging regions. The nitrogen isotopic composition of particulate matter is higher in the Subtropical Frontal Zone north of 40-45°S where NRP forage (Table 1, Tremblay et al. 2003) than at latitudes south of 45°S in the Southwest Indian Ocean (from 5 to -2‰, see Altabet & François 1994), i.e., where southern rockhopper penguins forage close to Crozet Island (Table 1). These north-south δ15N gradients have also
been found in modern sediments collected from the NE Indian Ocean, which demonstrates that these spatial gradients can be robust in the Southern Ocean (Altabet & François 1994).
The highest δ15N
phe values were observed for king and Adélie penguins that forage at
the highest latitudes in the Southern Ocean. Previous tagging and observational data suggests that these penguins forage at the Polar Front (~50°S) and over the Antarctic shelf (~66°S), respectively (Wienecke et al. 2000; Charrassin & Bost 2001). Both of these oceanic regions are south of the Subtropical Front where one would have expected low baseline δ15N values (-1 to -2‰; Altabet & François (-1994; Lourey et al. 2003). However, several factors can lead to elevated δ15N and δ13C values at the base of the food web. The elevated δ15Nphe values
observed in these penguins could be explained by different processes: a) a local increase in the δ15N value of the isotopic baseline (neritic vs. oceanic waters, high nutrient utilization by
391 392 393 394 395 396 397 398 399 400 401 402 403 404 405 406 407 408 409 410 411 412 413 414 415
phytoplankton, or sea ice influence) or b) a difference in the vertical foraging habitat, with penguins foraging on a greater proportion of mesopelagic prey that have elevated δ15N values. A local region can have high baseline δ15N value because of extensive NO3- utilization after a
large phytoplankton bloom (Tamelander et al. 2009). From Fig. 1, high chlorophyll a concentrations are located near Crozet Island and Adélie Land. However, the waters close to Crozet Islands are deep and well-mixed and the injection of new NO3- to the surface waters
will not produce high POM δ15N values because the NO3- pool size is already large. On the
other hand, over the Antarctic shelf, the water column is stratified, and nitrogen delivery to the surface waters, and the subsequent uptake by phytoplankton will lead to high δ15N values of the POM. Trull et al. (2008) showed a 2‰ increase in the δ15N values of POM on
Kerguelen plateau relative to δ15N values of POM collected off the plateau. The higher δ15N values of POM were attributed to an increase in the uptake of NO3- by phytoplankton on the
Kerguelen plateau. Neritic waters found above plateaus or coastal shelves can then have higher δ15N values at the base of the food web compared to offshore oceanic regions. Accordingly, the isotopic baseline of the waters directly surrounding the Antarctic shelf may be higher than offshore waters. Adélie penguins forage within 50 km of their Antarctic colonies (Cherel et al. 2008). Therefore, the relatively high δ15N
phe values observed in Adélie
penguins could reflect their neritic foraging behavior in waters above the Antarctic shelf. Finally, the high δ15N values of Adélie penguins could be explained by feeding in a food web supported in part by sea ice phytoplankton, which has been shown to have elevated δ13C and δ15N values (Hobson et al., 1995; Norkko et al. 2007).
The high δ15Nphe values of king penguins that forage in the polar front could be
explained by the relative importance of mesopelagic prey in their diet (prey leaving around 300-500m). Previous studies have suggested there is a positive depth gradient in the δ15N
Trull et al. 2008). Saino & Hattori (1980) found an overall increase of 9‰ in POM δ15N between 0 and 1000m in the NE Indian Ocean and Trull et al. (2008) found +0.5‰ with depth on Kerguelen plateau up to 140m. If this nitrogen is incorporated and conserved in the foodweb, then prey that forage at depth (below 100-200m) should have higher δ15N values
that similar prey in the surface waters (Rau et al. 1989; Graham et al. 2007). Mintenbeck et al. (2007) showed a significant increase in the δ15N values of benthic suspension feeders with water depth on the Weddell Sea shelf (up to 1000 m). Thus, if predators forage on a greater proportion of mesopelagic prey, their δ15N
phe values would be higher than those of consumers
feeding in the same region, but on a more epipelagic resource. King penguins make deep dives to forage, regularly exceeding 150 m depth (Kooyman et al. 1992), and feeding almost exclusively on mesopelagic fish of the family Myctophidae, while other penguins (including AP, NRP, SRP) dive to shallower depths and mainly prey upon crustaceans (Cherel et al. 1993, 2007, Rodary et al. 2000; Tremblay & Cherel 2003, Cherel 2008).
416 417 418 419 420 421 422 423 424 425 426 427 428 429 430 431 432 433 434 435 436 437 438 439 440 The δ15N
phe values of SRP and NRP suggest that they do not forage in the same
oceanic regions and that the difference in their bulk δ15N values is due in part to baseline differences. These results also revealed that northern rockhoppers, king and Adélie penguins have close δ15N values, which would have remained unclear without knowledge on their ecology and feeding behavior (i.e., inshore vs. offshore feeding, deep feeding). Phenylalanine can then be used as a source AA that records baseline δ15N variations in penguins, but we
recommend analyzing a larger number of individuals and interpreting the δ15Nphe data with
additional ecological information on the studied species.
Penguin δ15N values and trophic levels (hypothesis 2)
Results of previous stomach content and bulk stable isotope analyses suggest that king penguins have a higher trophic level than southern rockhoppers and Adelie penguins (Cherel
441 442 443 444 445 446 447 448 449 450 451 452 453 454 455 456 457 458 459 460 461 462 463 464 465
et al. 2008). The compound-specific isotope data supports these observations, as the difference between the δ15N values of trophic (glutamic acid) and source (phenylalanine) amino acids was greatest in king penguins (17.2‰, Table 4). If bulk isotope δ15N values (Table 1) are interpreted only in the context of variations in trophic ecology, NRP (9.2‰) was at a lower trophic level than AP (10.1‰), and SRP (6.8‰) was at the lowest TL. The amino acid δ15N data however indicated that NRP had a higher Δδ15N
glu-phe value, or trophic level,
than both SRP (15.5 vs. 14.1‰) and AP (15.5 vs. 15.0‰). These conclusions are consistent with stomach content analysis, which indicate that NRP fed on squids and crustaceans, whereas, SRP and AP forage mostly on crustaceans (Table 1). The bulk δ15N difference (2.4‰) between NRP and SRP is therefore not only due to baseline difference as discussed previously, but also to a difference in their trophic level.
Our study thus suggests that the δ15N analyses of individual amino acids, such as glutamic acid and phenylalanine, can provide an opportunity to distinguish the relative influence of baseline variations and trophic level on the bulk δ15N values of penguins. However, using equation 1 and a trophic enrichment factor of 7‰ (cf. McClelland & Montoya 2002), the trophic level of penguin chicks ranged from 2.6 to 2.9. A trophic level lower than 3 is not possible for these penguins as they are strictly carnivorous (Cherel et al. 1993, 2008). For example, king penguin is a myctophid-eater, and myctophids forage mainly on meso- and macrozooplankton, including some herbivorous, omnivorous and even carnivorous species. Consequently, a TL of king penguins cannot be lower than 4. To match the expected TLs for penguins, and considering that the 4‰ phytoplankton Δδ15N
glu-phe is
correct, a new TEF of 3.6‰ (see results) has to be used. Assuming this TEFblood of 3.6‰ and
a value of 4‰ for the Δδ15N
glu-phe value for phytoplankton, this study produced the first
estimate of TL for Northern Rockhopper penguin chicks (4.2) and we find a TL for SRP, KP and AP to be 3.8, 4.6 and 4.0 respectively. However, the Δδ15N
466 467 468 469 470 471 472 473 474 475 476 477 478 479 480 481 482 483 484 485 486 487 488 489
is not well constrained, and it could also explain why the results from equation 1 consistently under-estimated the TL for these penguins. Although our dataset suggests that the 7‰ trophic enrichment factor is not correct for blood tissue collected from penguins, uncertainty still exists in this emerging ecological method (e.g., TL estimates from Cherel et al. 2008, Δδ15N
glu-phe value for phytoplankton) and trophic enrichment factors should be determined
with experimental work conducted on a diverse assemblage of consumers.
To conclude, the δ15N values of glutamic acid and phenylalanine in penguin blood ( Δδ15N
glu-phe) successfully estimated the relative trophic level of the different species of
penguins. However before absolute TLs can be calculated, controlled experiments should be performed on seabirds and their diet to better constrain the TEFblood and the Δδ15Nglu-phe value
for phytoplankton.
Penguin δ13C values and foraging habitat (hypothesis 3)
Variations in bulk δ13C values have been interpreted as differences in the foraging habitats of the four penguin species and to corresponding spatial differences in the δ13C values at the base of the food web (Cherel & Hobson 2007). Strong spatial gradients have been observed in the Southern Ocean, with a ~9‰ decrease in the δ13C values of POM from low to high latitudes (François et al. 1993; Popp et al. 1999; Trull et al. 2001). The laboratory and field results of Fantle et al. (1999) showed that the essential amino acids (E AAs) valine, leucine and phenylalanine did not exhibit significant 13C enrichment from the diet and had lower δ13C values than the non-essential amino acids (NE AAs). Based upon these observations we predicted that essential AAs would mirror the latitudinal bulk isotopic trends exhibited in Southern Ocean phytoplankton, i.e., the δ13C values of E AAs in penguins that
The δ13C values of 6 AAs (phe, lys, arg, gly, pro, ala) had very good correlation with
bulk δ13C values (R² > 0.8) and decreased with increasing latitude, suggesting that these AAs
track δ13C baseline variations. In contrast to what has been found in blue crabs (Fantle et al. 1999), the δ13C values of E AAs do not segregate relative to NE AAs in penguin’s blood. Both E AAs and NE AAs had higher δ13C values than bulk δ13C values. Interestingly, all E AAs exhibited lower slopes relative to bulk δ13C values meaning that the range of variation in these specific AAs δ13C values was lower relative to bulk δ13C values, while NE AAs (except for aspartic acid) had higher ranges. We are unable to interpret this pattern with our current understanding of carbon isotope fractionation of specific amino acids in seabirds. As such, applying carbon CSIA to determine the foraging ecology and location of marine consumers is not straightforward, and may not even be applicable. Without baseline or prey δ13C data, it is not possible to determine if some E AAs fractionate or not relative to their diet. In an experimental study conducted on fish, McCullagh et al. (2008) also found that there was no clear pattern in 13C fractionation relative to essentiality of AAs. Instead these authors found that only phenylalanine showed no isotopic difference between the δ13C value of the consumer and its diet. In our study, phenylalanine had δ13C values close to the bulk values for all penguin species, which suggest that it may be the most appropriate amino acid to track changes in the baseline δ13C values and determine a marine consumer’s foraging habitat. If one specific AA had to be chosen for simultaneous C and N isotope analysis, we propose phenylalanine which has the closest values relative to bulk, and is also a source AA for nitrogen. 490 491 492 493 494 495 496 497 498 499 500 501 502 503 504 505 506 507 508 509 510 511 512 513 514 CONCLUSION
515 516 517 518 519 520 521 522 523 524 525 526 527 528 529 530 531 532 533 534 535 536 537 538 539
Few studies have been conducted on carbon and nitrogen isotope analyses of individual amino acids, and none of them examined seabirds. This study shows for the first time that the δ15N values of individual amino acids, such as glutamic acid as a trophic AA and phenylalanine as a source AA, can be used to study the foraging ecology of penguins. These results further support the use of compound-specific δ15N isotope analysis to determine the
foraging areas and trophic levels of marine consumers, from primary consumers to top predators. Previous analyses however focused on muscle and whole body while this study examined blood. Our results suggest that blood can be used to estimate relative trophic levels, but that the trophic enrichment factor reported in previous studies (i.e., 7‰) might not be appropriate to calculate absolute TL in penguins, and, in general, seabirds. Controlled experiments are therefore needed to better constrain the TEFblood value for penguins. The δ13C
values of 6 individual AAs tracked δ13C isotopic baseline but without additional CSIA data on the diet or base of the food web, we were unable to further interpret the δ13C values of specific amino acids isolated from penguin blood. Our study however suggests that glutamic acid (δ15N) and phenylalanine (for both δ15N and δ13C) could be key individual amino acids to
study the foraging habitat and behavior of marine consumers.
Acknowledgements
The authors thank T. Rust and C. Hannides for their help in δ15N analyses and J. Middelburg, and B. Veuger for having made possible δ13C analyses on the penguin samples.
We also greatly thank S. Sokolov for providing Indian Ocean fronts’ positions and Chl a data from Fig. 1, and M. Patriat and P Lopez for map and figure processing. This work was supported financially by the Program REMIGE – ANR Biodiversité 2005-011 and partially by the Netherlands Organisation for Scientific Research for carbon analyses.
References 540 541 542 543 544 545 546 547 548 549 550 551 552 553 554 555 556 557 558 559 560 561 562 563
Altabet MA, François R (1994) Sedimentary nitrogen isotopic ratio as a recorder for surface ocean nitrate utilization. Glob Biogeochem Cycles 8:103-116
Best PB, Schell DM (1996) Stable isotopes in southern right whale (Eubalaena australis) baleen as indicators of seasonal movements, feeding and growth. Mar Biol 124:483-494 Bost CA, Georges JY, Guinet C, Cherel Y, Pütz K, Charrassin JB, Handrich Y, Zorn T, Lage
J, Le Maho Y (1997) Foraging habitat and food intake of satellite-tracked king penguins during the austral summer at Crozet Archipelago. Mar Ecol Prog Ser 150: 21-33
Bugoni L, McGill RAR, Furness RW (2008) Effects of preservation methods on stable isotope signatures in bird tissues. Rapid Commun Mass Spectrom 22: 2457-2462
Burton RK, Koch PL (1999) Isotopic tracking of foraging and long-distance migration in northeastern Pacific pinnipeds, Oecologia 119: 578–585
Charrassin JB, Bost CA (2001) Utilisation of oceanic habitat by king penguins over the annual cycle. Mar Ecol Prog Ser 221:285-297
Cherel Y, Verdon C, Ridoux V (1993) Seasonal importance of oceanic myctophids in king penguin diet at Crozet Islands. Polar Biol 13:355-357
Cherel Y, Hobson KA, Hassani S (2005) Isotopic discrimination between food and blood and feathers of captive penguins: implications for dietary studies in the wild. Physiol Biochem Zool 78:106-115
Cherel Y, Phillips RA, Hobson KA, McGill R (2006) Stable isotope evidence of diverse species-specific and individual wintering strategies in seabirds. Biol Lett 2:301-303
Cherel Y, Hobson KA (2007) Geographical variation in carbon stable isotope signatures of marine predators: a tool to investigate their foraging areas in the Southern Ocean. Mar Ecol Prog Ser 329:281-287
564 565 566 567 568 569 570 571 572 573 574 575 576 577 578 579 580 581 582 583 584 585 586
Cherel Y, Hobson KA, Guinet C, Vanpé C (2007) Stable isotopes document seasonal changes in trophic niches and winter forating individual specialisation in diving predators from the Southern Ocean. J Anim Ecol 76, 826-836
Cherel Y (2008) Isotopic niches of emperor and Adélie penguins in Adélie Land, Antarctica. Mar Biol 154:813-821
Cherel Y, Ducatez S, Fontaine C, Richard P, Guinet C (2008) Stable isotopes reveal the trophic position and mesopelagic fish diet of female southern elephant seals breeding on the Kerguelen Islands. Mar Ecol Prog Ser 370:239-247
Coplen TB, Brand WA, Gehre M, Gröning M, Meijer HAJ, Toman B, Verkouteren RM (2006): New guidelines for δ13C measurements. Anal Chem 78: 2439-2441
Deniro MJ, Epstein S (1981) Influence of diet on the distribution of nitrogen isotopes in animals. Geochim Cosmochim Acta 45:341-351
Dore JE, Brum JR, Tupas LM, Karl DM (2002) Seasonal and interannual variability in sources of nitrogen supporting export in the oligotrophic subtropical North Pacific Ocean. Limnol Oceanogr 47:1595-1607
Fantle MS, Dittel AI, Schwalm SM, Epifanio CE, Fogel ML (1999) A food web analysis of the juvenile blue crab, Callinectes sapidus, using stable isotopes in whole animals and individual amino acids. Oecologia 120:416-426
François R, Altabet MA, Goericke R (1993) Changes in the δ13C of surface water particulate
matter across the Subtropical Convergence in the SW Indian Ocean. Global Biogeochem Cycles 7:627-644
Fry B (1988) Food web structure on Georges Bank from stable C, N, and S isotopic compositions. Limnol Oceanogr 33:1182-1190
587 588 589 590 591 592 593 594 595 596 597 598 599 600
Gibson JAE, Trull TW, Nichols PD, Summons RE, McMinn A (1999) Sedimentation of 13C-rich organic matter from Antarctic sea-ice algae: a potential indicator of past sea-ice extent. Geology 27: 331-334
Goericke R, Fry B (1994) Variations of marine plankton δ13C with latitude, temperature, and
dissolved CO2 in the world ocean. Global Biogeochem Cycles 8:85-90
Gouretski VV, Koltermann KP (2004) WOCE Global Hydrographic Climatology. A Technical Report 35, Berichte des BSH
Graham BS, Grubbs D, Holland K, Popp BN (2007) A rapid ontogenetic shift in the diet of juvenile yellowfin tuna from Hawaii. Mar Biol 150:647-658
Hannides, CCS, Popp BN, Landry MR, Graham BS (2009) Quantification of zooplankton trophic position in the North Pacific Subtropical Gyre using stable nitrogen isotopes. Limnol and Oceanogr 54(1) 50-61
Hobson KA, Clark RG (1992) Assessing avian diets using stable isotopes II: Factors influencing diet-tissue fractionation. The condor 94: 189-197
601 602 603 604 605 606 607 608 609 610 611
Hobson KA, Ambrose WG Jr, Renaud PE (1995) Sources of primary production, benthic-pelagic coupling, and trophic relationships within the Northeast Water Polynya: insights from δ13C and δ15N analysis. Mar Ecol Prog Ser 128: 1-10
Hobson KA, Gibbs HL, Gloutney ML (1997) Preservation of blood and tissue samples for stable-carbon and stable nitrogen isotope analysis. Can J Zool 75:1720–1723
Hyslop EJ (1980) Stomach content analysis. A review of methods and their application. J Fish Biol 17:411-429
Iverson SJ, Field C, Bowen WD, Blanchard W (2004) Quantitative fatty acid signature analysis: a new method of estimating predator diets. Ecological Monographs 74:211-235 Jennings S, Warr KJ (2003) Environmental correlates of large-scale spatial variation in the
612 613 614 615 616 617 618 619 620 621 622 623 624 625 626 627 628 629 630 631 632 633 634 635
Karsh KL, Trull TW, Lourey MJ, Sigman DM (2003) Relationship of nitrogen isotope fractionation to phytoplankton size and iron availability during the Southern Ocean Iron RElease Experiment (SOIREE). Limnol and Oceanogr 48: 1058-1068
Kooyman GL, Cherel Y, Le Maho Y, Croxall JP, Thorson PH, Ridoux V, Kooyman CA (1992) Diving behavior and energetics during foraging cycles in King Penguins. Ecol Monogr 62:143-163
Krummen M, Hilkert AW, Juchelka D, Duhr A, Schluter HJ, Pesch R (2004) A new concept for isotope ratio monitoring liquid chromatography/mass spectrometry. Rapid Commun Mass Spectrom 18: 2260-2266
Lee SH, Schell DM, McDonald TL, Richardson WJ (2005) Regional and seasonal feeding by bowhead whales Balaena mysticetus as indicated by stable isotope ratios. Mar Ecol Prog Ser 285:271-285
Lourey MJ, Trull TW, Sigman DM (2003) Sensitivity of δ15N of nitrate, surface suspended and deep sinking particulate nitrogen to seasonal nitrate depletion in the Southern Ocean. Global Biogeoche Global Biogeochem Cycles 17: 1081, doi:10.1029/2002GB001973 McClelland JW, Montoya JP (2002) Trophic relationships and the nitrogen isotopic
composition of amino acids in plankton. Ecology 83:2173-2180
McCullagh JSO, Juchelka D, Hedges REM (2006) Analysis of amino acid 13C abundance from human and faunal bone collagen using liquid chromatography isotope ratio mass spectrometry. Rapid Commun Mass Spectrom 20: 2761-2768
McCullagh JSO, Gaye-Siessegger J, Focken U (2008) Determination of underivatized amino acid δ13C by liquid chromatography/isotope ratio mass spectrometry for nutritional studies: the effect of dietary non-essential amino acid profile on the isotopic signature of individual amino acids in fish. Rapid Commun Mass Spectrom 22: 1817-1822
Ménard F, Lorrain A, Potier M, Marsac F (2007) Isotopic evidence of distinct feeding ecologies and movement patterns in two migratory predators (yellowfin tuna and swordfish) of the western Indian Ocean. Mar Biol 153: 141-152
636 637 638 639 640 641 642 643 644 645 646 647 648 649 650 651 652 653 654 655 656 657 658 659 660
Metges CC, Petzke K, Hennig U (1996) Gas chromatography/combustion/isotope ratio mass spectrometric comparison of N-acetyl- and N-pivaloyl amino acid esters to measure 15N isotopic abundances in physiological samples: a pilot study on amino acid synthesis in the upper gastrointestinal tract of minipigs. J Mass Spectrom 31:367-376
Michener RH, Schell DM (1994) Stable isotope ratios as tracers in marine aquatic food webs. In: Lajtha, K. and Michener, R.H., Editors, 1994. Stable isotopes in ecology and environmental sciences, Blackwell Scientific Publications, Oxford, pp. 138–157
Mintenbeck K, Jacob U, Knust R, Arntz WE, Brey T (2007) Depth-dependence in stable isotope ratio δ15N of benthic POM consumers: The role of particle dynamics and organism trophic guild. Deep-Sea Res I 54: 1015-1023
Newsome SD, Martinez del Rio C, Bearhop S, Phillips DL (2007) A niche for isotopic ecology. Frontiers Ecol Environ 5(8):429-436
Norkko A, Trish SF, Cummings VJ, Gibbs MM, Andrew NL, Norkko J, Schwarz AM (2007) Trophic structure of coastal Antarctic food webs associated with changes in sea ice and food supply. Ecology 88: 2810–2820
O'Brien DM, Boggs CL, Fogel ML (2005) The amino acids used in reproduction by butterflies: a comparative study of dietary sources using compound specific stable isotope analysis. Physiological and Biochemical Zoology 78(5):819-827
Pinheiro JC, Bates DM (2000) Mixed-effects models in S and SPLUS. Springer, New York Popp BN, Trull T, Kenig F, Wakeham SG, Rust TM, Tilbrook B, Griffiths FB, Wright SW,
Marchant HJ, Bidigare RR, Laws EA (1999) Controls on the carbon isotopic compositions of Southern Ocean phytoplankton. Global Biogeochem Cycles 13: 827–844
661 662 663 664 665 666 667 668 669 670 671 672 673 674 675 676 677 678 679 680 681 682 683 684 685 686
Popp BN, Graham BS, Olson RJ, Hannides CCS, Lott MJ, Lopez-Ibarra GA, Galván-Magaña F, Fry B (2007) Insight into the trophic ecology of yellowfin tuna, Thunnus albacares, from compound-specific nitrogen isotope analysis of proteinaceous amino acids. In Dawson T. and Siegwolf R. (eds) Stable Isotopes as Indicators of Ecological Change, Elsevier Academic Press pp. 173-190
Quillfeldt P, McGill RAR, Furness RW (2005) Diet and foraging areas of Southern Ocean seabirds and their prey inferred from stable isotopes: review and case study of Wilson's storm-petrel. Mar Ecol Prog Ser 295:295–304
Rau GH, Heyraud M, Cherry RD (1989) 15N/14N and 13C/12C in mesopelagic shrimp from the northeast Atlantic Ocean: evidence for differences in diet. Deep Sea Res 36:1103-1110 Rodary D, Wienecke BC, Bost CA (2000) Diving behaviour of Adélie penguins (Pygoscelis
adeliae) at Dumont D’Urville, Antarctica: nocturnal patterns of diving and rapid
adaptations to changes in sea-ice condition. Polar Biol 23:113-120
Saino T, Hattori A (1980) 15N natural abundance in oceanic suspended particulate matter. Nature 28: 752-754
Saino T, Hattori A (1987) Geographical variation of the water column distribution of suspended particulate organic nitrogen and its 15N natural abundance in the Pacific and its marginal seas. Deep-Sea Res 34:807-827
Schmidt K, McClelland JW, Mente E, Montoya JP, Atkinson A, Voss M (2004) Trophic-level interpretation based on δ15N values: implications of tissue-specific fractionation and
amino acid composition. Mar Ecol Prog Ser 266:43-58
Sears J, Hatch SA, O’Brien DM (2009) Disentangling effects of growth and nutritional status on seabird stable isotope ratios. Oecologia 159:41-48
Sokolov S, Rintoul SR (2002) Structure of Southern Ocean fronts at 140°E. J Mar Sys 37: 151-184
687 688 689 690 691 692 693 694 695 696 697 698 699 700 701 702 703 704 705 706 707 708 709 710 711
Circumpolar Current and surface chlorophyll concentrations in the Southern Ocean. J Geophys Res 112: C07030, doi:10.1029/2006JC004072
Sokolov S, Rintoul SR (2009) The circulation structure and distribution of the Antarctic Circumpolar Current fronts. Part 1: Mean circumpolar paths. J Geophys Res in press Tamelander T, Kivimä C, Bellerby RGJ, Renaud PE, Kristiansen S (2009) Base-line
variations in stable isotope values in an Arctic marine ecosystem: effects of carbon and nitrogen uptake by phytoplankton. Hydrobiol DOI: 10.1007/s10750-009-9780-2. Tremblay Y, Cherel Y (2003) Geographic variation in the foraging behavior, diet and chick
growth of rockhopper penguins. Mar Ecol Prog Ser 251: 279-297
Trull TW, Armand L (2001) Insights into Southern Ocean carbon export from the δ13C of particles and dissolved inorganic carbon during the SOIREE iron release experiment. Deep-Sea Res II 48:2655–2680
Trull TW, Daviesa D, Cascottie K (2008) Insights into nutrient assimilation and export in naturally iron-fertilized waters of the Southern Ocean from nitrogen, carbon and oxygen isotopes. Deep-Sea Res II 55: 220-240
Vanderklift MA, Ponsard S (2003) Sources of variation in consumer-diet δ15N enrichment: a
meta-analysis. Oecologia 136:169-182
Vander Zanden MJ, Rasmussen JB (2001) Variation in δ15N and δ13C trophic fractionation: Implications for aquatic food web studies Limnol Oceanogr 46: 2061-2066
Wallace B, Seminoff J, Kilham S, Spotila J, Dutton P (2006) Leatherback turtles as oceanographic indicators: stable isotope analyses reveal a trophic dichotomy between ocean basins. Mar Biol 149:953-960
Wienecke BC, Lawless R, Rodary D, Bost CA, Thomson R, Pauly T, Robertson G, Kerry KR, Le Maho Y (2000) Adélie penguin foraging behaviour and krill abundance along the Wilkes and Adélie Land coasts, Antarctica. Deep-Sea Res II 47:2573-2587
Table 1. Foraging characteristics and blood δ13C and δ15N values of penguin species during the chick-rearing period.
Species Locations Foraging areas Foraging range
(km)
Chick diet δ13C (‰)* δ15N (‰)* References
Northern rockhopper penguin Amsterdam (37.8°S) Subtropical
Zone < 10 Squid & crustaceans -19.5 ± 0.3 (n=10) 9.2 ± 0.3 (n=10)
Tremblay & Cherel (2003)
Southern rockhopper penguin Crozet (46.42°S) Polar Frontal
Zone
< 10 Crustaceans -21.2 ± 0.1
(n=10)
6.8 ± 0.3 (n=10)
Tremblay & Cherel (2003)
King penguin Crozet (46.42°S) Polar Front
(50°S) 340-450 Pelagic fish -22.6 ± 0.1 (n=10) 10.3 ± 0.2 (n=10) Cherel et al. (1993) Charrassin & Bost (2001)
Adélie penguin Adélie Land (66.7°S) Antarctic Zone < 50 Crustaceans
(fish) -24.8 ± 0.5 (n=9) 10.1 ± 0.8 (n=9) Wienecke et al. (2000) * Bulk values of whole blood of penguin chicks during the austral summer 2001-2002 from Cherel and Hobson (2007).
Table 2. δ15N values of the bulk sample and isolated amino acids (AAs) of blood collected from penguin chicks from the southern Indian Ocean.
Source AAs are indicated by bold print. nc means not considered because of peak co-elution. LME estimate for each species (mean ± SE) were calculated with linear mixed-effect models that accounted for the heterogeneity of the data set (see methods).
Amino acid δ15N values
Bulk δ15N phe his gly leu isoleu glu pro asp ala
Northern rockhopper penguin (NRP), 37,8ºS
NRP 1 9.2 2.5 3.0 6.9 18.5 19.7 19.0 23.9 14.6 20.3 3.1 2.9 5.6 17.2 17.4 18.3 22.4 14.0 19.8 1.6 0.9 3.9 16.1 17.7 16.0 20.4 13.8 18.7 1.7 2.2 4.7 17.2 18.1 16.3 23.6 13.0 19.8 NRP 2 9.2 2.4 1.2 5.7 18.4 19.5 17.5 21.8 13.3 18.5 1.5 2.9 5.5 18.3 19.4 18.0 23.8 14.1 19.3 2.6 3.6 7.7 18.2 17.8 16.2 25.4 14.7 20.1 1.7 5.1 8.8 18.8 20.4 19.9 26.0 15.4 20.7 LME estimate 2.1±0.5 2.7±1.4 6.1±0.8 17.8±0.5 18.8±0.7 17.7±0.6 23.4±0.7 14.1±0.5 19.7±0.4
Southern rockhopper penguin (SRP). 46.7ºS
SRP 1 6.8 1.1 2.7 9.6 12.8 12.8 14.8 16.4 12.0 16.8 1.7 1.0 7.9 12.7 13.2 14.0 16.5 12.9 16.3 1.4 1.3 7.8 13.1 14.4 14.9 17.4 11.9 15.8 1.1 2.2 7.9 12.7 12.6 15.8 16.0 11.1 16.4 SRP 2 6.8 -0.2 4.7 6.4 13.5 14.4 15.5 19.0 12.0 16.6 1.8 5.9 8.6 15.0 15.2 16.1 18.0 12.4 17.3 1.2 7.6 7.3 14.8 14.4 15.5 17.5 12.4 17.3 LME estimate 1.1±0.5 3.9±1.4 7.9±0.8 13.6±0.5 13.9±0.8 15.2±0.6 17.3±0.7 12.1±0.5 16.6±0.4
King Penguin (KP). 50.0ºS KP 1 10.4 2.8 nc 13.6 19.8 21.5 20.2 22.4 18.4 22.3 3.0 nc 14.5 nc nc 22.0 24.6 19.3 22.9 4.1 7.7 12.2 20.0 21.8 21.5 23.2 18.0 21.3 2.5 5.3 11.5 20.1 20.4 21.4 22.1 18.2 21.0 KP 2 10.5 2.5 5.0 nc 19.6 nc 19.7 23.1 nc nc 2.0 4.5 nc 20.1 nc 19.5 23.1 18.1 nc 1.0 3.0 nc 19.9 nc 17.4 21.2 nc nc KP 3 10.5 2.7 4.4 nc 19.3 18.6 18.8 20.7 15.9 20.6 2.3 2.3 11.2 18.9 18.4 18.7 21.2 16.4 21.2 3.8 5.9 12.8 20.9 nc 20.0 22.4 17.8 22.3 LME estimate 2.6±0.5 4.9±1.3 12.6±0.9 19.8±0.4 20.0±0.8 19.9±0.6 22.4±0.7 17.7±0.5 21.7±0.4
Adélie Penguin (AP). 66.7ºS
AP 1 9.5 3.1 9.0 8.8 16.7 15.8 18.6 18.6 14.4 21.0 3.8 5.7 9.7 17.2 15.4 18.3 18.7 13.6 21.8 2.9 5.7 7.9 16.4 16.2 18.2 18.3 13.8 20.1 AP 2 10.0 1.4 1.7 10.9 16.5 16.0 17.4 17.3 14.0 19.4 3.7 3.6 13.2 18.2 17.9 20.1 19.5 15.3 21.9 2.8 3.8 11.5 17.3 17.6 18.2 18.2 15.0 20.3 2.9 2.7 11.0 17.0 16.3 18.6 18.0 14.8 21.1 AP 3 10.3 4.7 5.7 9.4 17.3 17.0 17.9 19.1 15.5 19.4 4.3 6.5 11.3 17.8 17.1 19.7 20.9 16.1 20.9 5.1 5.4 11.5 17.4 16.3 17.8 19.3 14.6 20.1 LME estimate 3.5±0.5 5.2±0.9 10.5±0.5 17.2±0.3 16.5±0.5 18.5±0.4 18.8±0.5 14.7±0.3 20.6±0.2
Table 3. δ13C values of the bulk sample and isolated amino acids (AAs) of blood collected from penguin chicks from the southern Indian Ocean.
Normal font indicates essential AAs and bold print indicates non-essential AAs. nc means not considered because of peak co-elution.
Amino Acid δ13C values. ‰
Bulk δ13C phe lys arg thr his gly pro asp ala
Northern rockhopper penguin (NRP). 37.8ºS
-19.4 -20.7 -18.8 -29.8 -8.4 -7.9 -7.0 -13.4 -18.8 -19.8
-19.5 -20.6 -18.4 -29.5 -8.4 -7.9 -7.9 -13.3 -18.0 -18.7
-19.7 -20.8 -18.4 -29.9 -9.1 -6.7 -6.1 -15.7 -18.5 -19.9
Southern rockhopper penguin (SRP). 46.7ºS
-21.3 -21.9 -19.2 -30.4 -10.5 -12.7 -8.2 -16.8 -19.3 -22.8 -21.0 -21.9 -19.0 -30.0 -9.3 -11.0 -9.9 -18.1 -19.7 -22.4 -21.0 -21.8 -19.1 -30.2 -10.4 -12.0 -6.9 -18.2 -19.1 -21.8 King Penguin (KP). 50.0ºS -22.5 -22.7 -20.1 -31.8 -7.9 -9.2 -10.4 -18.5 -20.9 -24.2 -22.6 -22.6 -19.9 -31.7 nc -10.0 nc -19.6 -20.7 -24.7 -22.5 -22.9 -20.4 -31.9 -5.0 -10.0 -11.7 -20.2 -24.8 -21.7
Adélie Penguin (AP). 66.7ºS
-24.5 -25.2 -21.2 -33.4 -11.5 -14.9 -12.2 -22.2 -21.5 -26.3
-24.9 -24.7 -21.2 -33.3 -12.7 -14.3 -12.0 -21.9 -22.0 -26.4
Table 4. Trophic positions estimates from the literature (na for non available), linear mixed-effect model predictions of δ15Nglu - δ15Nphe for the three penguin species, and estimated TEF
between source and trophic transfer amino acids for penguin chick’s blood using Equation 1 (see material & methods for more details).
Species Trophic position* Predicted δ
15N
glu - δ15Nphe
(‰ ) Estimated TEF(‰)
Northern rockhopper penguin na 15.5 nd
Southern rockhopper penguin 4.0 14.1 3.4
King penguin 4.5 17.2 3.8
Adélie penguin 3.9 15.0 3.8
Figure legends
Fig. 1. Sampling locations of the four penguin species in the Southern Indian Ocean (●): Northern rockhopper penguin (NRP), Southern rockhopper penguin (SRP), King penguin (KP) and Adélie penguin (AP). Mean chlorophyll distribution averaged over the period from October 1997 to October 2002 (mg m-³) in the Southern Ocean overlaid with the Southern Ocean fronts are also indicated. Mean front positions are mapped using SSH (adopted from [Sokolov and Rintoul, 2007; 2009]). The STF position (light brown line) is based on temperature criterion as in [Sokolov and Rintoul, 2002]. The STF is mapped using WOCE global hydrographic climatology [Gouretski and Koltermann, 2004]. The 2000 m bathymetric contour is indicated by light blue line.
Fig. 2. Stable isotope values (δ15N to the left and δ13C to the right. ‰) of bulk and individual amino acids of the four penguin species: ○. Northern rockhopper penguin (NRP); ● Southern rockhopper penguin (SRP); Δ King penguin (KP) and Adélie penguin(AP). Nb: for nitrogen, mean values are predicted values (see Table 2).
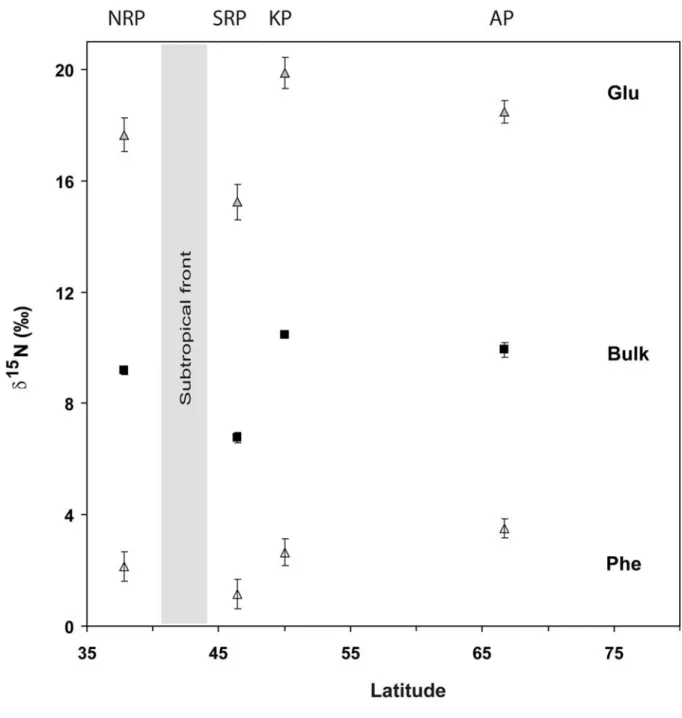
Fig. 3. Variations of δ15N values for bulk ( , mean ± SD), phenylalanine (Δ, Phe) and
glutamic acid ( , Glu) (predicted values ± SE, see methods) with latitude for four penguin species: Northern rockhopper penguin (NRP), southern rockhopper penguin (SRP), king penguin (KP) and Adélie penguin (AP).
Fig. 4. Variations of bulk and amino acid (AA) δ13C values with latitude (a) and of AA δ13C
values with bulk (b) for four penguin species: Northern rockhopper penguin (NRP), southern rockhopper penguin (SRP), king penguin (KP) and Adélie penguin (AP).
Fig. 1. Sampling locations of the four penguin species in the Southern Indian Ocean (●): Northern rockhopper penguin (NRP), Southern rockhopper penguin
(SRP), King penguin (KP) and Adélie penguin (AP). Mean chlorophyll distribution averaged over the period from October 1997 to October 2002 (mg m-³) in
the Southern Ocean overlaid with the Southern Ocean fronts are also indicated. Mean front positions are mapped using SSH (adopted from [Sokolov and Rintoul, 2007; 2009]). The STF position (light brown line) is based on temperature criterion as in [Sokolov and Rintoul, 2002]. The STF is mapped using
Fig. 2. Stable isotope values (δ15N to the left and δ13C to the right. ‰) of bulk and individual amino acids of the four penguin species: ○. Northern rockhopper penguin (NRP); ● Southern rockhopper penguin (SRP); Δ King penguin (KP) and Adélie penguin(AP). Nb: for nitrogen, mean values are predicted values (see Table 2).
Fig. 3. Variations of δ15N values for bulk ( , mean ± SD), phenylalanine (Δ, Phe) and glutamic acid
( , Glu) (predicted values ± SE, see methods) with latitude for four penguin species: Northern rockhopper penguin (NRP), southern rockhopper penguin (SRP), king penguin (KP) and Adélie penguin (AP).
Fig. 4. Variations of bulk and amino acid (AA) δ13C values with latitude (a) and of AA δ13C values
with bulk (b) for four penguin species: Northern rockhopper penguin (NRP), southern rockhopper penguin (SRP), king penguin (KP) and Adélie penguin (AP).