HAL Id: hal-02185988
https://hal-amu.archives-ouvertes.fr/hal-02185988
Submitted on 17 Jul 2019
HAL is a multi-disciplinary open access
archive for the deposit and dissemination of
sci-entific research documents, whether they are
pub-lished or not. The documents may come from
teaching and research institutions in France or
abroad, or from public or private research centers.
L’archive ouverte pluridisciplinaire HAL, est
destinée au dépôt et à la diffusion de documents
scientifiques de niveau recherche, publiés ou non,
émanant des établissements d’enseignement et de
recherche français ou étrangers, des laboratoires
publics ou privés.
Diversity and distribution of tintinnid ciliates along
salinity gradient in the Pearl River Estuary in southern
China
Haibo Li, Chaofeng Wang, Chen Liang, Yuan Zhao, Wuchang Zhang, Gérald
Grégori, Tian Xiao
To cite this version:
Haibo Li, Chaofeng Wang, Chen Liang, Yuan Zhao, Wuchang Zhang, et al.. Diversity and distribution
of tintinnid ciliates along salinity gradient in the Pearl River Estuary in southern China. Estuarine,
Coastal and Shelf Science, Elsevier, 2019, 226, pp.106268. �10.1016/j.ecss.2019.106268�. �hal-02185988�
Diversity and distribution of tintinnid ciliates along salinity gradient in the
Pearl River Estuary in southern China
Haibo Li
a,b,d,1, Chaofeng Wang
a,b,c,d,1, Chen Liang
a,b,c,d, Yuan Zhao
a,b,d,∗, Wuchang Zhang
a,b,d,∗∗, Gérald Grégorie, Tian Xiao
a,b,daCAS Key Laboratory of Marine Ecology and Environmental Sciences, Institute of Oceanology, Chinese Academy of Sciences, Qingdao, 266071, China bLaboratory for Marine Ecology and Environmental Science, Qingdao National Laboratory for Marine Science and Technology, Qingdao, 266237, China cUniversity of Chinese Academy of Sciences, Beijing, 100049, China
dCenter for Ocean Mega-Science, Chinese Academy of Sciences, Qingdao, 266071, China
eAix-Marseille University, Toulon University, CNRS, IRD, Mediterranean Institute of Oceanography UM110, Marseille, 13288, France
A B S T R A C T
Tintinnid community structure in the Pearl River Estuary were investigated 6 times (10, 29 October 2014; 11, 30 June 2015 and 15 March, 1 April 2017) from upstream freshwaters to polyhaline waters. A total of 43 tintinnid species in 15 genera were identified. Freshwater, brackish and marine species occurred in sequence along salinity gradient. Tintinnopsis mayeri, T. tubulosa and Tintinnidium fluviatile were freshwater species. Fourteen and 15 tintinnid species were considered as brackish and marine species, respectively. The preferred salinity of freshwater species was < 3, and the abundance of freshwater species decreased along salinity gradient. Preferred salinity of brackish species ranged in 3–23. High abundance of brackish species occurred at mesohaline regions and decreased towards both oligohaline and polyhaline regions. Marine species abundance dropped sharply with the decrease of salinity, and seldom appeared when salinity was < 15. Tintinnid species richness was low at low salinity areas. With the increase of salinity, tintinnid species richness showed different variation patterns in different seasons. Tintinnid abundance showed bimodal-peak along salinity gradient. The first abundance peak was mainly contributed by brackish species and occurred where salinity was < 15. While the second abundance peak appeared where salinity was around 25 or > 30, which was mainly contributed by marine species. Low salinity, brackish and coastal tintinnid communities were divided based on the abundance percentage variations of different tintinnid types. Complexities of those communities increased along salinity gradient.
1. Introduction
Estuaries are important to humans and marine lives. Estuarine en-vironment is characterized by strong interaction of freshwater outflow and seawater intrusion. The mixture of seawater and freshwater present challenges to the physiology of the organisms. Therefore, estuaries support unique communities of organisms that live at the margin of the sea (Elliott and McLusky, 2002; McLusky and Elliott, 2004). The variability of environmental features, especially salinity, is the main factor controlling the plankton distribution in an estuary (Laprise and Dodson, 1994). Estuarine zooplankton tend to occupy relatively well-defined salinity ranges in relation to their own osmoregulatory abilities
(Modéran et al., 2010). Species composition of both phytoplankton and zooplankton varied along salinity gradient in estuarine areas (Marshall and Alden, 1990,1993;Sautour and Castel, 1995;Tackx et al., 2004;
Calliari et al., 2005; Islam et al., 2005; Muylaert et al., 2009). Ac-cordingly, different zooplankton and phytoplankton communities were divided along salinity gradient in the estuarine waters (Marshall and Alden, 1990,1993;Huang et al., 2004;Tan et al., 2004;Muylaert et al., 2009;Modéran et al., 2010).
Tintinnids (Ciliophora: Spirotrichea) are planktonic ciliates with durable lorica (Lynn, 2008), that could be found in marine habitats all over the world. According to tintinnid genera occurrence in the global ocean, tintinnids were divided into five biogeographical patterns
∗Corresponding author. 7 Nanhai Road, CAS Key Laboratory of Marine Ecology and Environmental Sciences, Institute of Oceanology, Chinese Academy of
Sciences, Qingdao, 266071, China.
∗∗Corresponding author. 7 Nanhai Road, CAS Key Laboratory of Marine Ecology and Environmental Sciences, Institute of Oceanology, Chinese Academy of
Sciences, Qingdao, 266071, China.
E-mail addresses:yuanzhao@qdio.ac.cn(Y. Zhao),wuchangzhang@qdio.ac.cn(W. Zhang).
1These authors contributed equally to this work.
https://doi.org/10.1016/j.ecss.2019.106268
34.1. Our aims were to 1) find out whether there are freshwater or brackish tintinnid species, 2) determine the trends of tintinnid species richness and abundance from the freshwater to seawater, 3) under-standing the mixing of the different tintinnid communities.
2. Materials and methods
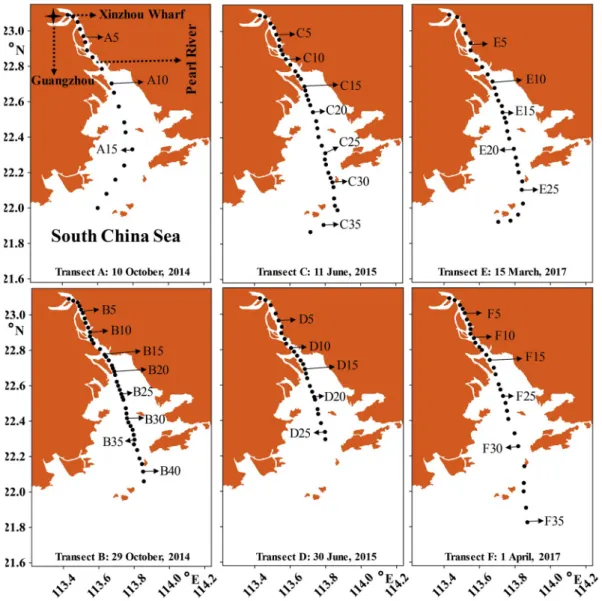
Surface waters were collected onboard R/V “Nanfeng” in transects approximately along the axis of Pearl River Estuary in dry season (Transect A on 10 October 2014; Transect B on 29 October 2014), rainy season (Transect C on 11 June 2015; Transect D on 30 June 2015) and transitional season (Transect E on 15 March 2017; Transect F on 1 April 2017). All transects had the same innermost station (Stns. A1, B1, C1, D1, E1 and F1) in Xinzhou Wharf. However, they had different lengths and different number of stations: Transects A, B, C, D, E and F had 19, 41, 36, 26, 29 and 30 stations, respectively (Fig. 1). Surfer (Version 12, Golden Software Inc., USA) was used to present the sampling stations. At each station, 80 L of surface water were taken with a bucket while the ship was moving, and gently filtered through a 10 μm mesh-size net. The samples (ca. 150 cm3) in the cod end of the net were
transferred into bottles and immediately fixed with Lugol's solution (1% final concentration). Surface water temperature (°C) and salinity (measured using the Practical Salinity Scale) were determined using a portable water quality analyzer YSI EC300A (Professional Plus, USA).
In the laboratory, two subsamples (each 25 cm3) from each original
Fig. 1. Stations and sampling days of each transect in the Pearl River Estuary.
(cosmopolitan, neritic, warm-water, boreal, and austral) in genera level (Pierce and Turner, 1993; Dolan and Pierce, 2013). Tintinnids mainly occur in marine environments, but also in freshwaters (Kofoid and Campbell, 1929; Nie, 1933; Chiang, 1956; Petz and Foissner, 1993) and brackish waters (Sniezek et al., 1991; Snyder and Brownlee, 1991;
Smith et al., 2018). Most studies of tintinnids in brackish waters mainly reported the occurrence salinity in limited sites (Balkis, 2004;Urrutxurtu, 2004). There was no report on those tintinnids distribution variations along salinity gradient around the world. In this case, we are not sure whether those species reported in brackish waters were brackish species or just expatriated from their indigenous areas.
As the l argest e stuary i n southern China, the Pearl River Estuary is a dynamic complex e stuary with 8 river i nlets on i ts western boundary a nd has l ots of f reshwater i nput channels f rom the Pearl River a nd i ts branches (Wong e t a l., 2004). The mean a nnual discharge of the Pearl River i s a bout 10,000 m3 s−1 a nd the discharge
is a bout f our times g reater i n the rainy season (April to S eptember) than i n the dry season (October to March) (Dong e t a l., 2004). The mean discharges of the Pearl River Estuary a re a bout 8000, 19,000 and 6000 m3 s−1 i n March, J une a nd October, respectively (Zheng e t al., 2012). I n the Pearl River Estuary, phytoplankton was divided into e stuarine, mixed water a nd coastal communities ( Huang e t a l., 2004), the z ooplankton was divided i nto e stuarine, tropical neritic, warm-temperate nearshore a nd pelagic communities (Tan e t a l., 2004). I n this study, we i nvestigated tintinnid community variation along transects where salinity varied f rom 0.1 to
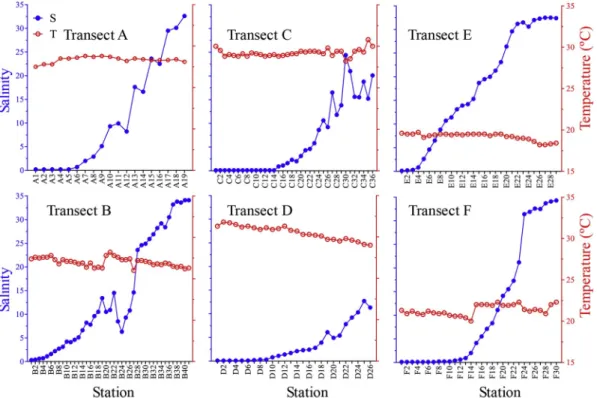
and 29.0–31.8 °C at Transects C and D, respectively. In dry season, temperatures fell in the range of 27.5–28.8 °C and 26.0–28.2 °C at Transects A and B, respectively. In transitional season, temperatures were the lowest, fell in ranges of 18.2–19.7 °C and 20–22.3 °C at Transects E and F, respectively (Fig. 2).
3.2. Salinity preference of tintinnid species
Totally 43 tintinnid species belonging to 15 genera were identified at 6 sampling transects. Tintinnopsis (23 species) was the most diverse genus followed by Codonellopsis (3 species), Tintinnidium (2 species),
Leprotintinnus (2 species), Amphorides (2 species), and Eutintinnus (2
species). Other genera each contained one species (Table 1).
In dry season, 32 species belonging to 12 genera occurred (30 species in 11 genera and 26 species in 8 genera at Transects A and B, respectively). In rainy season, 23 species belonging to 8 genera oc-curred (16 species in 6 genera and 16 species in 4 genera at Transects C and D, respectively). In transitional season, 26 species belonging to 8 genera occurred (19 species in 6 genera and 22 species in 7 genera at Transects C and D, respectively). For individual species, 11 species occurred in all 3 seasons. While 16 species occurred in only 1 season (Table 1).
Salinity ranges were determined for 32 species occurred in ≥5 stations at all transects. These species were divided into freshwater species, brackish species and marine species according to their pre-ferred salinity (salinity with the highest abundance occurred) and abundance variations along salinity gradient (Figs. 3–5 and S1-S3,
Table 1 andS1). Eleven species occurred in < 5 stations were occa-sional species (Fig. S4). We could not assign salinity preference because of their low abundance and occurrence frequencies (Table 1andS1).
3.2.1. Freshwater species
Three species (Tintinnopsis mayeri, T. urnula and Tintinnidium
flu-viatile) with the highest abundance in oligohaline (salinity < 3) zone
were freshwater species. T. mayeri was the only freshwater species that appeared at all 6 transects in 3 seasons. T. urnula occurred at 5 transects in 3 seasons and T. fluviatile was identified at 3 transects in dry and
Fig. 2. Variation of salinity and temperature (°C) at each transect in the Pearl River Estuary.
sample were settled in two Utermöhl counting chambers (25 cm3) for at
least 24 h. Tintinnid were identified and counted using an inverted microscope (Olympus IX 71) at magnification of 100 × or 400 × , photo of each tintinnid species was taken by a software (Olympus cellSens Standard 1.17) connecting the microscope and computer. Tintinnid species were determined according to lorica morphology and size based on literature (Kofoid and Campbell, 1929, 1939; Hada, 1937,
1938; Bakker and Phaff, 1976; Yoo et al., 1988; Yoo and Kim, 1990;
Zhang et al., 2012, 2014). Distributional data were presented as scatter diagrams and bar charts by Grapher (Version 12, Golden Software Inc., USA).
3. Results
3.1. Hydrography
Surface salinity changed greatly along the Pearl River Estuary in each season. In dry season, surface salinity fell in the range of 0.2–32.6 and 0.3–34.1 at Transects A and B, respectively. In rainy season, it fell in the range of 0.1–24.4 and 0.1–12.7 at Transects C and D, respec-tively. In transitional season, surface salinity ranged in 0.1–32.5 and 0.1–34.3 at Transects E and F, respectively (Fig. 2).
Salinity variation trends along each transect had obvious differ-ences. At Transect A, salinity stayed at 0.2 at the innermost 5 stations and then increased slowly with small fluctuations. At Transect B, sali-nity increased continuously from upstream to downstream with large fluctuation between Stns. B19 and B28. The salinity fluctuations at Transects A and B were caused by freshwater discharge from branches of the Pearl River. Because of the largest freshwater discharge in rainy season, salinity kept its minimum value (0.1) at upstream stations at both Transects C and D. Salinity increased slower at Transects C and D than the other 4 transects. At Transect E, salinity increased con-tinuously before reaching a plateau at the last three stations. At Transect F, salinity stayed at 0.1 or 0.2 before Stn. F10, then increased rapidly (Fig. 2).
Temperature fluctuations were small (< 3 °C) along each transect. Temperatures were the highest in rainy season, ranged in 28.2–30.8 °C
rainy seasons (Fig. 3,Table 1). The highest abundance of T. mayeri (230 ind. L−1) was higher than T. urnula (20 ind. L−1) and T. fluviatile (9 ind.
L−1) (Table S1). The highest abundances of T. mayeri, T. urnula and T.
fluviatile appeared at salinity of 2.8, 0.9 and 1.6, respectively (Fig. 3). Salinity tolerances of the 3 freshwater species had slight difference.
T. fluviatile only appeared in salinity ≤12.7, while both the salinity
range of T. mayeri and T. urnula was 0.1–32.5 (Table S1). T. mayeri merely appeared in salinity ≤6.1 at Transects A, B, D and F. At Transects C and E, T. mayeri was identified at high salinity regions and even to 32.5 at Transect E. Maximum abundance of T. mayeri was highest in rainy season, which were 150 and 230 ind. L−1at Transects
C and D, respectively. In dry and transitional seasons, maximum abundance were extremely lower than in rainy season, which were 37, 15, 12 and 5 ind. L−1at Transects A, B, E and F, respectively (Fig. 3).
Tintinnopsis urnula did not appear at Transect B. It only occurred in
salinity ≤4.1 at Transects A, C, D and F. At Transect E, it appeared in salinity ranged in 6.5–32.5. Maximum abundance of T. urnula was the highest (20 ind. L−1) at Transect F and the lowest (7 ind. L−1) at
Transect E (Fig. 3). T. fluviatile did not occur at transitional season. In dry season, it only appeared in salinily ≤2.9 and 5.1 at Transects A and B, respectively. At Transect D, it occurred in salinity 10.3–11.3. Max-imum abundance of T. fluviatile was the highest (7 ind. L−1) at Transect
B and the lowest (3 ind. L−1) at Transect D. Maximum abundance of T.
fluviatile was 5 ind. L−1at Transect A (Fig. 3).
3.2.2. Brackish species
Codonellopsis lusitanica, Leprotintinnus nordqvisti, L. simplex, Nolaclusilis bicornis, Tintinnidium sp., Tintinnopsis amoyensis, T. chingla-nensis, T. fimbriata, T. nana, T. nucula, T. parva, T. tentaculata, T. tubu-losa, and Tintinnopsis sp.1 were defined as brackish species. Salinity
ranges of these species were different, but the preferred salinity ranged in 3–23. With the increase of salinity, abundances of most brackish species increased at first, then decreased (Fig. 4).
Tintinnopsis amoyensis and T. fimbriata were the most abundant
species, whose highest abundance were 2202 and 1657 ind. L−1,
re-spectively. Both of them occurred at all transects in 3 seasons. Swarm (abundance > 1000 ind. L−1) of T. amoyensis and T. fimbriata occurred
at Transect D when salinity ranged in 5.4–9.2 and 3.9–6.1, respectively. At other 5 transects, maximum abundance of T. amoyensis and T.
fim-briata were ≤200 ind. L−1. Salinity range of T. amoyensis and T.
fim-briata were 0.2–26.4 and 0.2–24.4, and the preferred salinity of T. amoyensis and T. fimbriata were 5.4 and 3.9, respectively (Fig. 4).
Maximum abundance of N. bicornis, T. nana, T. parva, T. tentaculata,
T. tubulosa, and Tintinnopsis sp.1 were in the range of 50–1000 ind. L−1,
which occurred when salinity were 10.3, 6.6, 7.1, 11.3, 5.4 and 3.9, respectively. T. nana, T. parva and T. tubulosa occurred at all transects in 3 seasons, with salinity ranged in 0.1–19.5. 0.1–30.6 and 0.1–32.6, respectively. T. tentaculata appeared at 5 transects in 3 seasons, with salinity ranged in 1.4–33.8. N. bicornis and Tintinnopsis sp.1 only oc-curred at Transect D in rainy season, with salinity ranged in 7.8–12.7 and 2.1–12.7, respectively (Fig. 4).
Species Occurrence frequency
A B C D E F Freshwater species Tintinnidium fluviatile 2 7 0 3 0 0 Tintinnopsis mayeri 8 11 29 21 24 9 Tintinnopsis urnula 1 0 6 14 10 15 Brackish species Codonellopsis lusitanica 0 0 0 0 6 4 Leprotintinnus nordqvisti 4 1 8 3 0 0 Leprotintinnus simplex 0 2 7 0 3 0 Nolaclusilis bicornis 0 0 0 5 0 0 Tintinnidium sp. 3 2 0 2 0 0 Tintinnopsis amoyensis 6 15 15 13 13 11 Tintinnopsis chinglanensis 0 0 0 0 6 7 Tintinnopsis fimbriata 5 16 11 11 5 3 Tintinnopsis nana 2 13 2 3 9 8 Tintinnopsis nucula 5 7 0 0 0 1 Tintinnopsis parva 4 14 8 5 11 15 Tintinnopsis tentaculata 7 21 13 12 0 1 Tintinnopsis tubulosa 12 21 10 12 16 15 Tintinnopsis sp.1 0 0 0 5 0 0 Marine species Amphorellopsis acuta 5 4 6 0 8 7 Amphorides amphora 0 0 0 0 1 8 Codonellopsis morchella 0 1 1 0 0 4 Codonellopsis ostenfeldi 0 0 1 0 0 4 Dadayiella ganymedes 3 0 0 0 0 3 Tintinnopsis beroidea 1 1 0 0 3 3 Tintinnopsis butschlii 3 1 0 0 1 0 Tintinnopsis estuariensis 1 4 0 0 0 0 Tintinnopsis glans 5 6 0 0 3 3 Tintinnopsis plagiostoma 4 16 0 0 2 0 Tintinnopsis radix 6 5 1 0 0 0 Tintinnopsis schotti 4 13 0 0 1 0 Tintinnopsis tocantinensis 7 11 0 0 0 0 Tintinnopsis tubulosoides 6 9 0 0 16 8 Wangiella dicollaria 5 11 0 0 10 3 Occasional species Amphorides minor 0 0 0 0 0 3 Epiplocylis sp. 0 0 0 0 0 2 Eutintinnus lusus-undae 2 1 1 0 0 0 Eutintinnus stramentus 1 0 0 0 0 0 Favella sp. 1 2 0 0 0 0 Helicostomella longa 1 0 1 0 0 0 Metacylis jorgensenii 1 0 0 0 0 0 Protorhabdonella curta 3 0 0 0 0 0 Tintinnopsis cylindrica 0 0 0 4 0 0 Tintinnopsis sp.2 0 0 0 2 0 0 Tintinnopsis sp.3 0 0 0 4 0 0
Fig. 3. Abundance (ind. L−1) variation of freshwater tintinnids along salinity gradient at each transect.
Table 1
Species list and their occurrence frequencies (times) at Transects A, B, C, D, E and F. Nineteen, 41, 36, 26, 29 and 30 stations were conducted at Transects A, B, C, D, E and F, respectively.
Maximum abundance of C. lusitanica, L. nordqvisti, L. simplex,
Tintinnidium sp., T. chinglanensis and T. nucula were < 25 ind. L−1. The
preferred salinity of the 6 species ranged in 4.6–22.5. Salinity ranges of
C. lusitanica, L. nordqvisti, L. simplex, Tintinnidium sp., T. chinglanensis
and T. nucula were 0.8–14.2, 9.2–34.1, 11.8–34.1, 6.3–23.6, 8.3–31.4 and 0.2–34.1, respectively. Among them, L. nordqvisti occurred at 4 transects in dry and rainy seasons, Tintinnidium sp. occurred at Transects A, B and D in dry and rainy seasons, L. simplex occurred at Transects B, C and E in 3 seasons, T. nucula occurred at Transects A, B and F in dry and transitional seasons, while C. lusitanica and T.
chin-glanensis occurred at Transects E and F in transitional season (Fig. 4).
3.2.3. Marine species
Fifteen species with the highest abundance occurred at polyhaline (salinity > 23) regions were considered as marine species:
Amphorellopsis acuta, Amphorides amphora, C. morchella, C. ostenfeldi, Dadayiella ganymedes, T. beroidea, T. butschlii, T. estuariensis, T. glans, T. plagiostoma, T. radix, T. schotti, T. tubulosoides, T. tocantinensis and Wangiella dicollaria. Their abundance decreased sharply with salinity
decrease from downstream to upstream. They rarely appeared in low
salinity (< 15) waters. No marine species was identified at Transect D (Fig. 5,Table S1).
Maximum abundance of W. dicollaria (305 ind. L−1) and T.
to-cantinensis (107 ind. L−1) were > 100 ind. L−1. Salinity ranges of W.
dicollaria and T. tocantinensis were 15.3–34.1 and 16.6–34.1,
respec-tively. A. acuta, C. morchella, C. ostenfeldi, D. ganymedes, T. plagiostoma,
T. radix and T. tubulosoides had maximum abundance ranged in 20–100
ind. L−1, with salinity tolerance ranges in 15.2–34.1, 17.3–34.3,
21.0–34.3, 29.5–34.3, 6.3–34.1, 16.6–34.1 and 11.1–34.1, respectively. Maximum abundances of A. amphora, T. beroidea, T. butschlii, T.
es-tuariensis, T. glans and T. schotti were < 20 ind. L−1. They occurred in
salinity ranges of 21.2–34.3, 17.3–34.1, 29.5–34.1, 16.6–34.1, 14.6–34.3 and 22.5–34.3, respectively (Fig. 5,Table S1).
Amphorellopsis acuta and C. morchella occurred in 3 seasons. But A. acuta appeared at Transects A, B, C, E and F, while C. morchella
ap-peared at Transects B, C and F. T. beroidea, T. glans, T. tubulosoides and
W. dicollaria occurred at 4 transects in dry and transitional seasons. A. amphora only appeared at 2 transects in transitional season, while T. estuariensis and T. tocantinensis only appeared at 2 transects in rainy
season. T. butschlii, T. plagiostoma, T. radix and T. schotti occurred at 3
transects, while C. ostenfeldi and D. ganymedes occurred at 2 transect in different seasons (Fig. 5,Table 1).
3.3. Number of tintinnid species variations along salinity gradient
Number of freshwater tintinnid species was ≤2 at each station. Although the number of freshwater tintinnid species was low, the variation trends were quite clear except for Transect E (and partly Transect C) (Fig. 6). Freshwater species disappeared when salinity > 5 at Transects A, B and F. They occurred discontinuously when sali-nity > 5 at Transects C and D. However, they occurred at high salisali-nity regions at Transect E (Fig. 6).
Number of brackish tintinnid species increased at first, then de-creased along salinity gradient at Transects A, B, and F. It was difficult to determine the variation tends at Transects C and D because of the narrower salinity range (Fig. 6). The maximum numbers fell in the range of 5–8 at each transect, occurred when salinity ranged in 5–25 (Fig. 6).
At Transects A and B, number of marine tintinnid species decreased from polyhaline to mesohaline (salinity ranged in 3–23) stations, the maximum number (10 in both Transects A and B) occurred at stations with salinity > 30 (Fig. 6). At Transects E and F, number of marine tintinnid species was ≤6, higher numbers occurred when salinity > 20
and decreased sharply when salinity < 20 (Fig. 6). Number of marine tintinnid species was extremely low at Transect C where the highest salinity was 24.4. No marine species occurred at Transect D (Fig. 6).
Tintinnid species richness ranged in 1–15, 1–13, 1–7, 2–11, 1–7 and 2–8 at Transects A, B, C, D, E and F, respectively. It increased along salinity gradient when salinity < 5 at each transect. Different variation trends of tintinnid species richness were observed when salinity > 5 in different seasons. Tintinnid species richness was high when salinity > 30 at Transects A and B. It stayed stable at mesohaline regions at Transects C, E and F (Fig. 6).
3.4. Tintinnid abundance variations along salinity gradient
Abundances of freshwater species were high when salinity was ex-tremely low and decreased sharply with the increase of salinity at each transect except Transect E (Fig. 7). Maximum abundances ranged in 12–230 ind. L−1 at each transect. Maximum abundance was much
higher in rainy season (160 and 230 ind. L−1at Transects C and D,
respectively) than in dry season (38 and 22 ind. L−1at Transects A and
B, respectively) and transitional season (12 and 21 ind. L−1at Transects
E and F, respectively) (Fig. 7).
Brackish species abundances increased at first and then decreased along salinity gradient at each transect, high abundance occurred at
regions with salinity ranged in 5–20. Maximum abundance was ex-tremely higher at Transect D (2683 ind. L−1) than at the other 5
transects (177–376 ind. L−1) (Fig. 7).
At polyhaline regions, marine species abundance increased rapidly with the increase of salinity. Maximum abundances were higher in dry
season (247–531 ind. L−1at Transects A and B, respectively) than in
transitional season (53–109 ind. L−1at Transects E and F, respectively)
and rainy season (< 20 ind. L−1at Transect C) (Fig. 7).
Total tintinnid abundances were in the ranges of 4–285, 2–557, 2–235, 10–2693, 1–215 and 1–239 ind. L−1at Transects A, B, C, D, E
Fig. 6. Number of species variation of different type tintinnids along salinity gradient at each transect. Note that total species including freshwater species, brackish
Fig. 7. Abundance (ind. L−1) variation of different type tintinnids along salinity gradient at each transect. Note that total species including freshwater species,
and F, respectively (Fig. 7). Variation tendency of total tintinnid abundance were similar when salinity was < 15 except at Transect A: along with the increasing salinity, it increased at first before reaching a peak, then decreased to low values (Fig. 7).
Total tintinnid abundances showed bimodal-peak along salinity gradient at 4 transects (Transects A, B, E and F). First abundance peaks occurred when salinity was in the range of 4–11 for all transects, which were contributed by brackish species. The second abundance peaks occurred when salinity > 30 at transects A, B and F, and with salinity about 25 at Transect E. Those peaks were contributed by marine species (Fig. 7).
3.5. Tintinnid community variations along salinity gradient
Cumulative data of the 6 transects showed that number of species and abundance of brackish tintinnids had peaks in mesohaline region. Number of species and abundance of marine tintinnids increased with salinity. There were only 3 freshwater species which was too low to show richness trend (Fig. 8). Freshwater species abundance decreased from oligohaline to mesohaline regions. Total species richness was low at oligohaline regions and high at polyhaline regions. Total tintinnid abundance showed peaks at mesohaline and polyhaline regions along salinity gradient (Fig. 8).
Three tintinnid communities (low salinity, brackish and coastal communities) were divided based on the dominance of freshwater, brackish and marine tintinnids (Fig. 9). Low salinity community, dominated by the freshwater species, mainly appeared when salinity was < 2.5 (Fig. 9). At Transects A, B, C and D, the division between low salinity and brackish communities were at the salinity of 2.9, 4.2, 2.0 and 2.4, respectively. The lowest salinity when coastal community first occurred was 29.5, 24.9, 20.1, 19.5 and 21.2 at Transects A, B, C, E and F, respectively (Fig. 9). Therefore, the three communities were generally divided at salinity ranges of 2.0–4.2 and 19.5–29.5, respec-tively.
The community variations in different season were different: The boundary between different communities were clear cut at Transects A, B, C and D. However, at Transects E and F, low salinity community did not have a clear cut separation with brackish community: freshwater tintinnids bounced back to dominance for several times (Fig. 9).
4. Discussion
4.1. Salinity preference of tintinnid species
Both freshwater and marine organisms could be found at estuaries (McLusky and Elliott, 2004). There were different opinions on whether true brackish species existed at estuaries. Some reports insisted that brackish species were really marine or freshwater species that can adapt brackish conditions (Cognetti and Maltagliati, 2000;Attrill and Rundle, 2002). Most researches agreed that there were true brackish species in mesohaline regions of estuaries (McLusky and Elliott, 2004;Elliott and Quintino, 2007; Whitfield et al., 2012). “(True) brackish species” (Barnes, 1989;McLusky and Elliott, 2004) and “(true) estuarine spe-cies” (Carter and Dadswell, 1983; Elliott and Quintino, 2007) were commonly used in estuarine studies with the same meaning (Whitfield et al., 2012). We chose to use “brackish species” in our study.
To our knowledge, brackish tintinnid species was first proposed by
Bakker and Phaff (1976). There were lots of tintinnid taxonomic re-ferences about freshwater (Kofoid and Campbell, 1929; Nie, 1933;
Chiang, 1956;Petz and Foissner, 1993), brackish (Sniezek et al., 1991;
Snyder and Brownlee, 1991;Smith et al., 2018) and marine (Kofoid and Campbell, 1939; Zhang et al., 2012) species. However, variation of community composition by those tintinnids along salinity gradient in a specific estuary has not been studied before. Based on the intrusion ability from marine to freshwaters in the Lake Shinji-Ohashi River-Lake Nakaumi brackish-water system, tintinnids were divided into high salinity and wide salinity species, while no freshwater or brackish species was divided (Godhantaraman and Uye, 2003).
Freshwater species and marine species may be expatriated to me-sohaline areas due to freshwater discharge and oceanic water intrusion, respectively, into estuaries. Those freshwater and marine species might be found in an expatriate state in mesohaline waters (Angel, 1993). Brackish species usually have wide salinity tolerance (Whitfield et al., 2012). Thus, it was inaccurate to determine salinity preference of tin-tinnid species according to sporadic report of their occurrence. There-fore, it was more suitable to determine whether a tintinnid species is a freshwater, brackish or marine species according to the preferred sali-nity and abundance variation along salisali-nity gradient.
According to the division standard above, we divided the 32 tin-tinnid species into freshwater (3 species), brackish (14 species) and
Fig. 8. Cumulative number of species and abundance (ind. L−1) variation of different type tintinnids along salinity gradient. Note that total species including
marine (15 species) species (Figs. 3–5). This was consistent with salinity adaptability of phytoplankton in the Pearl River Estuary that fresh-water, half-fresh-water and oceanic phytoplankton species were iden-tified (Huang et al., 2004).
4.1.1. Freshwater species
Thirty freshwater tintinnid species have been identified before, and most freshwater species belonging to genera Tintinnopsis (20 species) and Tintinnidium (6 species) (Zhang et al., 2012). In our study,
Tintin-nidium fluviatile, Tintinnopsis mayeri and T. urnula were identified as
freshwater species with preferred salinity values < 3 (Fig. 3). T.
flu-viatile was considered as a freshwater species in previous studies
(Chiang, 1956;Zhang et al., 2012). T. mayeri and T. urnula were not classified as freshwater species before.
Tintinnidium fluviatile occurred in freshwater lakes in Jiangsu
Province, China (Chiang, 1956). It also occurred in the Dock of Woods Hole (Gold and Morales, 1976) and the Río de la Plata estuary (Gómez et al., 2009). T. mayeri was found in coastal sites of Jiaozhou Bay without any information of salinity (Yin, 1952). However, a 10-year survey in the central Jiaozhou Bay (salinity > 24.6) did not find this species (Feng et al., 2018). In the present study, although T. mayeri appeared when salinity was > 30 in the Pearl River Estuary, the sta-tions T. mayeri appeared were not far from the coast. T. mayeri may discharged to higher salinity areas by river runoff or the branches of the river in expatriate state and die out soon. However, the 10-year survey in Jiaozhou Bay were conducted in the central area of Jiaozhou Bay far from the coast, T. mayeri might not reach those areas even in expatriate state. Our result that T. mayeri was a freshwater species may contribute to explain its presence inYin (1952)and absence inFeng et al. (2018).
T. urnula mainly occurred at low salinity regions and disappeared at the
outermost sites in the Hooghly (Ganges) River Estuary (Rakshit et al., 2016a).
In the present study, we confirmed that freshwater tintinnids can sometimes be brought to high salinity (32.5) regions. However, we did not understand why freshwater tintinnids were expatriated to high salinity in transitional season rather than in rainy season with largest freshwater discharge.
4.1.2. Brackish species
Four brackish species were reported in previous studies: Dartintinnus
alderae (Smith et al., 2018), Nolaclusilis bicornis (Snyder and Brownlee, 1991), N. hudsonicus (Sniezek et al., 1991) and T. fimbriata (Bakker and Phaff, 1976). In our study, 14 brackish species were identified (Fig. 4). Among them, N. bicornis and T. fimbriata were reported in previous studies. N. bicornis was first identified in oligohaline and mesohaline regions with salinity ranged in 0.7–16.4 in the Chesapeake Bay (Snyder and Brownlee, 1991). T. fimbriata mainly appeared at mesohaline re-gion in Netherlands coastal waters (Bakker and Phaff, 1976) and the Chesterfield Inlet (Rogers et al., 1982). The abundance of T. fimbriata reached 1.08 × 10⁶ind. L−1at salinity of about 15 and caused a
yel-lowish colouration in the Kiel Bight, Baltic Sea, in March 1999 (Agatha, 2008). In this study, swarm of T. fimbriata appeared at salinity ranged in 3.9–6.1 and declined both towards the polyhaline and oligohaline waters (Fig. 4).
Other species were not defined as brackish species, although there were reports of some species occurring in brackish waters. T. amoyensis is a common and sometime dominant species at estuarine regions. In the Weihe River mouth of Laizhou Bay, T. amoyensis was the most dominant species with maximum abundance of 6700 ind. L−1(Zhang and Wang, 2000). T. amoyensis (synonym of T. uruguayensis) was also a
Fig. 9. Abundance percentage (%) of different type tintinnids at each station. : Salinity, : freshwater species, : brackish species, : marine species, : occasional
Abramova, 2000). Planktonic protists showed an inverse trend along salinity gradient compared with macrozoobenthos, while the highest species richness occurred in the horohalinicum in the Baltic Sea estu-aries (Telesh et al., 2011a,b;2013).
In the present study, 15 marine, 14 brackish and 3 freshwater tin-tinnid species were identified (Table 1). It was understandable because only 30 freshwater tintinnids while about 900 marine tintinnid species have been reported till now (Zhang et al., 2012). As a result, species richness in mesohaline waters was higher than in oligohaline waters.
Tintinnid species richness were higher in mesohaline than in oli-gohaline regions in all transects in our study, while the values in polyhaline waters were higher than in mesohaline waters in some transects and lower in other transects (Fig. 6). This was not so con-sistent with that of planktonic protists in the Baltic Sea estuaries, where the highest species richness occurred in horohalinicum (Telesh et al., 2011a,b;2013). In the Chesapeake Bay with salinity ranged in 9–27, higher numbers of tintinnid species were found in the intermediate stations (salinity ranged in 14–17), low values were found at oligoha-line and polyhaoligoha-line stations (Dolan and Gallegos, 2001). This tendency was similar with that of Transects E and F in our study.
4.2.2. Variation of tintinnid abundance along salinity gradient
In our study, two tintinnid abundance peaks appeared at Transects A, B E and F, only one abundance peak appeared at Transects C and D (Fig. 7). This might be because salinity ranges of Transects C and D were the narrowest, if sampled at a larger salinity range, tintinnid abundance may showed bimodal-peak, too.
In the present study, peaks of tintinnid abundance occurred at mesohaline and polyhaline regions along salinity gradient. This abun-dance distribution pattern was inconsistent with that in the Bay of Biscay, where tintinnids showed a seaward distribution and were re-stricted to regions with salinity > 25 (Urrutxurtu et al., 2003). Bi-modal-peak of tintinnid abundance along salinity gradient made it difficult to find the correlation between tintinnid abundance and sali-nity in our study (Fig. 8), which was consistent with that no significant correlation between tintinnid abundance and salinity (ranged in 11.3–33.2) was found in Hiroshima Bay (Kamiyama and Tsujino, 1996).
4.2.3. Tintinnid community varations along salinity gradient
According to the abundance percentage variations of freshwater, brackish and marine zooplankton species along salinity gradient, a distinct brackish zooplankton community could be divided between freshwater and marine zooplankton communities (Cognetti and Maltagliati, 2000). In our study, low salinity, brackish and coastal tintinnid communities were divided using the same method asCognetti and Maltagliati (2000)(Fig. 9).
Tintinnid community division in this study was similar to previous studies of phytoplankton (Huang et al., 2004) and zooplankton (Tan et al., 2004) in the Pearl River Estuary. Indeed, estuarine, mixed water and coastal phytoplankton communities (Huang et al., 2004), whereas estuarine, tropical neritic, warm-temperate nearshore and pelagic zooplankton communities (Tan et al., 2004) were divided in the Pearl River Estuary. The similar variation tendencies of zooplankton com-munities were also observed in the St. Lawrence Estuary (Laprise and Dodson, 1994;Winkler et al., 2003) and upper Ariake Bay of Japan (Islam et al., 2006). Those results indicated that it was a common phenomenon that plankton varied from low salinity to brackish to coastal communities along salinity gradient in estuarine regions.
In the present study, low salinity tintinnid community was abso-lutely dominant by 3 freshwater species. Brackish tintinnid community was shaped by several abundant brackish species such as T. tubulosa, T.
amoyensis, T. tentaculata, T. fimbriata, T. parva, and T. nana. While
coastal tintinnid community was much more complex, it was composed by more species with low abundance (Figs. 3–5). This distribution pattern was consistent with that of zooplankton in the Gironde estuary, where the upstream zone was exclusively dominated by one copepod, major tintinnid species at estuarine environment in southwest coast of
India (Sivasankar et al., 2018). In this study, swarm of T. amoyensis occurred at salinity 5.4–9.2 (Fig. 4). In our study, swarm of T. amoyensis and T. fimbriata occurred at Transect D caused the extreme high abundance of brackish species at transect D (Figs. 4 and 7).
Tintinnopsis tubulosa was considered as a wide salinity species in the
Hooghly (Ganges) River Estuary with the highest salinity of 26 (Rakshit et al., 2016a). Leprotintinnus nordqvisti was considered as a high salinity species in a brackish-water system in Japan (Godhantaraman and Uye, 2003). T. tentaculata, T. parva, and T. nana were mostly found at regions with salinity range of 3.2–14.4 in the Hooghly (Ganges) River Estuary (Rakshit et al., 2016a). T. nucula, T. chinglanensis, L. simplex, and
Co-donellopsis lusitanica were sporadically reported at coastal or estuarine
environments (Zhang and Wang, 2000; Li et al., 2016; Rakshit et al., 2016b) without detailed salinity range.
In taxonomical studies, brackish tintinnid species were less fre-quently targeted in brackish waters, where in turn the most recently discovered species and genera, such as D. alderae (Smith et al., 2018),
N. hudsonicus (Sniezek et al., 1991) and N. bicornis (Snyder and Brownlee, 1991), have been found. We find that preferred salinity of brackish species were in the range of 3–23, which could be helpful for taxonomist to find more brackish tintinnid species.
4.1.3. Marine species
Most marine tintinnids in our study were common species in coastal and estuarine waters around the world (Godhantaraman and Uye, 2003; Urrutxurtu, 2004; Li et al., 2016; Feng et al., 2018; Sivasankar et al., 2018). Their abundances plummeted sharply with the decrease of salinity in the Pearl River Estuary (Fig. 5).
There were some reports about decreasing abundances of some species from coast to inner part of estuaries. For example, Wangiella
dicollaria was restricted at regions with salinity > 24 in the Hooghly
(Ganges) River Estuary (Rakshit et al., 2016a). T. berodea only appeared when salinity was > 18 in the Nervion River estuary, its high abun-dance occurred when salinity was > 25 (Urrutxurtu, 2004). T. radix appeared when salinity ranged in 19.7–20 in the Sea of Marmara (Balkis, 2004) and 29.17–32.89 in Southern Yellow Sea (Zhang et al., 2008). It was the dominant species at all stations in Shenhu Bay of China with salinity ranged in 31–33.6 (Wang et al., 2014). T.
estuar-iensis was a species first recorded in the Changjiang River Estuary with
salinity ranged in 3.9–29.8 (Zhang et al., 2014).
4.2. Tintinnid composition variation along salinity gradient
In the present study, different tintinnid species occupied different salinity ranges with drastic abundance variations (Figs. 3–5). Variations of tintinnid composition along salinity gradient in the present study were consistent with previous studies of phytoplankton and zoo-plankton. Estuarine plankton community structure was strongly af-fected by salinity. Species composition and abundance of both phyto-plankton and zoophyto-plankton varied along salinity gradient (Marshall and Alden, 1990, 1993; Sautour and Castel, 1995; Tackx et al., 2004;
Calliari et al., 2005; Islam et al., 2005; Muylaert et al., 2009). Corre-spondingly, communities of zooplankton and phytoplankton varied along salinity in estuaries (Marshall and Alden, 1990, 1993; Huang et al., 2004; Tan et al., 2004; Muylaert et al., 2009; Modéran et al., 2010).
4.2.1. Variation of tintinnid species richness along salinity gradient
In estuary regions, number of freshwater and marine macro-zoobenthos were higher than brackish species, freshwater and marine macrozoobenthos decreased in diversity with a progression from both upstream freshwater and downstream marine ends, caused the lowest species richness when salinity ranged in 5–8 (Remane, 1934; McLusky and Elliott, 2004; Whitfield et al., 2012). The salinity range of 5–8 was considered as critical salinity zone or horohalinicum (Khlebovich and
5. Conclusions
In this study, diversity and distribution variations of tintinnid along salinity gradient from 0.1 to 34.1 in the Pearl River Estuary were in-vestigated. We found that freshwater, brackish and marine tintinnid species appeared successively along salinity gradient. Preference sali-nity of freshwater, brackish and marine tintinnid species ranged in < 3, 3–23 and > 23, respectively. The alternation of freshwater, brackish and marine tintinnid species caused the variation of tintinnid species richness and abundance. Tintinnid species richness was low at oligo-haline regions in 3 seasons. Variation tendency of tintinnid species richness along salinity gradient were different in different seasons. Two abundance peaks appeared at mesohaline and polyhaline regions. According to the dominance of freshwater, brackish and marine tin-tinnid species, low salinity, brackish and coastal communities were divided in the Pearl River Estuary. Future research of tintinnid com-munity variation along large salinity gradient in other estuaries is needed in order to elucidate whether there is different characteristics in other estuaries.
Acknowledgements
This work was supported by the National Natural Science Foundation of China (NSFC Nos. 41576164 and 41706192), National Basic Research Program of China (973 Program No. 2014CB441504), CNRS-NSFC Joint Research Projects Program (No. 41711530149) and 2017-2019 Sino-French Cai Yuanpei Programme. We thank the crew on the R/V “Nanfeng” for their support and assistance during the cruises.
Appendix A. Supplementary data
Supplementary data to this article can be found online athttps:// doi.org/10.1016/j.ecss.2019.106268.
References
Angel, M.V., 1993. Biodiversity of the pelagic ocean. Conserv. Biol. 7, 760–772.
Agatha, S., 2008. Redescription of the tintinnid ciliate Tintinnopsis fimbriata Meunier, 1919 (Spirotricha, Choreotrichida) from coastal waters of northern Germany. Denisia 23, 261–272.
Attrill, M.J., Rundle, S.D., 2002. Ecotone or ecocline: ecological boundaries in estuaries. Estuar. Coast Shelf Sci. 55, 929–936.
Barnes, R.S.K., 1989. What, if anything, is a brackish fauna? Trans. R. Soc. Edinb. Earth Sci. 80, 235–240.
Bakker, C., Phaff, W.J., 1976. Tintinnida from coastal waters of the S.W.-Netherlands I. The genus Tintinnopsis stein. Hydrobiologia 50, 101–111.
Balkis, N., 2004. Tintinnids (Protozoa: Ciliophora) of the Buyukcekmece Bay in the sea of Marmara. Sci. Mar. 68, 33–44.
Calliari, D., Gómez, M., Gómez, N., 2005. Biomass and composition of the phytoplankton in the Río de la Plata: large-scale distribution and relationship with environmental variables during a spring cruise. Cont. Shelf Res. 25, 197–210.
Carter, J.C.H., Dadswell, M.J., 1983. Seasonal and spatial distribution of planktonic crustacea in the lower Saint John River, a multibasin estuary in New Brunswick, Canada. Estuaries 6, 142–153.
Chiang, S.C., 1956. Notes on the freshwater Tintinnoinea from Jiangsu and Anhui pro-vinces. Acta Hydrobiol. Sin. 1, 61–87.
Cognetti, G., Maltagliati, F., 2000. Biodiversity and adaptive mechanisms in brackish water fauna. Mar. Pollut. Bull. 40, 7–14.
David, V., Selleslagh, J., Nowaczyk, A., Dubois, S., Bachelet, G., Blanchet, H., Gouillieux, B., Lavesque, N., Leconte, M., Savoye, N., Sautour, B., Lobry, J., 2016. Estuarine habitats structure zooplankton communities: implications for the pelagic trophic pathways. Estuar. Coast Shelf Sci. 179, 99–111.
Dolan, J.R., Gallegos, C.L., 2001. Estuarine diversity of tintinnids (planktonic ciliates). J. Plankton Res. 23, 1009–1027.
Dolan, J.R., Pierce, R.W., 2013. Diversity and distributions of tintinnid ciliates. In: Dolan, J.R., Agatha, S., Coats, D.W. (Eds.), The Biology and Ecology of Tintinnid Ciliates: Models for Marine Plankton. Wiley-Blackwell, Oxford, pp. 214–243.
Dong, L.X., Su, J.L., Wong, L.A., Cao, Z.Y., Chen, J.C., 2004. Seasonal variation and dy-namics of the Pearl River plume. Cont. Shelf Res. 24, 1761–1777.
Elliott, M., McLusky, D.S., 2002. The need for definitions in understanding estuaries. Estuar. Coast Shelf Sci. 55, 815–827.
Elliott, M., Quintino, V., 2007. The estuarine quality paradox, environmental homeostasis and the difficulty of detecting anthropogenic stress in naturally stressed areas. Mar. Pollut. Bull. 54, 640–645.
Feng, M.P., Wang, C.F., Zhang, W.C., Zhang, G.T., Xu, H.L., Zhao, Y., Xiao, T., Wang, C.S., Wang, W.D., Bi, Y.X., Liang, J., 2018. Annual variation of species richness and lorica oral diameter characteristics of tintinnids in a semi-enclosed bay of western Pacific. Estuar. Coast Shelf Sci. 207, 164–174.
Godhantaraman, N., Uye, S., 2003. Geographical and seasonal variations in taxonomic composition, abundance and biomass of microzooplankton across a brackish-water lagoonal system of Japan. J. Plankton Res. 25, 465–482.
Gold, K., Morales, E.A., 1976. Studies on the sizes, shapes, and the development of the lorica of agglutinated tintinnida. Biol. Bull. 150, 377–392.
Gómez, N., Licursi, M., Cochero, J., 2009. Seasonal and spatial distribution of the mi-crobenthic communities of the Río de la Plata estuary (Argentina) and possible en-vironmental controls. Mar. Pollut. Bull. 58, 878–887.
Hada, Y., 1937. The fauna of Akkeshi Bay IV. The pelagic ciliata. J. Fac. Sci. 4, 143–216 Hokkaido Imperial University, Series VI, Zoology.
Hada, Y., 1938. Studies on the Tintinnoinea from the western tropical Pacific. J. Fac. Sci. 6, 87–190 Hokkaido Imperial University, Series VI, Zoology.
Huang, L.M., Jian, W.J., Song, X.Y., Huang, X.P., Liu, S., Qian, P.Y., Yin, K.D., Wu, M., 2004. Species diversity and distribution for phytoplankton of the Pearl River estuary during rainy and dry seasons. Mar. Pollut. Bull. 49, 588–596.
Islam, M.S., Ueda, H., Tanaka, M., 2005. Spatial distribution and trophic ecology of dominant copepods associated with turbidity maximum along the salinity gradient in a highly embayed estuarine system in Ariake Sea, Japan. J. Exp. Mar. Biol. Ecol. 316, 101–115.
Islam, M.S., Ueda, H., Tanaka, M., 2006. Spatial and seasonal variations in copepod communities related to turbidity maximum along the Chikugo estuarine gradient in the upper Ariake Bay, Japan. Estuar. Coast Shelf Sci. 68, 113–126.
Kamiyama, T., Tsujino, M., 1996. Seasonal variation in the species composition of tin-tinnid ciliates in Hiroshima bay, the Seto Inland Sea of Japan. J. Plankton Res. 18, 2313–2327.
Kazama, T., Urabe, J., 2016. Relative importance of physical and biological factors reg-ulating tintinnid populations: a field study with frequent samplings in Sendai Bay, Japan. Mar. Freshw. Res. 67, 492–504.
Khlebovich, V.V., Abramova, E.N., 2000. Some problems of crustacean taxonomy related to the phenomenon of Horohalinicum. Hydrobiologia 417, 109–113.
Kofoid, C.A., Campbell, A.S., 1929. A Conspectus of the Marine Freshwater Ciliata Belonging to the Suborder Tintinnoinea, with Descriptions of New Species Principally from the Agassiz Expedition to the Eastern Tropical Pacific 1904-1905. University of California press, California, pp. 1–403.
Kofoid, C.A., Campbell, A.S., 1939. Reports on the scientific results of the expedition to the eastern tropical Pacific, in charge of Alexander Agassiz, by the U. S. Fish Commission steamer “Albatross”, from October 1904 to March 1905, Lieut. -Commander L. M. Garrett, USN commanding. XXXVII. The Ciliata: the Tintinnoinea. Bull. Mus. Comp. Zool. Harvard 84, 1–473.
Laprise, F., Dodson, J.J., 1994. Environmental variability as a factor controlling spatial patterns in distribution and species diversity of zooplankton in the St. Lawrence the median zone was co-dominated by 2 copepods, while the
down-stream zone presented the highest diversity (David et al., 2016). The similar pattern was also observed in the Chikugo Estuary (Islam et al., 2005) and the Sendai Bay (Kazama and Urabe, 2016). The similar variation patterns of tintinnid and plankton communities along salinity gradient demonstrated that with the increase of salinity, structure of plankton communities become more complex.
4.3. Seasonal variations of tintinnid composition
The waxing and waning of different species within the system was the main reason causing the seasonal changes in tintinnid species compositions (Dolan and Pierce, 2013). The present study showed that 11 in 43 species occurred in 3 seasons, while 16 species only appeared in 1 season. This was consistent with previous studies that most tin-tinnid species have obvious seasonal occurrence (Modigh and Castaldo, 2002; Dolan and Pierce, 2013; Feng et al., 2018). A 4-year study sam-pled weekly in the Gulf of Naples indicated that none of the 10 most common species occurred even half the time and most occurred less than a third of the time (Modigh and Castaldo, 2002). A 10-year study sampled monthly at 4 stations in the Jiaozhou Bay showed that 10 species had a year-round distribution, 2 species occurred in 11 months while the other 14 species were found in less than 7 months (Feng et al., 2018).
As plenty of studies showed very distinct seasonal changes in the occurrence of individual tintinnid species, we sampled at 3 seasons (dry, rainy and transitional) in order to collect more tintinnid species in the Pearl River Estuary. The purpose of this study was to show tintinnid community variation along salinity gradient. Therefore we did not discuss too much on seasonal variation of tintinnid community in the Pearl River Estuary.
Estuary. Mar. Ecol. Prog. Ser. 107, 67–81.
Li, H.B., Zhao, Y., Chen, X., Zhang, W.C., Xu, J.H., Li, J., Xiao, T., 2016. Interaction between neritic and warm water tintinnids in surface waters of East China Sea. Deep-Sea Res. Pt. II 124, 84–92.
Lynn, D.H., 2008. Ciliated Protozoa: Characterization, Classification, and Guide to the Literature, third ed. Springer, Berlin, pp. 1–455.
Marshall, H.G., Alden, R.W., 1990. A comparison of phytoplankton assemblages and environmental relationships in three estuarine rivers of the lower Chesapeake Bay. Estuaries 13, 287–300.
Marshall, H.G., Alden, R.W., 1993. A comparison of phytoplankton assemblages in the Chesapeake and Delaware estuaries (USA), with emphasis on diatoms. Hydrobiologia 269, 251–261.
McLusky, D.S., Elliott, M., 2004. The Estuarine Ecosystem - Ecology, Threats and Management. Oxford University Press, pp. 1–214.
Modéran, J., Bouvais, P., David, V., Le Noc, S., Simon-Bouhet, B., Niquil, N., Miramand, P., Fichet, D., 2010. Zooplankton community structure in a highly turbid environ-ment (Charente estuary, France): spatio-temporal patterns and environenviron-mental con-trol. Estuar. Coast Shelf Sci. 88, 219–232.
Modigh, M., Castaldo, S., 2002. Variability and persistence in tintinnid assemblages at a Mediterranean coastal site. Aquat. Microb. Ecol. 28, 299–311.
Muylaert, K., Sabbe, K., Vyverman, W., 2009. Changes in phytoplankton diversity and community composition along the salinity gradient of the Schelde estuary (Belgium/ The Netherlands). Estuar. Coast Shelf Sci. 82, 335–340.
Nie, D.S., 1933. Notes on three new species of fresh-water Tintinnoidea. Zool. Ser. 9, 165–175.
Petz, W., Foissner, W., 1993. Morphogenesis in some freshwater tintinnids (Ciliophora, Oligotrichida). Eur. J. Protistol. 29, 106–120.
Pierce, R.W., Turner, J.T., 1993. Global biogeography of marine tintinnids. Mar. Ecol. Prog. Ser. 94, 11–26.
Rakshit, D., Ganesh, P.S., Sarkar, S.K., 2016a. Choreotrich ciliate tintinnid (Protozoa: Ciliophora) in a tropical meso-macrotidal estuary, eastern part of India. Reg. Stud. Mar. Sci. 3, 89–100.
Rakshit, D., Sarkar, S.K., Satpathy, K.K., Ganesh, P.S., Godhantaraman, N., Biswas, J.K., 2016b. Diversity and distribution of microzooplankton tintinnid (Ciliata: Protozoa) in the core region of Indian Sundarban wetland. Clean. - Soil, Air, Water 44, 1278–1286.
Remane, A., 1934. Die brackwasserfauna. Verhandlungen Dtsch. Zool. Ges. 36, 34–74.
Rogers, G.F., Roff, J.C., Lynn, D.H., 1982. Tintinnids of Chesterfield inlet, Northwest Territories. Can. J. Zool. 59, 2360–2364.
Sautour, B., Castel, J., 1995. Comparative spring distribution of zooplankton in three macrotidal European estuaries. Hydrobiologia 311, 139–151.
Sivasankar, R., Ezhilarasan, P., Kumar, P.S., Naidu, S.A., Rao, G.D., Kanuri, V.V., Rao, V.R., Ramu, K., 2018. Loricate ciliates as an indicator of eutrophication status in the estuarine and coastal waters. Mar. Pollut. Bull. 129, 207–211.
Smith, S.A., Song, W., Gavrilova, N.A., Kurilov, A.V., Liu, W., McManus, G.B., Santoferrara, L.F., 2018. Dartintinnus alderae n. g., n. sp., a brackish water tintinnid (Ciliophora, Spirotrichea) with dual-ended lorica collapsibility. J. Eukaryot. Microbiol. 65, 400–411.
Sniezek, J.H., Capriulo, G.M., Small, E.B., Russo, A., 1991. Nolaclusilis hudsonicus n. sp (Nolaclusiliidae n. fam.) a bilaterally symmetrical tintinnine ciliate from the lower Hudson River Estuary. J. Protozool. 38, 589–594.
Snyder, R.A., Brownlee, D.C., 1991. Nolaclusilis bicornis n. g., n. sp. (Tintinnina, Tintinnidiidae): a tintinnine ciliate with novel lorica and cell morphology from the
composition and grazing impact on phytoplankton standing stock in the Pearl River Estuary, China. Cont. Shelf Res. 24, 1949–1968.
Telesh, I.V., Schubert, H., Skarlato, S.O., 2011a. Protistan diversity does peak in the horohalinicum of the Baltic Sea: reply to Ptacnik et al. (2011). Mar. Ecol. Prog. Ser. 432, 293–297.
Telesh, I.V., Schubert, H., Skarlato, S.O., 2011b. Revisiting Remane's concept: evidence for high plankton diversity and a protistan species maximum in the horohalinicum of the Baltic Sea. Mar. Ecol. Prog. Ser. 421, 1–11.
Telesh, I.V., Schubert, H., Skarlato, S.O., 2013. Life in the salinity gradient: discovering mechanisms behind a new biodiversity pattern. Estuar. Coast Shelf Sci. 135, 317–327.
Urrutxurtu, I., 2004. Seasonal succession of tintinnids in the Nervion River estuary, Basque Country, Spain. J. Plankton Res. 26, 307–314.
Urrutxurtu, I., Orive, E., Sota, A.D.l., 2003. Seasonal dynamics of ciliated protozoa and their potential food in an eutrophic estuary (Bay of Biscay). Estuar. Coast Shelf Sci. 57, 1169–1182.
Wang, Y.B., Zhang, W.J., Lin, Y.S., Zheng, L.M., Cao, W.Q., Yang, J., 2014. Spatial and seasonal variations of large tintinnid ciliates in Shenhu Bay of China. Oceanol. Hydrobiol. Stud. 43, 292–302.
Whitfield, A.K., Elliott, M., Basset, A., Blaber, S.J.M., West, R.J., 2012. Paradigms in es-tuarine ecology - a review of the Remane diagram with a suggested revised model for estuaries. Estuar. Coast Shelf Sci. 97, 78–90.
Winkler, G., Dodson, J.J., Bertrand, N., Thivierge, D., Vincent, W.F., 2003. Trophic coupling across the St. Lawrence River estuarine transition zone. Mar. Ecol. Prog. Ser. 251, 59–73.
Wong, L.A., Chen, J.C., Dong, L.X., 2004. A model of the plume front of the Pearl River Estuary, China and adjacent coastal waters in the winter dry season. Cont. Shelf Res. 24, 1779–1795.
Yin, K.T., 1952. Primitive investigation of tintinnids in Jiaozhou Bay. J. Shandong Univ. 2, 36–56 (In Chinese).
Yoo, K.I., Kim, Y.O., Kim, D.Y., 1988. Taxonomic studies on tintinnids (Protozoa: Ciliata) in Korean coastal waters. 1. Chinhae Bay. Korean J. Syst. Zool. 4, 67–90.
Yoo, K.I., Kim, Y.O., 1990. Taxonomical studies on tintinnids (Protozoa: ciliata) in Korean coastal waters. 2. Yongil Bay. Korean J. Syst. Zool. 6, 87–122.
Zhang, C.X., Zhang, W.C., Tian, X., Lu, R.H., Song, S., Song, W.B., 2008. Meso-scale spatial distribution of large tintinnids in early summer in southern Yellow Sea. Chin. J. Oceanol. Limnol. 26, 81–90.
Zhang, W.C., Wang, R., 2000. Summertime ciliate and copepod nauplii distribution and microzooplankton herbivorous activity in the Laizhou Bay, Bohai Sea, China. Estuar. Coast Shelf Sci. 51, 103–114.
Zhang, W.C., Feng, M.P., Yu, Y., Zhang, C.X., Xiao, T., 2012. An Illustrated Guide to Contemporary Tintinnids in the World. Science Press, Beijing (in Chinese).
Zhang, W.C., Feng, M.P., Yu, Y., Chen, X.M., Xiao, T., 2014. A new tintinnid ciliate (Ciliophora: Spirotrichea) from Yangtze River Estuary, with notes on its habitat. Zool. Syst. 39, 372–379.
Zheng, B., Gu, D.J., Wen, H.C., 2012. Application of a hydrological digital elevation model on the Zhujiang River basin for freshwater discharge into the South China Sea. Mar. Sci. 36 (9), 108–113 (In Chinese with English abstract).
Chesapeake Bay Estuary. J. Protozool. 38, 583–589.
Tackx, M.L.M., Pauw, N.D., Mieghem, R.V., Azémar, F., Hannouti, A., Damme, S.V., Fiers, F., Daro, N., Meire, P., 2004. Zooplankton in the Schelde estuary, Belgium and The Netherlands. Spatial and temporal patterns. J. Plankton Res. 26, 133–141.