HAL Id: hal-02357329
https://hal.umontpellier.fr/hal-02357329
Submitted on 24 Nov 2019
HAL is a multi-disciplinary open access
archive for the deposit and dissemination of sci-entific research documents, whether they are pub-lished or not. The documents may come from
L’archive ouverte pluridisciplinaire HAL, est destinée au dépôt et à la diffusion de documents scientifiques de niveau recherche, publiés ou non, émanant des établissements d’enseignement et de
Analyzing remotely sensed structural and chemical
canopy traits of a forest invaded by Prunus serotina over
multiple spatial scales
Michael Ewald, Sandra Skowronek, Raf Aerts, Klara Dolos, Jonathan Lenoir,
Manuel Nicolas, Jens Warrie, Tarek Hattab, Hannes Feilhauer, Olivier
Honnay, et al.
To cite this version:
Michael Ewald, Sandra Skowronek, Raf Aerts, Klara Dolos, Jonathan Lenoir, et al.. Analyzing re-motely sensed structural and chemical canopy traits of a forest invaded by Prunus serotina over multi-ple spatial scales. Biological Invasions, Springer Verlag, 2018, 20 (8), pp.2257-2271. �10.1007/s10530-018-1700-9�. �hal-02357329�
Analyzing remotely sensed structural and
chemical canopy traits of a forest invaded
by Prunus serotina over multiple spatial
scales
Michael Ewald1, Sandra Skowronek2, Raf Aerts3, Klara Dolos1, Jonathan Lenoir4,
Manuel Nicolas5, Jens Warrie3, Tarek Hattab4,6, Hannes Feilhauer2, Olivier Honnay3, Carol Ximena Garzón-López4,7, Guillaume Decocq4, Ruben Van De Kerchove8, Ben
Somers9, Duccio Rocchini10,11,12, and Sebastian Schmidtlein1
1Institute of Geography and Geoecology, Karlsruhe Institute of Technology (KIT),
Kaiserstr. 12, 76131 Karlsruhe, Germany
2Institute of Geography, FAU Erlangen-Nuremberg, Wetterkreuz 15, 91058 Erlangen,
Germany
3Biology Department, KU Leuven, Kasteelpark Arenberg 31-2435, 3001 Leuven, Belgium 4UR “Ecologie et Dynamique des Systèmes Anthropisés” (EDYSAN, UMR 7058 CNRS),
Université de Picardie Jules Verne, 1 rue des Louvels, 80037 Amiens Cedex 1, France
5Département Recherche et Dèveloppement, Office National des Forêts, Boulevard de
Constance, 77300 Fontainebleau, France
6Institut Français de Recherche pour l’Exploitation de la Mer, UMR MARBEC, Avenue
Jean Monnet CS, Sète, France
7Ecology and Vegetation physiology group (EcoFiv), Universidad de los Andes, Cr. 1E
No 18A,Bogotá, Colombia
8VITO Flemish institute for technological research, Boeretang 200, 2400 Mol, Belgium 9Department of Earth & Environmental Sciences, KU Leuven, Celestijnenlaan 200E,
3001 Leuven, Belgium
10Department of Biodiversity and Molecular Ecology, Research and Innovation Centre,
Fondazione Edmund Mach, Via E. Mach 1, 38010 San Michele all’Adige, TN, Italy
11Center Agriculture Food Environment, University of Trento, Via E. Mach 1, 38010 S.
Michele all’Adige (TN), Italy
12Centre for Integrative Biology, University of Trento, Via Sommarive, 14, 38123 Povo
(TN), Italy
Non-native invasive plant species can influence ecosystem functioning over broad spatial scales, but most research on ecosystem impacts has focused on the plot level covering sampling units of only a few square meters or less.
We used a multi-scale approach to analyze structural and leaf chemical vegetation traits depending on the presence of non-native American black cherry (P. serotina) in a mixed deciduous forest at the plot level and at the forest stand level. Trait data were derived from remotely sensed maps of leaf area index (LAI), wood volume as well as canopy leaf nitrogen content (Nmass), phosphorus content (Pmass), and N:P ratio. Differences in these traits were compared between invaded and non-invaded areas at the plot level using 264 sampling units with a size of 25 m × 25 m and in 4119 forest management units (mean area: 7.6 ± 5.1 ha).
Observed patterns between invaded and non-invaded areas were similar at both spatial scales. Invaded areas were characterized by less wood vol-ume, indicating that lower standing biomass promotes the occurrence of P.
serotina. In contrast, LAI did not differ between invaded and non-invaded
areas. Furthermore, the presence of P. serotina trees had an impact on the chemical composition of the forest canopy by decreasing leaf N:P. While for Pmass, we found no differences between invaded and non-invaded areas, for Nmasswe observed an invasion effect, though only at the plot level. Using re-motely sensed trait data proved valuable to evaluate the relevance of invasion impacts at broader scales.
1 Introduction
Non-native invasive plant species can have manifold impacts on ecosystems, by changing biotic or abiotic conditions through many different pathways (Ehrenfeld, 2010; Weiden-hamer and Callaway, 2010; Gaertner et al., 2014). Due to effective spreading and fast growth they are often found to build up dense populations and can thus change the composition of native plant communities and locally decrease biodiversity (Powell et al., 2011; Vilà et al., 2011; Pyšek et al., 2012). Besides altering community composition, in-vasive plant species can also influence ecosystem properties or processes (Stricker et al., 2015). For instance, the presence of non-native invasive plant species has often been associated with an increase in above-ground biomass, above ground nutrient stocks, and nutrient concentrations in the topsoil (Liao et al., 2008; Dassonville et al., 2008; Weidenhamer and Callaway, 2010; Vilà et al., 2011).
Changes in ecosystem properties are often related to increased primary production (Vilà et al., 2011) that can be attributed to the fast growing character of many invasive plant species (van Kleunen et al., 2010). Fast growth is generally related to low invest-ments of carbon in leafs associated with higher leaf N and P concentrations (Wright et al., 2004). Hence, many invasive plant species are characterized by higher leaf N and P concentrations (e.g. Thorpe et al., 2006; Kurokawa et al., 2010; Jäger et al., 2013) or increased total N and P uptake (e.g. Windham and Ehrenfeld, 2003; Chapuis-Lardy et al., 2006; Aguilera et al., 2010) compared to co-occurring native species. Changes in community level above-ground nutrient contents can be caused by direct or indirect effects. An direct effect can be for example an increase of community level above-ground
nitrogen, due to high uptake by an invasive species. Indirect effects can include increased nitrogen or phosphorus concentrations in the leaves of co-occurring native species due to nutrient mobilization (Fisher et al., 2006; Kurten et al., 2008). However, invasive plants can also reduce nutrient concentrations in the leaves of co-occurring species (Aerts et al., 2017), presumably as an effect of resource competition (Vilà and Weiner, 2004).
The majority of studies dealing with ecosystem impacts of invasive plants have been limited to plot based observations or experiments, in which each sampling unit is covering areas of only few square meters (Parker et al., 1999; Stricker et al., 2015). While this is a valid approach to understand effects of invasion processes it provides little information about the spatial relevance of such impacts. Besides the per capita or per biomass impact of an invasive species, its broad scale ecosystem impact depends on its range size and its occurrence prevalence within the area of interest (Parker et al., 1999; Thiele et al., 2009). Moreover, the spatial distribution patters of invasive plant species can differ across spatial scales, and similarly also their ecological effects (Pauchard and Shea, 2006). Plot level studies of invasion effects thus provide only part of the information needed to evaluate its overall ecosystem impact. Evaluating the impact of an invader at multiple spatial scales will provide a more comprehensive picture of its impact (Parker et al., 1999; Pauchard and Shea, 2006), and therefore also valuable information for prioritizing management actions.
Remote sensing offers great opportunities to support ecological research addressing multiple spatial scales by providing spatial explicit projections of vegetation traits. Such projections include structural vegetation traits such as biomass or LAI (Zheng and Moskal, 2009; Fassnacht et al., 2014; Kumar et al., 2015), chemical leaf traits such as chlorophyll or nitrogen content (Asner et al., 2015; Singh et al., 2015) and plant functional types (Ustin and Gamon, 2010; Kattenborn et al., 2017). Applications of remote sensing in invasion ecology have mainly focused on mapping and monitoring the distribution of invasive plant species (Bradley, 2014) holding potential to detect early invasion stages (Rocchini et al., 2015; Skowronek et al., 2017). However, remote sensing data can also be used to detect invasion impacts on ecosystem functioning over large areas in a spatially continuous manner (Asner and Vitousek, 2005; Vicente et al., 2013). In this study, we applied a multi-scale approach to investigate the impact of an inva-sive tree species on structural and chemical vegetation traits in a mixed deciduous forest using sampling units of different size. Impacts were analyzed at the plot level and at the level of forest management units, hereafter referred to as stand level. Our target species was Prunus serotina, an alien invasive tree species in Western and Central Europe. In its non-native range P. serotina mainly occurs on nutrient poor acidic soils within oak and pine forests (Starfinger et al., 2003; Closset-Kopp et al., 2010) and is promoted by high light availability in canopy gaps or in forests characterized by sparse canopies (Vanhelle-mont et al., 2008; Terwei et al., 2013). Reported impacts of P. serotina outside of its native range include changes of soil conditions and understory plant communities in for-est ecosystems (Halarewicz and Pruchniewicz, 2015). Especially as a shrub, P. serotina can form very dense populations and dramatically reduce understory light availability (Starfinger et al., 2003). P. serotina is characterized by higher leaf nitrogen and phos-phorus contents than most of the co-occurring native tree species (Aerts et al., 2017),
thereby showing potential to alter nutrient cycling in forest ecosystems. At the plot level, P. serotina has been found to decrease leaf nitrogen content of co-occurring Eu-ropean beech (Fagus sylvatica) and to increase leaf phosphorus contents of co-occurring Scots pine (Pinus sylvestris) (Aerts et al., 2017). Differences in structural and chemical traits were analyzed dependent on stand type, stand age, soil pH and the presence of
P. serotina in the tree layer at the plot level and at the forest stand level. Using this
multi scale approach we aimed to get a more comprehensive picture of ecosystem changes caused by P. serotina.
2 Materials and methods
2.1 Study area
The forest of Compiégne (northern France, coordinates: N 49.370, W 2.886), covering an area of 144.2 km2, is located in the oceanic climate zone with a mean annual temperature of 10.3◦Cand a mean annual precipitation of 677 mm. Soils are formed of nutrient-poor sandy substrate in the northern part of the forest and nutrient rich calcareous substrate in the southern part (Chabrerie et al., 2008). The forest is mainly managed as even-aged stands of beech (Fagus sylvatica), oaks (Quercus robur, Quercus petrea) and pine (Pinus sylvestris), which often also occur in mixed stands. These stands are frequently intermingled with European hornbeam (Carpinus betulus) and ash (Fraxinius excelsior ). Stands can reach ages of more than 200 years (Chabrerie et al., 2008). P. serotina was introduced to the area around 1850 and has since then spread across a substantial part of the forest (Fig. 1) (Chabrerie et al., 2008). Although P. serotina is affected by frequent thinning, it is often highly abundant in the shrub layer and can locally become the dominant tree species within the forest canopy.
2.2 Data
Spatial forest stand information
We used forest inventory maps from the year 2009, providing polygons with information on stand age (9 different classes ranging from “0-20 years” to “older than 200 years”) and up to four dominant tree species for each of the 2846 forest management units (Tab. 1, supplementary material Fig. S1). We classified stand types according to the most dominant tree species of each forest stand. Stands consisting of three or more tree species exceeding 20 % of total canopy cover were classified as mixed stands.
Soil pH map
Information on soil pH was obtained from a soil pH map at 25 m × 25 m resolution covering the entire study area (Tab. 1, supplementary material Fig. S1). This map was generated through regression-kriging using 161 point measurements of topsoil pH and including soil type, elevation, slope, bedrock geology and a litter quality index as predictors (for more information see Hattab et al. (2017)).
● ● ● ● ● ● ● ● ● ● ● ● ● ● ● ● ● ● ● ● ● ● ● ● ● ● ● ● ● ● ● ● ● ● ● ● ● ● ● ● ● ●● ● ● ● ● ● ● ● ● ● ● ● ● ● ● ● ● ● ● ● ● ● ● ● ● ● ● ● ● ● ● ● ● ● ● ● ● ● ● ● ● ● ● ● ● ● ● ● ● ● ● ● ● ● ● ● ● ● ● ● ● ● ● ● ● ● ● ● ● ● ● ● ● ● ● ● ● ● ● ● ● ● ● ● ● ● ● ● ● ● ● ● ● ● ● ● ● ● ● ● ● ● ● ● ● ● ● ● ● ● ● ● ● ● ● ● ● ● ● ● ● ● ● ● ● ● ● ● ● ● ● ●● ●● ● ●● ● ● ● ● ● ● ● ● ● ● ●● ● ● ●●●● ● ● ● ● ● ● ● ● ● ● ● ● ● ● ● ● ● ● ● ● ● ● ● ● ● ● ● ● ● ● ● ● ● ● ● ● ●● ● ● ● ●● ● ●● ● ● ● ● ● ● ● ● ● ● ● ● ● ● ●● ● ● ● ● ●●● ● ● ● ● ● ● ● ● ● ● ● ● ● ● ● ● ● ● ● ● ● ● ● ● ● ● ● ●● ● ● ● ● ● ● ●● ● ●● ● ● ● ● ●● ● ●● ●●● ● ● ● ● ● ● ● ● ● ● ● ● ● ● ● ● ● 0 5 km Invasion no high
Figure 1 Study area with forest management units and presence-absence locations used for analyses at the stand and plot level respectively. Colors indicate estimated frequency of P. serotina trees within the management units (Data from Chabrerie et al. (2007))
Table 1 Overview of data used as basis for response and predictor variables.
Variable Data type Variable type Data source
Response LAI raster continuous Combination of remote sensing
and field data
Wood volume raster continuous Combination of remote sensing and field data
Nmass raster continuous Combination of remote sensing
and field data
Pmass raster continuous Combination of remote sensing
and field data
N:P ratio raster continuous Combination of remote sensing and field data
Predictors Soil pH raster continuous (Hattab et al., 2017)
P. serotina presence ∗ point factor (2 levels) Field acquisition
P. serotina presence ∗∗ polygon factor (5 levels) (Chabrerie et al., 2007) Stand type polygon factor (4 levels) Forest inventory data Stand age polygon factor (9 levels) Forest inventory data
∗ only used for analyses at the plot level ∗∗ only used for analyses at the stand level
Data on P. serotina presence
For the analysis of differences between invaded and non-invaded parts of the forest at the plot level we sampled information on presence-absence of P. serotina in the tree canopy within 336 field plots with a size of 25 m × 25 m (Tab. 1, Fig. 1). Presence-absence data were recorded between July and October 2015 throughout the whole forest area combining random sampling with an environmental systematic mapping (Hattab et al., 2017).
For the stand level we used 6432 polygons with information on the occurrence of P.
serotina in the tree layer in 6 discrete classes ranging from 0 to 5 (0: no P. serotina, 1:
isolated individuals, 2: scattered aggregates of individuals, 3: fragmented populations, 4: large, continuous population, 5: dominant canopy tree species over the entire stand) based on field sampling between the years 2003 and 2004 (Chabrerie et al., 2007). Be-cause of its low sample size, class 5 was merged with class 4. In order to join information on stand type/age and occurrence of P. serotina trees we calculated a spatial overlay of the two polygon maps.
Remotely sensed maps of structural and chemical traits
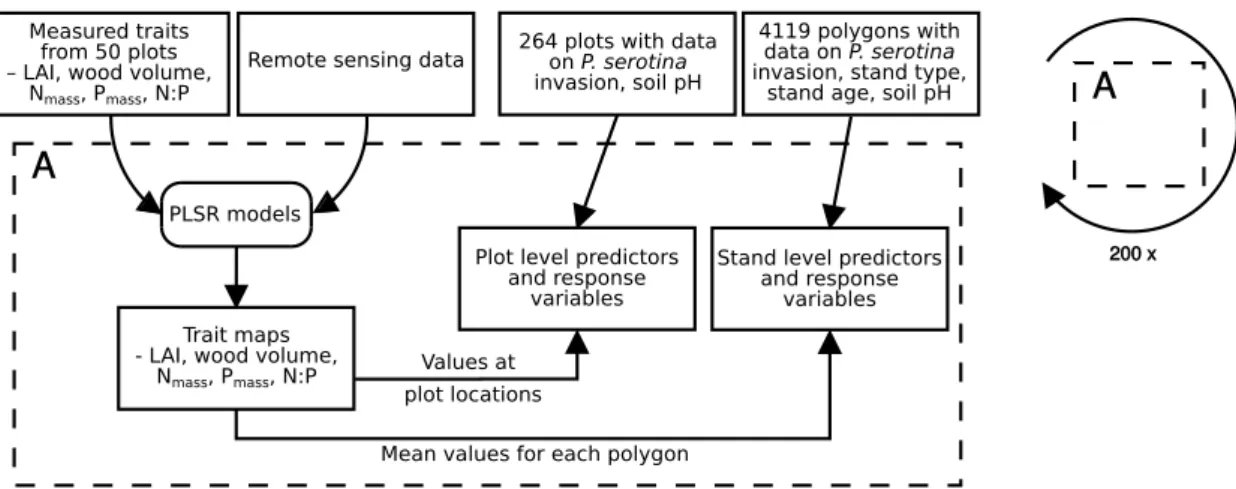
To compare structural and chemical vegetation traits within invaded and non-invaded parts of the forests we used maps for leaf area index (LAI), wood volume, canopy nitrogen content (Nmass), canopy phosphorus content (Pmass), and canopy N:P ratio, based on a combination of field derived trait and remote sensing data (Tab. 1). Remote sensing data consisted of airborne imaging spectroscopy data (248 bands, 380 — 2500 nm) acquired in July 2014 by the Airborne Prism Experiment (APEX) spectrometer (Schaepman et al., 2015) with a spatial resolution of 3 m × 3 m, and airborne discrete return LiDAR data with an average point density of 23 points m−2. (for detailed information on remote sensing data, and its processing see supplementary material Data S1). For mapping LAI, wood volume, Nmass, Pmass and N:P, we used partial least squares regression models that were calibrated by field-derived trait data (Fig. 2, for more information see supplementary material Data S2). In order to get more robust predictions, model calculations were embedded in a repeated data splitting procedure with 200 repetitions. For each iteration a random set of 10 out of 50 field plots was not included in model calibration. Predictive models resulted in mean Pearson r2 values of 0.48, 0.72, 0.41, 0.63 and 0.61 in leave-one-out cross-validation for LAI, wood volume, Nmass, Pmass and N:P respectively. Spectral bands and LiDAR-derived variables were used to predict 200 maps for LAI, wood volume, Nmass, Pmass and N:P from the resulting models of each data split. Finally, for each trait, we calculated median maps representing the median value for each pixel from those 200 prediction maps (supplementary material Fig. S2). 2.3 Data processing
We created two different datasets: one for the analysis of impacts by P. serotina at the plot level and one for the analyses at the stand level (Fig. 2). For both datasets we extracted information on stand type, stand age, soil pH, LAI, wood volume, Nmass,
Measured traits from 50 plots – LAI, wood volume,
Nmass, Pmass, N:P
4119 polygons with data on P. serotina invasion, stand type,
stand age, soil pH 264 plots with data
on P. serotina invasion, soil pH Remote sensing data
PLSR models
Trait maps - LAI, wood volume,
Nmass, Pmass, N:P
Plot level predictors and response
variables
Stand level predictors and response
variables
plot locations Values at
Mean values for each polygon
Figure 2Work-flow illustrating the retrieval of response and predictor datasets at the plot and at the stand level (for more information on used variables see Tab. 1). Trait maps were generated using predictions from partial least squares regression (PLSR) models.
Pmass and N:P from the available set of maps. Information from raster maps (pH, LAI, wood volume, Nmass, Pmass, N:P) was extracted for all pixels intersecting with an square of 25 m × 25 m around the presence-absence locations and all pixels intersecting with the polygons representing forest stands, respectively. For soil pH we calculated median values for each location and forest stand. Extracted pixel values of the remaining variables were averaged. For LAI, wood volume, Nmass, Pmass and N:P this procedure was repeated for each of the 200 predicted maps and the median map. We only considered mixed stands and stands dominated by F. sylvatica, Q. robur or P. sylvestris for the subsequent analyses. Mixed stands were usually only represented by broadleaved tree species. Other stand types were excluded from the analyses because of their small sample size. Furthermore, for the analyses at the stand level polygons smaller than 0.5 ha were not considered as stands and thus discarded from the data set. This resulted in 264 samples for analyses at the plot level and 4119 polygons (mean area: 7.6 ha, maximum area: 34.5 ha, standard error: ± 5.1 ha) for analyses at the stand level.
2.4 Statistical analyses
We aimed to analyze the four vegetation traits (LAI, wood volume, Nmass, Pmass, N:P) depending on P. serotina presence (plot level) or invasion degree (stand level) and stand type (Tab. 1), considering the confounding effects of soil pH and stand age. Both plot and stand level data were analyzed using the same procedure (Fig. 3). We ran mixed effects models using each of the four studied vegetation traits as response variables, whereas stand type, soil pH and invasion by P. serotina were used as fixed effects and stand age class was integrated as a grouping factor. In a first step we built preliminary models for each response variable using values extracted from the median prediction maps. These models were used to select an appropriate model type (model family) and link function by visual examination of quantile-quantile plots. Additionally, preliminary
models were used to test for spatial autocorrelation (SAC) in the residuals. For this purpose we calculated the centroids of polygons representing forest stands. SAC was tested calculating the Moran’s I value between residuals ordered by distance in uniformly distributed distance classes. Class width was 200 m for plot level models and 50 m for stand level models. For all response variables we observed considerable SAC.
Response variables LAI, wood volume,
Nmass, Pmass, N:P
(200 x each) Predictors invasion, stand type,
soil pH, stand age
Median values Decision
Preliminary models: selection of model family,
correlation function accounting for SAC
Candidate models: 5 response variables, 5 predictor combinations AIC based selection Final models: 5 response variables 200 x
Figure 3 Work-flow illustrating the steps of statistical analyses of structural and chemical canopy traits depending on the presence of P. serotina, stand type and soil pH and stand age (for more information on response and predictor variables see Tab. 1). The presented procedure was used for analyses at both the plot and stand level. SAC: Spatial autocorrelation.
We chose linear mixed effects models with identity link and a Gaussian error distri-bution (LMM) as quantile-quantile plots suggested this for all variables at the plot level as well as for LAI, wood volume, Nmass and N:P ratio at the stand level. We accounted for SAC by integrating a correlation function into the model (Dormann et al., 2007). For all response variables an exponential correlation function was chosen based on visual examination of the residual’s correlogram (Dormann et al., 2007).
To select the best set of predictors we successively calculated five candidate models. Each candidate model included different predictor variable combinations (see Tab. 2, Fig. 3) for each of the four response variables. This procedure was repeated 200 times for each dataset resulting from the 200 prediction maps respectively. For each of the response variables, we selected the final conceptual model according to lowest median AIC values resulting from 200 model repetitions (Tab. 2).
To test for differences between included fixed effects we extracted parameter coeffi-cients and calculated the differences between the coefficoeffi-cients of all possible factor com-binations for each of the 200 calculated models. In a second step we checked if these differences were significantly different from zero by calculating the 95 % confidence in-tervals.
Data processing and statistical analyses were performed using R 3.3.1 (R Core Team, 2016). SAC was tested using the package ncf 1.1 (Bjornstad, 2016) and LMMs were calculated using the package nlme 3.1 (Pinheiro et al., 2016).
3 Results
Table 2 Median AIC and Pearson r2 values of the five candidate linear mixed effect models for LAI, wood volume, Nmass, Pmass and N:P. Results are presented for analyses at the plot level and the forest
stand level. Bold values indicate lowest AIC values. pH: soil pH, stand type: forest stand.type defined by dominating tree species, stand.age: stand age comprising 9 age classes, invasion.tree: Invasion of P.
serotina in the tree layer (presence-absence for plot level data and five classes for stand level data)
Response Model Fixed effects Grouping r2 r2 AIC AIC
factor plot stand plot stand
LAI M1 pH stand.age 0.41 0.24 711.2 6843
M2 invasion.tree + pH stand.age 0.41 0.24 714.7 6845 M3 stand.type + pH stand.age 0.52 0.39 675.4 6430
M4 invasion.tree + stand.type + pH stand.age 0.52 0.40 679.3 6447 M5 invasion.tree + stand.type +
inva-sion.tree:stand.type + pH
stand.age 0.53 0.40 681.1 6479
Wood M1 pH stand.age 0.22 0.27 2159 29314
volume M2 invasion.tree + pH stand.age 0.23 0.29 2155 29286
M3 stand.type + pH stand.age 0.23 0.30 2150 29257 M4 invasion.tree + stand.type + pH stand.age 0.24 0.32 2145 29226 M5 invasion.tree + stand.type +
inva-sion.tree:stand.type + pH
stand.age 0.26 0.32 2131 29187
Nmass M1 pH stand.age 0.18 0.04 1132 13223
M2 invasion.tree + pH stand.age 0.19 0.08 1129 13225 M3 stand.type + pH stand.age 0.32 0.33 1088 12534 M4 invasion.tree + stand.type + pH stand.age 0.33 0.34 1088 12543 M5 invasion.tree + stand.type +
inva-sion.tree:stand.type + pH
stand.age 0.35 0.34 1082 12569
Pmass M1 pH stand.age 0.22 0.22 -122 -6349
M2 invasion.tree + pH stand.age 0.23 0.24 -119.3 -6343 M3 stand.type + pH stand.age 0.33 0.29 -139.4 -6499 M4 invasion.tree + stand.type + pH stand.age 0.34 0.30 -132.8 -6477 M5 invasion.tree + stand.type +
inva-sion.tree:stand.type + pH
stand.age 0.34 0.29 -121 -6414
N:P M1 pH stand.age 0.12 0.03 1388 17335
M2 invasion.tree + pH stand.age 0.15 0.07 1380 17351 M3 stand.type + pH stand.age 0.37 0.33 1306 16751 M4 invasion.tree + stand.type + pH stand.age 0.39 0.34 1302 16751 M5 invasion.tree + stand.type +
inva-sion.tree:stand.type + pH
stand.age 0.40 0.33 1296 16760
In all LMMs stand type was included as predictor variable, irrespective of the response variable for both plot and stand level (Tab. 2). This indicated a high influence of species-specific differences in the variation of observed canopy traits, LAI, wood volume, Nmass, Pmass and N:P ratio. Best models after AIC-based model selection also included invasion by P. serotina for wood volume, N:P and Nmass (Tab. 2). However, for Nmass an influence of P. serotina was only apparent at plot level and not at the stand level. Furthermore, for N:P models at the stand level integration of P. serotina invasion reduced AIC values only moderately (16751.1 vs. 16750.7). LAI and Pmassdid not differ between invaded and non-invaded parts of the forest, irrespective of the spatial scale. Final models
resulted in mean Pearson r2 values between 0.26 and 0.52 at the plot level and between
0.29 and 0.39 at the stand level (Tab. 2).
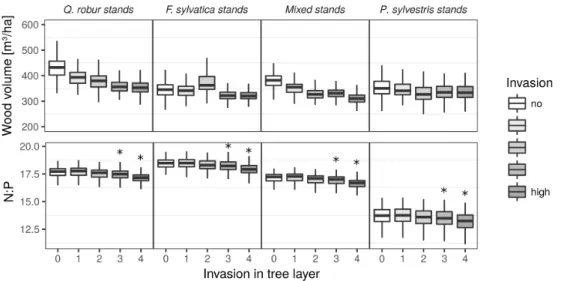
While the presence of P. serotina in the tree layer was connected to lower wood volume at the stand level for all forest types, we observed no clear trend at the plot level (Figs. 4 and 5). Here, wood volume was higher at sites with P. serotina trees in Q. robur and mixed stands, whereas it was lower in F. sylvatica and P. sylvestris stands, though not significant for the latter two. At the plot level, presence of textitP. serotina trees was connected to significantly lower Nmassin mixed deciduous stands and higher Nmassin P.
sylvestris stands (Figs. 4 and 5). Canopy N:P ratios observed at the plot level were lower
in F. sylvatica and mixed deciduous stands when P. serotina trees were present. When looking at the stand level, P. serotina presence was related to decreased N:P ratios for all stand types, but only for invasion classes 3 and 4, representing large fragmented up to continuous populations of P. serotina trees (Figs. 4 and 5).
Figure 4 Predicted values of 200 repeated model calculations for wood volume and canopy N:P depending on the occurrence of P. serotina trees at the stand level for different stand types
characterized by the dominant tree species. P. serotina occurrence is grouped into 5 classes (0: no P.
serotina, 1: isolated individuals, 2: scattered aggregates of individuals, 3: fragmented populations, 4:
large, continuous population). Asterisks indicate significant differences from areas without presence of
P. serotina trees resulting from a comparison of model coefficients from 200 model repetitions. Results
are displayed for stands with an age of 90-100 years and a soil pH value of 5.96.
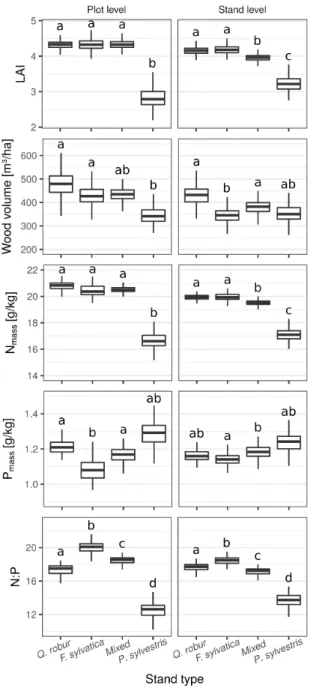
Stand type specific differences of canopy traits were similar across fine and broad spatial scales for LAI, Nmass, Pmass and N:P ratio (Fig. 6 and 7). Most apparent was a lower LAI and lower Nmass in pine stands, depicting the functional differences between broadleaved tree species and the coniferous P. sylvestris. Despite the observation of lowest Pmass and highest N:P values in beech dominated stands, differences between broadleaved forest stands were low. For wood volume we observed no consistent pattern between the stand types, when comparing plant and stand level results (Fig. 6).
Figure 5 Predicted values of 200 repeated model calculations for Wood volume, Nmass and N:P
depending on the presence of P. serotina trees at the plot level (based on presence-absence locations) for different stand types characterized by the dominant tree species. Soil pH was kept constant. Asterisks indicate significant differences between invaded and non-invaded sites resulting from a comparison of model coefficients from 200 model repetitions. Results are displayed for stands with an age of 90-100 years and a soil pH value of 5.96.
4 Discussion
Influences of P. serotina on canopy chemical traits
Regarding leaf N:P, our results suggest that P. serotina has the potential to alter forest canopy chemical stoichiometry across scales. While previous field studies found evidence for ecosystem impacts of P. serotina at the plot level (Halarewicz and Pruchniewicz, 2015; Aerts et al., 2017) we could now demonstrate the relevance of impacts on forest ecosystems also at larger scales. Observed differences in leaf chemical composition be-tween invaded and non invaded areas can be explained by direct and indirect effects of P.
serotina. We can assume that P. serotina directly influenced canopy N:P due to its leaf
chemical stoichiometry differing from the resident species (Aerts et al., 2017). This also conforms to the results of a recent meta-study by Lee et al. (2017), which showed that impacts of invasive plant species on N cycling were mainly driven by trait differences between invaders and native plant communities.
An indirect way of altering canopy chemistry would presuppose that P. serotina was able to influence leaf chemical traits of the co-occurring resident tree species. In fact,
Figure 6 Predicted values of 200 repeated model calculations for LAI, wood volume, canopy Nmass,
Pmass and N:P depending on stand types characterized by the dominant tree species. Predictions from
plot level models are displayed on the left, predictions from stand level models on the right. Characters indicate significant differences between stand types resulting from a comparison of model coefficients from 200 model repetitions. Results are displayed for non-invaded stands with an age of 90-100 years and a soil pH value of 5.96.
Aerts et al. (2017) observed that P. serotina increased Pmassof co-occuring P. sylvestris and decreased Nmass of co-occuring F. sylvatica. One possible driver is resource
compe-Figure 7 Map segments showing trait values derived from remote sensing at the original resolution with 24 m pixel size (above) and aggregated to the single forest management units as used for the analyses at the stand level (center). Polygon maps at the bottom display stand-level information on stand type, stand age and P. serotina occurrence.
tition causing reduced soil nutrient availability for the resident species and consequently also reduced leaf nutrient contents. This is one possible reason for the reduced Nmassin invaded areas at the plot level and for reduced N:P ratios observed at the stand level. Another possible pathway is improved soil nutrient availability through alterations of litter chemical composition. Early successional fast-growing tree species like P. serotina are often characterized by lower resorption rates of leaf nutrients from senescent leaves (Sardans et al., 2015) that are also depicted in higher litter nutrient contents (Richard-son et al., 2005) accelerating litter decomposition. Likewise, P. serotina has been found to accelerate litter decomposition (Aerts et al., 2017) which may have increased nutrient availability in the topsoil resulting in higher Nmass of the co-occurring trees species, like observed in invaded P. sylvestris stands.
The leaf N:P ratio can be used as an indicator for plant nutrient status giving infor-mation on productivity and tree vitality (Güsewell, 2004). In the last decades leaf N:P
ratios have increased across European forests presumably resulting from high nitrogen deposition (Jonard et al., 2015; Talkner et al., 2015; Sardans et al., 2016). Mean ob-served N:P ratios in our study area (20.5, 18.3 and 11.7 in the leaves of F. sylvatica, Q.
robur and P. sylvestris respectively), already exceeded the tolerable ranges suggested
by (Mellert and Göttlein, 2012), indicating P deficiency. In that respect, a potential reduction of leaf N:P ratios by P. serotina can be rather considered positive.
Structural differences between invaded an non-invaded areas
Invaded mixed deciduous and Q. robur stands were characterized by less wood volume than non-invaded ones. In contrast, invaded P. sylvestris stands showed slightly higher wood volume at the plot level, though not significant. This pattern can be attributed to the strong demand for light of P. serotina (Vanhellemont et al., 2008; Terwei et al., 2013) and different light conditions in broad-leaved and pine stands. Broad-leaved stands in our study area were characterized by lower light availability at the forest floor compared to pine stands (see Fig. 6). Therefore, in broadleaved stands P. serotina establishment is constrained to canopy gaps caused by natural and anthropogenic disturbances (Chabrerie et al., 2008; Closset-Kopp et al., 2010). As a result, stands with less wood volume were characterized by a higher infestation of P. serotina. In pine stands, light availability at forest floor is usually sufficient for P. serotina establishment and therefore we did not observe significant differences between invaded and non-invaded stands.
Contrary to differences in wood volume, we found no differences in LAI between in-vaded and non-inin-vaded areas. As discussed above, P. serotina establishment is promoted by high light availability which is related to lower LAI values. Our finding suggests that
P. serotina is able to quickly compensate lower LAI needed for its establishment by its
own biomass. This agrees with previous studies reporting dense cover of P. serotina in the shrub layer and reduced light availability at the forest floor. The latter is regarded as most influential factor for inhibiting natural forest regeneration (Starfinger et al., 2003; Halarewicz and Pruchniewicz, 2015).
Evaluating invasion impacts across scales
We found general agreement between patterns observed at the plot and the stand level. Most important, we found evidence for invasion effects on canopy nutrient-contents caused by P. serotina also when taking larger areas into account. Due to the fact, that in many cases it is unknown how invasion effects on biogeochemical cycles scale up (Weidenhamer and Callaway, 2010), such information is very valuable to evaluate invasion impacts. Additionally it may be important for evaluation of invasion effects on ecosystem services, which are usually accounted for at larger spatial scales (Eviner et al., 2012). Previous studies assessing plant invasion impacts over multiple scales al-most solely focused on effects on plant community composition. The results of these studies underline the importance of mulit-scale assessments (Fridley et al., 2007). While plant invasions generally tend to decrease local biodiversity when looking at the fine scale, this effect is smaller or even opposed at broader spatial scales (Gaertner et al.,
2009; Powell et al., 2011, 2013). Besides the evidence for spatial relevance, also the observation that invasion impacts were dependent from the occurrence frequency of P.
serotina delivered valuable information. This result suggests that P. serotina can
influ-ence leaf nutrient stoichiometry already when forest stands are affected by fragmented populations of individuals present in the tree layer. Interpreting this result, it is impor-tant to consider that at the moment single individuals reach the tree layer in many cases there is already subsequent recruitment present in the shrub layer, that may also influ-ence canopy nutrient stoichiometry indirectly. Our results confirm that consideration of the spatial distribution patterns of species abundances or prevalences are an important aspect for evaluating invasion impacts (Thiele et al., 2009).
Contrary to leaf N:P ratio, for Nmass we found an invasion effect only at the plot, but not at the forest stand level. This finding indicates, that the influence of P. serotina on canopy leaf N contents alone is less substantial than its influence on N:P rations. The interpretation of observed differences between scales is strongly limited due to the high temporal mismatch between P. serotina occurrence data used for the plot and the stand level analysis. Since 2004 P. serotina further spread within the forest area, but was also partly removed in some management units in the course of thinning activities. Apart from the temporal mismatch in used data, differences between the two scales, may be also caused by strongly decreased variability at the stand level, by calculation mean values. This may have lead to smaller differences between invaded and non invaded areas compared to the plot level (Wiens, 1989). This effect at least can be observed when comparing differences between stand types at the plot and the stand level (see Fig. 6).
Remote sensing data proved useful to characterize differences between invaded and non invaded areas beyond the plot level, thereby highlighting its potential for quantification of invasion impacts across scales. This includes impacts on vegetation or ecosystem properties that otherwise are only hard to obtain across large areas. It is important to note that many plant functional traits, like Nmassand Pmassare not directly represented in the spectral signal of plant canopies (Ollinger, 2011). Thus, relationships between such traits and canopy reflectance can be established only via empirical models, which have to be calibrated with field data (Verrelst et al., 2015). Limitations of empirical relationships arise from their strong site specificity making predictions of traits under novel environmental conditions difficult (Ollinger, 2011).
Apart from providing maps of vegetation traits, applications of remote sensing in invasion ecology most commonly relate to mapping distributions of invasive plant species (Huang and Asner, 2009). Resulting maps can be used to study spatial distribution patterns of invasive plant species across scales and thus provide valuable information for the management of invasive species. Similar to traits, transferring models for mapping species distributions to other study areas is challenging, but feasible when focusing on distinct habitat types (Skowronek et al., 2018). Such model transfer is an important prerequisite for efficient early detection of invasive plant species. One major limitation for the use of remote sensing in invasion ecology evolves from the trade-off between resolution and coverage. Depending on the size of the target species, monitoring plant invasions requires fine resolution remote sensing particularly for the purpose of early
detection (Bradley, 2014). Such fine resolution data have become readily available by the use of sensors mounted on unmanned areal vehicles (UAV), but usually only over limited spatial extents.
5 Conclusion
We assessed differences in structural and chemical forest canopy traits between invaded and non-invaded areas at the plot and the stand level. Using this multi scale approach provided a more comprehensive picture on patterns and impacts of P. serotina invasions. Particularly, the assessment of invasion impacts over larger areas beyond the plot level provided valuable additional information on the spatial relevance of invasion impacts. Such information can help to prioritize management actions, by focusing on species that affect ecosystems over large areas. For the evaluation of potential impacts of plant invasions we thus recommend observations at a coarser spatial grain to supplement plot-level observations. Remotely sensed vegetation trait maps proved useful for this kind of multi-scale assessments.
Acknowledgements
This study is part of the project DIARS (Detection of invasive plant species and as-sessment of their impact on ecosystem properties through remote sensing) funded by the ERA-Net BiodivERsA, with the national funders: ANR (Agence Nationale de la Recherche); BelSPO (Belgian Federal Science Policy Office); and DFG (Deutsche Forschungsgemeinschaft). Michael Ewald is funded through the DFG research grant SCHM 2153/9-1. The authors would like to thank the Office National for providing airborne LiDAR data. We also wish to thank Jérôme Piat, Luc Croisé, Fabien Spicher and Anthony Viaud for their help during field work.
References
Aerts, R., Ewald, M., Nicolas, M., Piat, J., Skowronek, S., Lenoir, J., Hattab, T., Garzón-López, C.X., Feilhauer, H., Schmidtlein, S., Rocchini, D., Decocq, G., Somers, B., Van De Kerchove, R., Denef, K., Honnay, O., 2017. Invasion by the alien tree
Prunus serotina alters ecosystem functions in a temperate deciduous forest. Frontiers
in Plant Science 8, 179. doi:10.3389/fpls.2017.00179.
Aguilera, A.G., Alpert, P., Dukes, J.S., Harrington, R., 2010. Impacts of the inva-sive plant Fallopia japonica (Houtt.) on plant communities and ecosystem processes. Biological Invasions 12, 1243–1252. doi:10.1007/s10530-009-9543-z.
Asner, G.P., Martin, R.E., Anderson, C.B., Knapp, D.E., 2015. Quantifying forest canopy traits: Imaging spectroscopy versus field survey. Remote Sensing of Environ-ment 158, 15–27. doi:10.1016/j.rse.2014.11.011.
Asner, G.P., Vitousek, P.M., 2005. Remote analysis of biological invasion and biogeo-chemical change. Proceedings of the National Academy of Sciences of the United States of America 102, 4383–4386. doi:10.1073/pnas.0500823102.
Bjornstad, O.N., 2016. ncf: Spatial nonparametric covariance functions, R package version 1.1-7.
Bradley, B.A., 2014. Remote detection of invasive plants: a review of spectral, textu-ral and phenological approaches. Biological Invasions 16, 1411–1425. doi:10.1007/ s10530-013-0578-9.
Chabrerie, O., Roulier, F., Hoeblich, H., Sebert-Cuvillier, E., Closset-Kopp, D., Leblanc, I., Jaminon, J., Decocq, G., 2007. Defining patch mosaic functional types to predict invasion patterns in a forest landscape. Ecological Applications 17, 464–481. doi:10. 1890/06-0614.
Chabrerie, O., Verheyen, K., Saguez, R., Decocq, G., 2008. Disentangling relationships between habitat conditions, disturbance history, plant diversity, and American black cherry Prunus serotina Ehrh.) invasion in a European temperate forest. Diversity and Distributions 14, 204–212. doi:10.1111/j.1472-4642.2007.00453.x.
Chapuis-Lardy, L., Vanderhoeven, S., Dassonville, N., Koutika, L.S., Meerts, P., 2006. Effect of the exotic invasive plant Solidago gigantea on soil phosphorus status. Biology and Fertility of Soils 42, 481–489. doi:10.1007/s00374-005-0039-4.
Closset-Kopp, D., Saguez, R., Decocq, G., 2010. Differential growth patterns and fitness may explain contrasted performances of the invasive Prunus serotina in its exotic range. Biological Invasions 13, 1341–1355. doi:10.1007/s10530-010-9893-6.
Dassonville, N., Vanderhoeven, S., Vanparys, V., Hayez, M., Gruber, W., Meerts, P., 2008. Impacts of alien invasive plants on soil nutrients are correlated with initial site conditions in NW Europe. Oecologia 157, 131–140. doi:10.1007/s00442-008-1054-6. Dormann, C.F., McPherson, J.M., Araújo, M.B., Bivand, R., Bolliger, J., Carl, G., Davies, R.G., Hirzel, A., Jetz, W., Kissling, W.D., Kühn, I., Ohlemüller, R., Peres-Neto, P.R., Reineking, B., Schröder, B., Schurr, F.M., Wilson, R., 2007. Methods to account for spatial autocorrelation in the analysis of species distributional data: a review. Ecography 30, 609–628. doi:10.1111/j.2007.0906-7590.05171.x.
Ehrenfeld, J.G., 2010. Ecosystem consequences of biological invasions. Annual Review of Ecology, Evolution, and Systematics 41, 59–80. doi:10.1146/annurev-ecolsys-102209-144650.
Eviner, V.T., Garbach, K., Baty, J.H., Hoskinson, S.A., 2012. Measuring the effects of invasive plants on ecosystem services: challenges and prospects. Invasive Plant Science and Management 5, 125–136. doi:10.1614/IPSM-D-11-00095.1.
Fassnacht, F.E., Hartig, F., Latifi, H., Berger, C., Hernández, J., Corvalán, P., Koch, B., 2014. Importance of sample size, data type and prediction method for remote sensing-based estimations of aboveground forest biomass. Remote Sensing of Environment 154, 102–114. doi:10.1016/j.rse.2014.07.028.
Fisher, J.L., Veneklaas, E.J., Lambers, H., Loneragan, W.A., 2006. Enhanced soil and leaf nutrient status of a Western Australian Banksia woodland community invaded by
Ehrharta calycina and Pelargonium capitatum. Plant and Soil 284, 253–264. doi:10.
1007/s11104-006-0042-z.
Fridley, J.D., Stachowicz, J.J., Naeem, S., Sax, D.F., Seabloom, E.W., Smith, M.D., Stohlgren, T.J., Tilman, D., Holle, B.V., 2007. The invasion paradox: reconcil-ing pattern and process in species invasions. Ecology 88, 3–17. doi:10.1890/0012-9658(2007)88[3:TIPRPA]2.0.CO;2.
Gaertner, M., Biggs, R., Te Beest, M., Hui, C., Molofsky, J., Richardson, D.M., 2014. Invasive plants as drivers of regime shifts: identifying high-priority invaders that alter feedback relationships. Diversity and Distributions 20, 733–744. doi:10.1111/ddi. 12182.
Gaertner, M., Breeyen, A.D., Hui, C., Richardson, D.M., 2009. Impacts of alien plant invasions on species richness in Mediterranean-type ecosystems: a meta-analysis. Progress in Physical Geography 33, 319–338. doi:10.1177/0309133309341607. Güsewell, S., 2004. N : P ratios in terrestrial plants: variation and functional significance.
New Phytologist 164, 243–266. doi:10.1111/j.1469-8137.2004.01192.x.
Halarewicz, A., Pruchniewicz, D., 2015. Vegetation and environmental changes in a Scots pine forest invaded by Prunus serotina: what is the threat to terricolous bryophytes? European Journal of Forest Research 134, 793–801. doi:10.1007/s10342-015-0890-2.
Hattab, T., Garzón-López, C.X., Ewald, M., Skowronek, S., Aerts, R., Horen, H., Brasseur, B., Gallet-Moron, E., Spicher, F., Decocq, G., Feilhauer, H., Honnay, O., Kempeneers, P., Schmidtlein, S., Somers, B., Van De Kerchove, R., Rocchini, D., Lenoir, J., 2017. A unified framework to model the potential and realized distribu-tions of invasive species within the invaded range. Diversity and Distribudistribu-tions 23, 806–819. doi:10.1111/ddi.12566.
Huang, C.y., Asner, G.P., 2009. Applications of remote sensing to alien invasive plant studies. Sensors 9, 4869–4889. doi:10.3390/s90604869.
Jonard, M., Fürst, A., Verstraeten, A., Thimonier, A., Timmermann, V., Potočić, N., Waldner, P., Benham, S., Hansen, K., Merilä, P., Ponette, Q., de la Cruz, A.C., Roskams, P., Nicolas, M., Croisé, L., Ingerslev, M., Matteucci, G., Decinti, B., Basci-etto, M., Rautio, P., 2015. Tree mineral nutrition is deteriorating in Europe. Global Change Biology 21, 418–430. doi:10.1111/gcb.12657.
Jäger, H., Alencastro, M.J., Kaupenjohann, M., Kowarik, I., 2013. Ecosystem changes in Galápagos highlands by the invasive tree Cinchona pubescens. Plant and Soil 371, 629–640. doi:10.1007/s11104-013-1719-8.
Kattenborn, T., Fassnacht, F.E., Pierce, S., Lopatin, J., Grime, J.P., Schmidtlein, S., 2017. Linking plant strategies and plant traits derived by radiative transfer modelling. Journal of Vegetation Science 28, 717–727. doi:10.1111/jvs.12525.
Kumar, L., Sinha, P., Taylor, S., Alqurashi, A.F., 2015. Review of the use of remote sensing for biomass estimation to support renewable energy generation. Journal of Applied Remote Sensing 9, 097696. doi:10.1117/1.JRS.9.097696.
Kurokawa, H., Peltzer, D.A., Wardle, D.A., 2010. Plant traits, leaf palatability and litter decomposability for co-occurring woody species differing in invasion status and nitrogen fixation ability. Functional Ecology 24, 513–523. doi:10.1111/j.1365-2435. 2009.01676.x.
Kurten, E.L., Snyder, C.P., Iwata, T., Vitousek, P.M., 2008. Morella cerifera invasion and nitrogen cycling on a lowland Hawaiian lava flow. Biological Invasions 10, 19–24. doi:10.1007/s10530-007-9101-5.
Lee, M.R., Bernhardt, E.S., van Bodegom, P.M., Cornelissen, J.H.C., Kattge, J., Laugh-lin, D.C., Niinemets, U., Peñuelas, J., Reich, P.B., Yguel, B., Wright, J.P., 2017. Inva-sive species’ leaf traits and dissimilarity from natives shape their impact on nitrogen cycling: a meta-analysis. New Phytologist 213, 128–139. doi:10.1111/nph.14115. Liao, C., Peng, R., Luo, Y., Zhou, X., Wu, X., Fang, C., Chen, J., Li, B., 2008.
Al-tered ecosystem carbon and nitrogen cycles by plant invasion: a meta-analysis. New Phytologist 177, 706–714. doi:10.1111/j.1469-8137.2007.02290.x.
Mellert, K.H., Göttlein, A., 2012. Comparison of new foliar nutrient thresholds derived from van den Burg’s literature compilation with established central European refer-ences. European Journal of Forest Research 131, 1461–1472. doi:10.1007/s10342-012-0615-8.
Ollinger, S.V., 2011. Sources of variability in canopy reflectance and the convergent properties of plants. New Phytologist 189, 375–394. doi:10.1111/j.1469-8137.2010. 03536.x.
Parker, I.M., Simberloff, D., Lonsdale, W.M., Goodell, K., Wonham, M., Kareiva, P.M., Williamson, M.H., Holle, B.V., Moyle, P.B., Byers, J.E., Goldwasser, L., 1999. Impact: toward a framework for understanding the ecological effects of invaders. Biological Invasions 1, 3–19. doi:10.1023/A:1010034312781.
Pauchard, A., Shea, K., 2006. Integrating the study of non-native plant invasions across spatial scales. Biological Invasions 8, 399–413. doi:10.1007/s10530-005-6419-8.
Pinheiro, J., Bates, D., DebRoy, S., Sarkar, D., R Core Team, 2016. nlme: Linear and nonlinear mixed effects models, R package version 3.1-128. URL: http://CRAN.R-project.org/package=nlme.
Powell, K.I., Chase, J.M., Knight, T.M., 2011. A synthesis of plant invasion effects on biodiversity across spatial scales. American Journal of Botany 98, 539–548. doi:10. 3732/ajb.1000402.
Powell, K.I., Chase, J.M., Knight, T.M., 2013. Invasive plants have scale-dependent effects on diversity by altering species-area relationships. Science 339, 316–318. doi:10. 1126/science.1226817.
Pyšek, P., Jarošík, V., Hulme, P.E., Pergl, J., Hejda, M., Schaffner, U., Vilà, M., 2012. A global assessment of invasive plant impacts on resident species, commu-nities and ecosystems: the interaction of impact measures, invading species’ traits and environment. Global Change Biology 18, 1725–1737. doi:10.1111/j.1365-2486.2011.02636.x.
R Core Team, 2016. R: A Language and Environment for Statistical Computing. R Foundation for Statistical Computing, Vienna, Austria. URL: https://www.R-project.org/.
Richardson, S.J., Peltzer, D.A., Allen, R.B., McGlone, M.S., 2005. Resorption pro-ficiency along a chronosequence: responses among communities and within species. Ecology 86, 20–25. doi:10.1890/04-0524.
Rocchini, D., Andreo, V., Förster, M., Garzon-Lopez, C.X., Gutierrez, A.P., Gillespie, T.W., Hauffe, H.C., He, K.S., Kleinschmit, B., Mairota, P., Marcantonio, M., Metz, M., Nagendra, H., Pareeth, S., Ponti, L., Ricotta, C., Rizzoli, A., Schaab, G., Ze-bisch, M., Zorer, R., Neteler, M., 2015. Potential of remote sensing to predict species invasions: A modelling perspective. Progress in Physical Geography: Earth and En-vironment 39, 283–309. doi:10.1177/0309133315574659.
Sardans, J., Alonso, R., Janssens, I.A., Carnicer, J., Vereseglou, S., Rillig, M.C., Fernández-Martínez, M., Sanders, T.G.M., Peñuelas, J., 2016. Foliar and soil con-centrations and stoichiometry of nitrogen and phosphorous across European Pinus
sylvestris forests: relationships with climate, N deposition and tree growth.
Func-tional Ecology 30, 676–689. doi:10.1111/1365-2435.12541.
Sardans, J., Janssens, I.A., Alonso, R., Veresoglou, S.D., Rillig, M.C., Sanders, T.G., Carnicer, J., Filella, I., Farré-Armengol, G., Peñuelas, J., 2015. Foliar elemental composition of European forest tree species associated with evolutionary traits and present environmental and competitive conditions. Global Ecology and Biogeography 24, 240–255. doi:10.1111/geb.12253.
Schaepman, M.E., Jehle, M., Hueni, A., D’Odorico, P., Damm, A., Weyermann, J., Schneider, F.D., Laurent, V., Popp, C., Seidel, F.C., Lenhard, K., Gege, P., Küchler,
C., Brazile, J., Kohler, P., De Vos, L., Meuleman, K., Meynart, R., Schläpfer, D., Kneubühler, M., Itten, K.I., 2015. Advanced radiometry measurements and Earth science applications with the Airborne Prism Experiment (APEX). Remote Sensing of Environment 158, 207–219. doi:10.1016/j.rse.2014.11.014.
Singh, A., Serbin, S.P., McNeil, B.E., Kingdon, C.C., Townsend, P.A., 2015. Imaging spectroscopy algorithms for mapping canopy foliar chemical and morphological traits and their uncertainties. Ecological Applications 25, 2180–2197. doi:10.1890/14-2098.1.
Skowronek, S., Ewald, M., Isermann, M., Kerchove, R.V.D., Lenoir, J., Aerts, R., Warrie, J., Hattab, T., Honnay, O., Schmidtlein, S., Rocchini, D., Somers, B., Feilhauer, H., 2017. Mapping an invasive bryophyte species using hyperspectral remote sensing data. Biological Invasions 19, 239–254. doi:10.1007/s10530-016-1276-1.
Skowronek, S., Van De Kerchove, R., Rombouts, B., Aerts, R., Ewald, M., Warrie, J., Schiefer, F., Garzón-López, C., Hattab, T., Honnay, O., Lenoir, J., Rocchini, D., Schmidtlein, S., Somers, B., Feilhauer, H., 2018. Transferability of species distribution models for the detection of an invasive alien bryophyte using imaging spectroscopy data. International Journal of Applied Earth Observation and Geoinformation 68, 61–72. doi:10.1016/j.jag.2018.02.001.
Starfinger, U., Kowarik, I., Rode, M., Schepker, H., 2003. From desirable ornamental plant to pest to accepted addition to the flora? – the perception of an alien tree species through the centuries. Biological Invasions 5, 323–335. doi:10.1023/B:BINV. 0000005573.14800.07.
Stricker, K.B., Hagan, D., Flory, S.L., 2015. Improving methods to evaluate the impacts of plant invasions: lessons from 40 years of research. AoB Plants 7, plv028. doi:10. 1093/aobpla/plv028.
Talkner, U., Meiwes, K.J., Potočić, N., Seletković, I., Cools, N., Vos, B.D., Rautio, P., 2015. Phosphorus nutrition of beech (Fagus sylvatica L.) is decreasing in Europe. Annals of Forest Science 72, 919–928. doi:10.1007/s13595-015-0459-8.
Terwei, A., Zerbe, S., Zeileis, A., Annighöfer, P., Kawaletz, H., Mölder, I., Ammer, C., 2013. Which are the factors controlling tree seedling establishment in North Italian floodplain forests invaded by non-native tree species? Forest Ecology and Management 304, 192–203. doi:10.1016/j.foreco.2013.05.003.
Thiele, J., Kollmann, J., Markussen, B., Otte, A., 2009. Impact assessment revisited: improving the theoretical basis for management of invasive alien species. Biological Invasions 12, 2025–2035. doi:10.1007/s10530-009-9605-2.
Thorpe, A.S., Archer, V., DeLuca, T.H., 2006. The invasive forb, Centaurea maculosa, increases phosphorus availability in Montana grasslands. Applied Soil Ecology 32, 118–122. doi:10.1016/j.apsoil.2005.02.018.
Ustin, S.L., Gamon, J.A., 2010. Remote sensing of plant functional types. New Phytol-ogist 186, 795–816. doi:10.1111/j.1469-8137.2010.03284.x.
van Kleunen, M., Weber, E., Fischer, M., 2010. A meta-analysis of trait differences between invasive and non-invasive plant species. Ecology Letters 13, 235–245. doi:10. 1111/j.1461-0248.2009.01418.x.
Vanhellemont, M., Verheyen, K., Keersmaeker, L.D., Vandekerkhove, K., Hermy, M., 2008. Does Prunus serotina act as an aggressive invader in areas with a low propagule pressure? Biological Invasions 11, 1451–1462. doi:10.1007/s10530-008-9353-8. Verrelst, J., Camps-Valls, G., Muñoz-Marí, J., Rivera, J.P., Veroustraete, F., Clevers,
J.G.P.W., Moreno, J., 2015. Optical remote sensing and the retrieval of terrestrial vegetation bio-geophysical properties – A review. ISPRS Journal of Photogrammetry and Remote Sensing 108, 273–290. doi:10.1016/j.isprsjprs.2015.05.005.
Vicente, J.R., Pinto, A.T., Araújo, M.B., Verburg, P.H., Lomba, A., Randin, C.F., Guisan, A., Honrado, J.P., 2013. Using life strategies to explore the vulnerability of ecosystem services to invasion by alien plants. Ecosystems 16, 678–693. doi:10.1007/ s10021-013-9640-9.
Vilà, M., Espinar, J.L., Hejda, M., Hulme, P.E., Jarošík, V., Maron, J.L., Pergl, J., Schaffner, U., Sun, Y., Pyšek, P., 2011. Ecological impacts of invasive alien plants: a meta-analysis of their effects on species, communities and ecosystems. Ecology Letters 14, 702–708. doi:10.1111/j.1461-0248.2011.01628.x.
Vilà, M., Weiner, J., 2004. Are invasive plant psecies better competitors than native plant species?: evidence from pair-wise experiments. Oikos 105, 229–238. doi:10. 1111/j.0030-1299.2004.12682.x.
Weidenhamer, J.D., Callaway, R.M., 2010. Direct and indirect effects of invasive plants on soil chemistry and ecosystem function. Journal of Chemical Ecology 36, 59–69. doi:10.1007/s10886-009-9735-0.
Wiens, J.A., 1989. Spatial scaling in ecology. Functional Ecology 3, 385–397. doi:10. 2307/2389612.
Windham, L., Ehrenfeld, J.G., 2003. Net impact of a plant invasion on nitrogen-cycling processes within a brackish tidal marsh. Ecological Applications 13, 883–896. doi:10. 1890/02-5005.
Wright, I.J., Reich, P.B., Westoby, M., Ackerly, D.D., Baruch, Z., Bongers, F., Cavender-Bares, J., Chapin, T., Cornelissen, J.H.C., Diemer, M., Flexas, J., Garnier, E., Groom, P.K., Gulias, J., Hikosaka, K., Lamont, B.B., Lee, T., Lee, W., Lusk, C., Midgley, J.J., Navas, M.L., Niinemets, U., Oleksyn, J., Osada, N., Poorter, H., Poot, P., Prior, L., Pyankov, V.I., Roumet, C., Thomas, S.C., Tjoelker, M.G., Veneklaas, E.J., Villar, R., 2004. The worldwide leaf economics spectrum. Nature 428, 821–827. doi:10.1038/ nature02403.
Zheng, G., Moskal, L.M., 2009. Retrieving elaf area index (LAI) using remote sensing: theories, methods and sensors. Sensors 9, 2719–2745. doi:10.3390/s90402719.