HAL Id: hal-01978322
https://hal.archives-ouvertes.fr/hal-01978322
Submitted on 13 Feb 2019HAL is a multi-disciplinary open access archive for the deposit and dissemination of sci-entific research documents, whether they are pub-lished or not. The documents may come from teaching and research institutions in France or abroad, or from public or private research centers.
L’archive ouverte pluridisciplinaire HAL, est destinée au dépôt et à la diffusion de documents scientifiques de niveau recherche, publiés ou non, émanant des établissements d’enseignement et de recherche français ou étrangers, des laboratoires publics ou privés.
Toxicological impact of acute exposure to E171 food
additive and TiO2 nanoparticles on a co-culture of
Caco-2 and HT29-MTX intestinal cells
Marie Dorier, Céline Tisseyre, Fanny Dussert, David Béal, Marie-Edith Arnal,
Thierry Douki, Vanessa Valdiglesias, Blanca Laffon, Sonia Fraga, Fatima
Brandao, et al.
To cite this version:
Marie Dorier, Céline Tisseyre, Fanny Dussert, David Béal, Marie-Edith Arnal, et al.. Toxicological impact of acute exposure to E171 food additive and TiO2 nanoparticles on a co-culture of Caco-2 and HT29-MTX intestinal cells. Mutation Research - Genetic Toxicology and Environmental Mutagenesis, Elsevier, 2019, 845, pp.402980. �hal-01978322�
1 This document is an author version of the manuscript that has been published in Mutation Research - Genetic Toxicology and Environmental Mutagenesis (2018), under the doi: 10.1016/j.mrgentox.2018.11.004
Toxicological impact of acute exposure to E171 food additive and TiO2 nanoparticles on
a co-culture of Caco-2 and HT29-MTX intestinal cells
Marie Dorier1, Céline Tisseyre1, Fanny Dussert1, David Béal1, Marie-Edith Arnal1,
Thierry Douki1, Vanessa Valdiglesias2, Blanca Laffon2, Sónia Fraga3,4, Fátima
Brandão3,4, Nathalie Herlin-Boime5, Frédérick Barreau6, Thierry Rabilloud7, Marie
Carriere1,*
1
Univ. Grenoble-Alpes, CEA, CNRS, INAC-SyMMES, Chimie Interface Biologie pour l’Environnement, la Santé et la Toxicologie (CIBEST), 38000 Grenoble, France.
2
Universidade da Coruña, DICOMOSA Group, Department of Psychology, Area of
Psychobiology, Edificio de Servicios Centrales de Investigación, Campus Elviña s/n, 15071-A
Coruña, Spain.
3
National Institute of Health, Dept. of Environmental Health, Porto, Portugal
4
EPIUnit – Institute of Public Health, University of Porto, Porto, Portugal
5
NIMBE, CEA, CNRS, Université Paris-Saclay, CEA Saclay 91191 Gif-sur-Yvette France.
6
INSERM, UMR 1220, Institut de Recherche en Santé Digestive, Toulouse, France.
7
ProMD, UMR CNRS 5249, CEA Grenoble, DRF/BIG/CBM, Laboratory of Chemistry and
2 *Correspondence: Dr. Marie Carriere, marie.carriere@cea.fr, CEA-Grenoble
INAC/SyMMES/LAN, 17 rue des Martyrs 38054 Grenoble Cedex, France. Phone +33 4 38
78 03 28; Fax: +33 4 38 78 50 90
Declarations of interest: none
Abstract
TiO2 particles are widely used in products for everyday consumption, such as cosmetics and
food; their possible adverse effects on human health must therefore be investigated. The aim
of this study was to document in vitro impact of the food additive E171, i.e. TiO2, and of TiO2
nanoparticles, on a co-culture of Caco-2 and HT29-MTX cells, which is an in vitro model for
human intestine. Cells were exposed to TiO2 particles three days after seeding, i.e. while they
were not fully differentiated. Cell viability, reactive oxygen species (ROS) levels and DNA
integrity were assessed, by MTT assay, DCFH-DA assay, alkaline and Fpg-modified comet
assay and 8-oxo-dGuo measurement by HPLC-MS/MS. The mRNA expression of genes
involved in ROS regulation, DNA repair via base-excision repair, and endoplasmic reticulum
stress was assessed by RT-qPCR. Exposure to TiO2 particles resulted in increased
intracellular ROS levels, but did not impair cell viability and did not cause any oxidative
damage to DNA. Only minor changes in mRNA expression were detected. Altogether, this
shows that E171 food additive and TiO2 nanoparticles only produce minor effects to this in
vitro intestinal cell model.
3
1. Introduction
TiO2 has been used for more than 50 years as a food additive, under the code E171 within the
European Union. Indeed, because of its low toxicity and intestinal absorption, E171 has been
authorized since the ‘60ies without any established acceptable limitation of daily intake, in
Europe [1]. It is primarily used as a whitening agent and as an opacifier in pastries and sweets
[2, 3]. E171 is not a nanomaterial according to the EU Recommendation on the definition of a
nanomaterial (Official Journal of the European Union (2011/696/EU) 18/10/2011), because it
contains less than 50% of particles, in the number size distribution, with at least one diameter
below 100 nm, i.e., nanoparticles (NPs) [2, 4-6]. It is made of particles with average diameter
around 100-200 nm, with a high polydispersity. Its crystal structure is mainly anatase
although some samples were shown to be rutile [5, 6]; and it sometimes contains 0.5-1.8 mg
phosphorous (P)/g of TiO2 [6].
Several reports published during the past 2 years address the questions of toxicity and
absorption of E171. A single dosing of seven human volunteers to 100 mg of E171, ingested
as gelatin capsules, resulted in translocation of TiO2 particles to the bloodstream, with
maximal absorption 6 h after administration [7]. Given the observed kinetics, there may be
two routes of absorption from the human intestinal lumen, one proximal and one distal [7].
The authors of this study did not report any toxicity that may be associated with ingestion of
E171. In vivo, in a colitis-associated mouse model, E171 administered by oral gavage at 5
mg/kg b.w. per day, 5 days a week, for 10 weeks, enhanced the formation of colon tumors and
exacerbated tumor progression and colon inflammation [8]. The same authors did not report
any tumor formation in non-chemically induced mice exposed to E171, but some dysplastic
changes in colonic epithelium were reported, as well as decrease in the number of goblet cells
4 the mRNA expression of GPCR/olfactory and serotonin gene receptors, induced mRNA
expression of genes encoding proteins involved in oxidative stress, immune response
pathways, and DNA repair. Moreover exposure to E171 both up- and down-regulated genes
encoding proteins involved in the development of cancer [9]. In rats, low doses of E171
administered either by intragastric gavage for 7 days or via drinking water for 100 days (10
mg/kg b.w. per day) impaired immune homeostasis; they initiated and promoted the
expansion of preneoplastic lesions in the colon, although their number was low, and
concomitantly induced the development of a low-grade inflammatory microenvironment in
the mucosa [10]. In vitro, repeated exposure to E171 of a co-culture of Caco-2 and
HT29-MTX for 21 days induced accumulation of reactive oxygen species (ROS) and oxidized DNA
bases, but did not lead to cell mortality, DNA strand break or endoplasmic reticulum stress
[4]. Oxidized bases in DNA, especially 8-oxo-dGuo, are known to be mutagenic, because they
can pair with adenine (A) or cytosine (C) with equal efficiency, thus leading to G:C to
thymine (T):A transversion [11]. They may thus explain the carcinogenicity of E171 reported
by Bettini et al [10]. Finally, also in an in vitro experiment, Proquin et al. reported that E171
causes ROS accumulation in undifferentiated Caco-2 cells, together with single strand breaks
and/or alkali-labile sites in DNA, as probed via the comet assay [12]. Moreover it induced
chromosomal damage in HCT116 cells, as probed via the cytokinesis-block micronucleus
assay [12].
We aimed here at evaluating the toxicological impact of E171 and two model TiO2-NPs, A12
(anatase, 12 nm) and NM105 from the Joint Research Center at the European Commission
(anatase/rutile, 24 nm), on a co-culture of Caco-2 (enterocytic-like) and HT29-MTX
(mucus-secreting) cells. To recapitulate a mucus-secreting intestinal epithelium, the co-culture of
Caco-2 and HT29-MTX cells is usually grown for 21 days post-confluence, to allow cells to
5 fully differentiated. Contrary to differentiated Caco-2 cells, undifferentiated Caco-2 cells do
not express all the biochemical and morphological characteristics of human enterocytes. Their
phenotype is that of proliferating cells. In this condition, according to previous studies, their
sensitivity towards NPs is higher than that of differentiated Caco-2 cells [13, 14]. Conversely,
three days post-seeding, HT29-MTX cells already produce some mucus. This cell model was
acutely exposed for 6 h, 24 h or 48 h to A12, NM105 or E171. Cell viability, oxidative DNA
damage and ROS accumulation were investigated since oxidative stress is one of the main
mechanisms of TiO2 particle toxicity. In addition, impact of E171 and TiO2-NPs on actors of
the UPR pathway, which is activated in ER stress condition [15], was also investigated
because NP toxicity through ER stress signaling pathway has previously been reported
[16-18] and because ER stress is closely related to oxidative stress [19]. Finally, impact on mRNA
expression of DNA repair proteins was investigated by RT-qPCR.
Our results show that E171 was not cytotoxic even at high concentrations, but caused ROS
accumulation in exposed cells, whatever the dose. E171 did not have major impact on DNA
integrity, and did not significantly modulate the mRNA expression of proteins involved in
DNA repair, in antioxidant defense system and in the UPR pathway. Consequently, these
results suggest that TiO2, either micro- or nano-sized, exhibits minor effects on this in vitro
6
2. Material and Methods
2.1. Chemicals and reagents
Unless otherwise indicated, chemicals were all purchased from Sigma-Aldrich and were >99
% pure. Cell culture media and serum were purchased from Thermo Fisher Scientific.
2.2. Particle dispersion and characterization
E171 was obtained from a French supplier of food coloring for bakeries. A12 was synthesized
in our laboratories [20], it has already been used in our previous studies [4, 21, 22]. NM105
was provided by the nanomaterial library at the European Joint Research Center (JRC, Ispra,
Italy). These particles were fully characterized, as reported in our previous article [4]. Briefly,
mean primary diameter of E171, A12 and NM105 were 118±53 nm, 12±3 nm and 24±6 nm,
respectively. Their SSA was 9.4, 82 and 46 m²/g, respectively. Particles were then weighted
in 15 ml polypropylene vials, and suspended in ultrapure sterile water at a concentration of 10
mg/mL. We chose to disperse particles by sonication in water rather than in cell culture
medium, because sonication of proteins from fetal bovine serum (FBS) would cause their
agglomeration [23], creating large aggregates that would hinder particle detection by dynamic
light scattering (DLS). Moreover protein aggregates may alter cellular endocytosis and/or
particle coating. Particles were sonicated for 30 min at 80% of amplitude, 4 °C (Huber
minichiller), using high energy sonication (Bioblock Scientific, Vibracell 75041) with an
indirect cup-type sonicator (Cup Horn), immediately before cell exposure. The power of this
sonicator was measured using the calorimetric procedure [24]; 80% of amplitude corresponds
to 47.7 W. In this condition, hydrodynamic diameter and polydispersity index (PdI) of E171,
A12 and NM105 were 415±69 (PdI: 0.48±0.07), 85±3 (PdI: 0.17±0.02) and 158±1 (PdI:
7 containing FBS, as proteins from FBS would create a protein corona which would prevent
particle agglomeration. After dilution in cell culture medium, hydrodynamic diameter and PdI
of E171, A12 and NM105 was 739±355 nm (PdI: 0.64±0.22), 448±1 nm (PdI: 0.25±0.02) and
440±7 nm (PdI: 0.18±0.01), respectively [4]. Zeta potential was 19±1 mV, 11±1 mV and
-11±1 mV, respectively [4].
2.3. Cell culture and exposure to TiO2 particles
Caco-2 cells (ATCC HTB-37, passages from 49 to 60), Caco-2 cells transfected with
EGFP-encoding lentivirus, which stably express EGFP (Caco-2-GFP, developed by F. Barreau,
passages from 9 to 15) and HT29-MTX mucus-secreting cells (kindly provided by T.
Lesuffleur, INSERM U843, Paris, France, passages from 21 to 35) were maintained, in
separate flasks, in Dulbecco's Modified Eagle Medium + GlutaMAX™ supplemented with
10% heat inactivated FBS, 1% non-essential amino acids (NEAA), 50 units/ml penicillin and
50 µg/ml streptomycin. They were maintained at 37°C under 5% CO2. For the following
experiments, cells were then seeded as a co-culture composed of 70% Caco-2 and 30%
HT29-MTX cells, at a density of 24 000 cells/cm2, in 60 cm2 petri dishes or multi-well plates. Three
days post-seeding, cells were exposed to TiO2 particles diluted in cell culture medium
(containing 10% of FBS) for 6 h, 24 h or 48 h.
2.4. Characterization of Caco-2/HT29-MTX co-culture by fluorescence activated cell
sorting (FACS)
The proportion of Caco-2 and HT29-MTX in the co-culture was monitored 6 h, 48 h and 72 h
after seeding (i.e. during the three days preceding exposure to TiO2), using Caco-2-GFP cells
8 by FACS. As for other experiments, Caco-2-GFP and HT29-MTX cells were grown
separately, then harvested and seeded in 56-cm² petri dishes at a density of 24 000 cells per
cm². Immediately after seeding, 3 vials containing 1 million cells each were fixed with 4%
(w/v) paraformaldehyde for 15 min at room temperature, then washed twice with PBS. Then,
6 h, 48 h and 72 h after seeding, cells were harvested with trypsin (3 petri dishes per time
point), fixed with 4% (w/v) paraformaldehyde for 15 min at room temperature, washed twice
with PBS. Samples were stored at 4°C until analysis, on a FacsCalibur instrument (Becton
Dickinson).
2.4. Toxicity assays
2.4.1. Cell viability
After acute exposure to E171 and TiO2-NPs, cell viability was assessed via the
3-(4,5-dimethylthiazol-z-yl)-2,5-diphenyl-tetrazotium bromide (MTT) assay, which measures
metabolic activity. Cells were grown in 96-wells plates and exposed to 0-200 µg/mL of
particles for 6 h or 48 h. Then exposure medium was discarded and replaced by 100 µL of 0.5
mg/mL MTT solution. After 2 h of incubation at 37°C, the MTT solution was discarded and
formazan crystals were dissolved in 100 µL DMSO. Interferences of particles with the assay
were tested as previously described [21] (Table S1). Since optical interference of TiO2
particles was detected, after dissolution of formazan crystals, the plates were centrifuged for 5
min at 500 rpm, then 50 µL of supernatants was transferred to a clean plate, and absorbance at
550 nm was measured (SpectraMax M2, Molecular Devices). In this condition, no
interference is observed (Figure S1).
9 Intracellular ROS content was assessed using 2’,7’–dichlorodihydrofluorescein diacetate
acetyl ester (DCFH-DA) (Invitrogen). After exposure to particles, cells were rinsed twice with
PBS and incubated with 80 µM DCFH-DA (Life Technologies), prepared in complete cell
culture medium, for 30 min at 37°C. They were harvested by scraping, and DCF fluorescence
intensity was measured at exc/em 480 nm/570 nm (SpectraMax M2, Molecular Devices). After background removal (exc/em 480 nm/650 nm), DCF fluorescence was normalized to protein concentration. Potential interference of particle was tested, by measuring the
fluorescence of cells exposed to particles but not with DCFH-DA, and by measuring the
fluorescence of particles suspensions (10-50-100 µg/mL) mixed with DCFH-DA (no cells).
No interference was detected (table S2).
2.4.3. Comet assay
DNA strand breaks and alkali-labile sites were assessed through the alkaline version of the
comet assay. Fpg-sensitive sites, including 8-oxo-dGuo, were quantified by incubating the
slides with formamidopyrimidine-DNA glycosylase enzyme (Fpg). Cells were exposed to
TiO2 particles in 24-well plates. After exposure, they were collected and stored at -80°C in
citrate buffer (11.8 g/L) containing sucrose (85.5 g/L) and DMSO (50 mL/L), pH 7.6.
Approximately 10000 cells were mixed with low melting point agarose (0.6% in PBS) and
dropped on slides previously coated with standard 1% agarose (n=6). After solidification on
ice for 10 min, slides were placed in cold lysis buffer (2.5 M NaCl, 100 mM EDTA, 10 mM
Tris, 10% DMSO, 1% Triton X-100, pH10) and incubated overnight at 4°C. They were then
rinsed in 0.4 M Tris pH 7.4. For each individual biological replicate, three slides were
incubated with Fpg buffer (Invitrogen), and 3 slides were incubated with 100 μL of Fpg
10 unwind for 30 min in electrophoresis buffer (0.3 M NaOH, 1 mM EDTA), followed by
electrophoresis in a vertical comet assay tank (COMPAC50, Cleaver Scientific) at 21 V (1
V/cm) for 30 min. After neutralization in 0.4 M Tris pH 7.4, comets were stained with 50 µL
of GelRed (Life Technologies). As positive control for alkaline comet assay, cells were
exposed for 24 h to 30 µg/mL of methyl-methanesulfonate (MMS). As positive control for
comet-Fpg, we used A549 cells exposed to 1 µM riboflavin for 20 min at 37 °C, then
irradiated with 10 J/cm² of UVA. As positive control for electrophoresis, 50 µM of H2O2 was
deposited on an extra slide of control cells and incubated for 5 min on ice (not shown).
Comets were scored using image analysis Comet IV software (Perceptive Instruments,
Suffolk, UK), and median % DNA in tail was calculated for at least 50 comets per slide. Net
pgsensitive sites (Net Fpg) were calculated as the difference in % DNA in tail between
samples with Fpg incubation and samples with buffer incubation. The whole experiment was
repeated three times independently (n=3).
2.4.4. 53BP1 foci count
The number of p53-binding protein 1 (53BP1) foci per cell nuclei was evaluated by
immunostaining of cells fixed for 15 min in 4% paraformaldehyde and permeabilized for 15
min in 0.1% triton X-100, using anti-53BP1 antibody (Abnova, 1/2000, vol./vol., exposure 1
h at room temperature) and anti-rabbit secondary antibody coupled to Atto488 (1/1000,
exposure 1 h at room temperature). Cell nuclei were then stained for 15 min with Hoechst
33342 (1 µg.ml-1). As positive control, cells were exposed to 50 µM of etoposide for 24 h.
Total number of 53BP1 foci was automatically counted, as well as total number of nuclei,
using a Cell Insight CX5 (Thermofisher); data were analyzed using the SpotDetector v4
11
2.4.5. HPLC/MS-MS for 8-oxo-dGuo measurement
8-oxodGuo was quantified by HPLC-tandem mass spectrometry (HPLC-MS/MS) [25]. DNA
was extracted and digested as described by Ravanat et al. [26]. Briefly, a lysis buffer
containing Triton X-100 was added to the cellular pellet. The nuclei were collected by
centrifugation and further lyzed in a Tris-EDTA buffer to which 10% SDS was added. The
samples were incubated with a mixture of RNAse A and RNAse T1, and subsequently treated
by proteinase. DNA was precipitated using isopropanol and concentrated sodium iodide.
Deferroxamine was added to all buffers to prevent spurious oxidation. DNA was then
digested into a mixture of nucleosides, first by incubation with nuclease P1, DNAse II and
phosphodiesterase II at pH 6, for 2 h. They were then further digested in alkaline phosphatase
and phosphodiesterase I, pH 8, for 2 h. The solution was neutralized with 0.1 µM HCl and
centrifuged. The supernatant was collected and injected onto the HPLC-MS/MS system.
8-OxodGuo was quantified with an ExionLC HPLC system connected to a QTRAP 6500+
mass spectrometer (SCIEX). The spectrometer was used in the MRM3 mode with positive
electrospray ionization. The monitored fragmentation was m/z 284 [M + H]+ → 168 [M + H
-2-deoxyribose]+ 140 [M + H -2-deoxyribose-CO]+. Chromatographic separations were
achieved using a C18 reversed phase Uptisphere ODB column (Interchim, Montluçon,
France). The elution was performed using a gradient of acetonitrile in 2 mM ammonium
formate, at a flow rate of 0.2 mL/min. The retention time was 20 min. In addition to the MS
spectrometer, the HPLC eluent was analyzed in a UV detector set at 270 nm to quantify the
amount of unmodified nucleosides. Levels of 8-oxodGuo were expressed as number of lesions
12
2.4.6. Gene expression
Gene expression was measured by real-time-quantitative polymerase chain reaction
(RT-qPCR). RNA was extracted using GenEluteTM mammalian total RNA Miniprep assay. Cells
were harvested in lysis buffer from the Miniprep assay and stored at -80°C. The integrity of
RNA was checked by measurement of absorbance at 260, 280 and 230 using a Nanodrop
ND-1000 (Thermofisher), and calculation of abs 260/abs 280 and abs 260/abs 230 nm ratios. 2 µg
of total RNA was reverse transcribed to cDNA with 100 ng/µL random primers, 10 mM
dNTP and the SuperScript III Reverse Transcriptase (Invitrogen). Quantitative PCR was run
with MESA Blue qPCR Mastermix for SYBR Assay with ROX reference (Eurogentec) in a
CFX96 Real time system, C1000 Touch Thermal cycler (Bio-Rad). Primer sequences are
reported in Table S3. S18 and GAPDH were used as reference genes for normalization.
Variability of their expression was assessed using Bestkeeper, an Excel-based pairwise
mRNA correlation tool [27]. Relative gene expression was calculated using the Relative
Expression Software Tool (REST2009) [28].
2.5. Statistical analysis
Except for RT-qPCR experiments, statistical analyses were performed using Statistica 8.0
software (Statsoft, Chicago, USA). Unless indicated otherwise, statistical significance was
assessed based on a non-parametric one-way analysis of variance on ranks approach
(Kruskal-Wallis) followed by pairwise comparison using a Mann-Whitney u-test. Results were
13
3. Results
3.1. Characterization of the Caco-2/HT29-MTX co-culture
Caco-2-GFP and HT29-MTX were seeded at the initial ratio of 70:30. After 6 h in culture,
which is the time necessary for cells to adhere to the flask, and after 48 h, the proportion was
still approximately 70:30 (Figure 1). This proportion changed 72 h after seeding, and reached
77:23 (Figure 1). Consequently, when cells were exposed to TiO2 particles, the co-culture was
composed of 77% Caco-2 and 23% HT29-MTX, which is comparable to the proportion of
enterocytes and goblet cells in human colon [29].
3.1. Cytotoxicity
Cells were exposed to E171 or NM105 for 6 h or 48 h. Cell viability was not altered by
exposure to E171 or NM105, up to 200 µg/mL (Figure 2). Optical interference of TiO2
particles with MTT assay was detected, the protocol was therefore adapted to eliminate TiO2
particles before absorbance measurement.
3.2. Oxidative stress
Whatever the exposure condition, ROS levels were significantly higher in cells exposed to
TiO2 particles, as compared to control cells (Figure 3). This increase in ROS level was not
dependent on exposure time, nor on the type of TiO2 particle (Figure 3A). In cells exposed to
E171, increased ROS level was dependent on E171 concentration, with significantly higher
ROS levels in cells exposed to 50 or 100 µg/mL of E171, compared to cells exposed to 10
µg/mL of E171, whatever the exposure time (Figure 3B). Possible interaction of TiO2
14 Then, the expression of genes encoding proteins involved in antioxidant defense mechanisms,
namely catalase (CAT), glutathione reductase (GSR), superoxide dismutase 1 and 2 (SOD1,
SOD2), was measured by RT-qPCR in cells exposed to TiO2 particles for 6 h or 48 h. Only
very moderate modulation of the mRNA expression was observed, with downregulated
mRNA expression of SOD1 and SOD2 in cells exposed for 48 h to E171 or A12, respectively
(Table 1). Moreover, there was no significant modulation in mRNA expression level of
NRF2, a transcription factor implicated in oxidative stress regulation.
3.3. DNA damage
Since intracellular accumulation of ROS could trigger oxidative damage to DNA, DNA
integrity was assessed in exposed cells via comet assay (alkaline and Fpg-modified), which
probes DNA strand breaks and alkali-labile sites such as abasic sites, as well as Fpg-sensitive
sites such as oxo-dGuo; 53BP1 foci count, which probe DNA double strand breaks; then
8-oxo-dGuo was measured by HPLC/MS-MS, as probe of DNA base oxidation. No DNA strand
break and/or alkali-labile site was detected in cells exposed to TiO2 particles via the alkaline
version of comet assay, whatever the exposure condition (Figure 4, “SBs+ALB”). No
Fpg-sensitive site (and among them 8-oxo-dGuo) was detected in the Fpg-modified version of
comet assay (Figure 4, “Net Fpg”). No significant increase in DNA double strand break was
detected via 53BP1 foci immunostaining in exposed cells, compared to control cells (Figure
5). Moreover, no significant increase of the 8-oxo-dGuo level was detected by HPLC/MS-MS
(Figure 6). We even observed decreased level of 8-oxo-dGuo in cells exposed to P25 or E171
for 6 h. Conversely, positive outcome was observed for positive controls in these assays, i.e.
cells exposed to 30 µg/mL of methyl methanesulfoxide for 24 h in the alkaline version of
15 of comet assay, cells exposed to 50 µM of etoposide in the 53BP1 assay, and cells exposed to
KBrO3 in the 8-oxo-dGuo quantification assay.
The mRNA expression of DNA repair proteins, involved in the base excision repair pathway,
was monitored via RT-qPCR. No significant gene expression change was detected, except
increased expression of GADD45 in cells exposed for 48 h to P25 (Table 1).
3.4. Endoplasmic reticulum stress
The mRNA expression of IRE-1, ATF6, sXBP1, and GRP78, which mediate the UPR
response, was then analyzed in cells exposed to TiO2 particles. Again, no significant
modulation of mRNA expression was observed (Table 1).
4. Discussion
The objective of the present study was to assess the cytotoxicity, DNA damage, oxidative
stress and endoplasmic reticulum stress caused by E171 and TiO2 nanoparticles on a
co-culture of Caco-2 and HT29-MTX cells, seeded at 70% and 30%, respectively. In all
experiments, Caco-2 cells were not differentiated, they were thus proliferative; conversely
HT29-MTX already produced some mucus. This cell model was exposed to up to 200 µg/mL
of TiO2, which is a high concentration as compared to the estimated human daily intake [5,
30-32]. TiO2 particles were prepared in complete cell culture medium, i.e. in the presence of
FBS proteins. This particular combination of parameters was chosen to take into account
physiological parameters. First, it should be kept in mind that in normal intestinal villi,
epithelial cells undergo a differentiation gradient from the bottom of crypts to the top of villi,
16 with this physiology. Second, even when ingested without an associated meal, TiO2 food
additive is covered with salivary proteins and gastric enzymes before it enters the intestine.
Therefore, the use of FBS proteins in exposure medium, which leads to the formation of a
dense protein corona on the surface of NPs, is relevant. Thus, our setup appears to be a
valuable addition to the battery of in vitro systems used for the estimation of gastrointestinal
effects of micro- and nanoparticles.
Our results are in accordance with the published literature which shows that the overall
toxicity of TiO2 is low, even at high concentration [33-35]. They concur with our previous
study, where pure anatase and pure rutile TiO2-NPs were proven to induce only minor impact
on undifferentiated Caco-2 cells [22]. They induced no cytotoxicity, no DNA strand breaks or
alkali-labile sites, but they caused accumulation of ROS, modulation of GSH level and
decreased activity of superoxide dismutase in exposed cells [22]. Our observations also
concur with the study published by Song et al. [14] which showed, on undifferentiated Caco-2
cell, that pure anatase TiO2 particles, either nanoparticles or food-grade particles, induce
limited membrane damage and no change in cell proliferation [14], but a dose-dependent
increase of ROS level [14].
Proquin et al. previously reported that TiO2 nanoparticles and E171 induced genotoxic
damage to Caco-2 and HCT116 cells, in the alkaline version of comet assay and in the
micronucleus assay, respectively [12]. Different hypotheses can explain the discrepant result
observed in the present study. First, TiO2 preparation procedure is different: Proquin et al.
dispersed TiO2 particles in DMEM medium containing 0.05% of bovine serum albumin
(BSA), then this suspension of particles was sonicated. Particles were then diluted in culture
medium containing FBS. Sonication of proteins is known to cause their denaturation and
aggregation [23]. For this reason, we chose to rather disperse TiO2 particles by sonication in
17 proteins from serum would hinder particle agglomeration via steric repulsion. Moreover
Proquin et al. used bath sonication while we used high energy sonication. Consequently, the
dispersion state of particles differs, in these two studies: while we obtained stable suspensions
with average hydrodynamic diameter 450 nm for NPs and 750 nm for E171, Proquin et al.
obtained suspensions containing large agglomerates (>1000 nm). Different hydrodynamic
diameters may induce different exposure levels, with large agglomerates settling down very
rapidly on cells and therefore increasing exposure. This would explain the positive outcomes
observed by Proquin et al. in genotoxicity testing, while we observed no genotoxicity in our
exposure conditions. Another difference is the cell model used here, compared to the study by
Proquin et al. We used a co-culture of Caco-2 and HT29-MTX cells while Proquin et al. used
Caco-2 cells. HT29-MTX secrete some mucus, which can cover the cells and therefore protect
them from NPs. In a previous study, we showed that accumulation of TiO2-NPs and E171 is
similar in a monoculture of Caco-2 cells and in a co-culture of Caco-2 and HT29-MTX cells,
exposed 21 days post-seeding, i.e. when cells are fully-differentiated. But the situation may be
different in non-differentiated cells, i.e. non-differentiated Caco-2/HT29-MTX co-culture may
accumulate more TiO2 particles than non-differentiated Caco-2 monoculture, which would
also explain the discordant results observed here.
Positive outcome in cytotoxicity (LDH and WST-1) and genotoxicity (Fpg-modified version
of comet assay) testing was also observed by Gerloff et al., in non-differentiated Caco-2 cells,
exposed to mixed anatase/rutile TiO2-NPs [36, 37]. In the two studies by Gerloff et al.,
exposure medium was serum-free whereas in our exposure conditions it contained FBS.
According to the literature, the different protein coronas that form on NPs determine particle
biological signature, which influences their accumulation and impact on cells [38-40]. A
dense protein corona, which forms when particles are diluted in medium containing FBS, has
18 Gerloff et al. observed cyto- and genotoxicity while we do not. Again, this discussion
underlines the necessity to use similar dispersion procedures and exposure conditions for in
vitro assessment of nano- and microparticle toxicity so that a consensus is obtained.
The absence of genotoxicity observed in vitro may be put into perspective with the recently
published in vivo data, showing carcinogenic potential of E171 and TiO2-NPs [10]. In this in
vivo study, the authors showed the potential of E171 and TiO2-NPs to initiate preneoplastic
lesions and to induce the growth of aberrant crypt foci [10]. These observations were
concomitant with absence of in vivo genotoxicity in the colon mucosa, but coincided with
promotion of colon micro-inflammation [10]. TiO2 particles may therefore be classified in the
group of promoters of carcinogens that induce cancer via non-genotoxic mechanisms [41].
Since both micro-inflammation and immune homeostasis disruption were observed in this in
vivo study, the mechanisms of this non-genotoxic carcinogenicity may occur either via immunosuppression or via the promotion of a dysregulated inflammatory response [41]. This
is consistent with the hypothesis of Vales et al., who showed in BEAS-2B bronchial epithelial
cells, that chronic exposure to low doses of TiO2-NPs causes cell transformation and
acquisition of a cancer phenotype, without causing any primary genotoxicity or chromosomal
damage [42]. We used a co-culture of epithelial intestinal cells, with no immune cells which
are the main actors of the inflammatory response, and which may lead to secondary
genotoxicity. Therefore, our model is not the best one when investigating secondary
genotoxicity caused by NPs. An in vitro 3D model combining epithelial cells and immune
cells has been developed recently [43], it would be a better model to assess inflammation and
secondary genotoxicity.
Acute exposure to TiO2 particles causes accumulation of ROS but no oxidative damage to
DNA and unchanged mRNA levels of redox enzymes and of NRF-2. This suggests that cells
19 as glutathione. Therefore TiO2 particles, either nanoparticles or E171 food additive cause only
minor toxicological impact on this in vitro intestinal model.
5. Conclusion
TiO2 toxicity was evaluated in vitro, on a model mucus-secreting intestinal epithelium in
which enterocytes are not fully differentiated and still proliferative. Both TiO2 nanoparticles
and E171 food additive increased intracellular ROS level, in a dose-dependent manner for
E171. They did not induce any loss of cell viability, or impairment of DNA integrity, or
endoplasmic reticulum stress. At current exposure conditions, this shows that E171 food
additive and TiO2 nanoparticles only produce minor effects to this in vitro intestinal cell
model.
6. Acknowledgments
This work was supported by Atomic Energy and Alternative Energies Commission (CEA)
through the ‘Toxicology’ research program (IMAGINATOX grant); the French Environment
and Energy Management Agency (ADEME); the French Agency for Food, Environmental
and Occupational Health & Safety (ANSES) within the framework of the National Research
Program for Environmental and Occupational Health (PNR-EST, EST-2013/1/024, NanoGut
grant) and the French National Research Agency (ANR, ANR-16-CE34-0011-01, PAIPITO
grant). It is a contribution to the Labex Serenade (ANR-11-LABX-0064) funded by the French Government’s “Investissements d’Avenir” ANR program, through the A*MIDEX
project (ANR-11-IDEX-0001-02). It has been performed in the frame of the hCOMET COST
action (CA15132). The authors would like to thank T. Lesuffleur (INSERM U938, Paris,
20
7. References
[1] B. Jovanovic, Critical review of public health regulations of titanium dioxide, a human
food additive, Integrated environmental assessment and management, 11 (2015) 10-20.
[2] R.J. Peters, G. van Bemmel, Z. Herrera-Rivera, H.P. Helsper, H.J. Marvin, S. Weigel, P.C.
Tromp, A.G. Oomen, A.G. Rietveld, H. Bouwmeester, Characterization of titanium dioxide
nanoparticles in food products: analytical methods to define nanoparticles, Journal of
agricultural and food chemistry, 62 (2014) 6285-6293.
[3] R.J.B. Peters, H. Bouwmeester, S. Gottardo, V. Amenta, M. Arena, P. Brandhoff, H.J.P.
Marvin, A. Mech, F.B. Moniz, L.Q. Pesudo, H. Rauscher, R. Schoonjans, A.K. Undas, M.V.
Vettori, S. Weigel, K. Aschberger, Nanomaterials for products and application in agriculture,
feed and food, Trends in Food Science & Technology, 54 (2016) 155-164.
[4] M. Dorier, D. Beal, C. Marie-Desvergne, M. Dubosson, F. Barreau, Continuous in vitro
exposure of intestinal epithelial cells to E171 food additive causes oxidative stress, inducing
oxidation of DNA bases but no endoplasmic reticulum stress, Nanotoxicology, 11 (2017)
751-761.
[5] A. Weir, P. Westerhoff, L. Fabricius, K. Hristovski, N. von Goetz, Titanium dioxide
nanoparticles in food and personal care products, Environmental science & technology, 46
(2012) 2242-2250.
[6] Y. Yang, K. Doudrick, X. Bi, K. Hristovski, P. Herckes, P. Westerhoff, R. Kaegi,
Characterization of food-grade titanium dioxide: the presence of nanosized particles,
Environmental science & technology, 48 (2014) 6391-6400.
[7] L.C. Pele, V. Thoree, S.F. Bruggraber, D. Koller, R.P. Thompson, M.C. Lomer, J.J.
Powell, Pharmaceutical/food grade titanium dioxide particles are absorbed into the
21 [8] I.M. Urrutia-Ortega, L.G. Garduno-Balderas, N.L. Delgado-Buenrostro, V.
Freyre-Fonseca, J.O. Flores-Flores, A. Gonzalez-Robles, J. Pedraza-Chaverri, R. Hernandez-Pando,
M. Rodriguez-Sosa, S. Leon-Cabrera, L.I. Terrazas, H. van Loveren, Y.I. Chirino, Food-grade
titanium dioxide exposure exacerbates tumor formation in colitis associated cancer model,
Food and Chemical Toxicology, 93 (2016) 20-31.
[9] H. Proquin, M.J. Jetten, M.C.M. Jonkhout, L.G. Garduno-Balderas, J.J. Briede, T.M. de
Kok, Y.I. Chirino, H. van Loveren, Gene expression profiling in colon of mice exposed to
food additive titanium dioxide (E171), Food and chemical toxicology, 111 (2018) 153-165.
[10] S. Bettini, E. Boutet-Robinet, C. Cartier, C. Comera, E. Gaultier, J. Dupuy, N. Naud, S.
Tache, P. Grysan, S. Reguer, N. Thieriet, M. Refregiers, D. Thiaudiere, J.P. Cravedi, M.
Carriere, J.N. Audinot, F.H. Pierre, L. Guzylack-Piriou, E. Houdeau, Food-grade TiO2
impairs intestinal and systemic immune homeostasis, initiates preneoplastic lesions and
promotes aberrant crypt development in the rat colon, Scientific reports, 7 (2017) 40373.
[11] M. Carriere, S. Sauvaigo, T. Douki, J.L. Ravanat, Impact of nanoparticles on DNA repair
processes: current knowledge and working hypotheses, Mutagenesis, 32 (2017) 203-213.
[12] H. Proquin, C. Rodriguez-Ibarra, C.G. Moonen, I.M. Urrutia Ortega, J.J. Briede, T.M. de
Kok, H. van Loveren, Y.I. Chirino, Titanium dioxide food additive (E171) induces ROS
formation and genotoxicity: contribution of micro and nano-sized fractions, Mutagenesis, 32
(2017) 139-149.
[13] K. Gerloff, D.I. Pereira, N. Faria, A.W. Boots, J. Kolling, I. Forster, C. Albrecht, J.J.
Powell, R.P. Schins, Influence of simulated gastrointestinal conditions on particle-induced
cytotoxicity and interleukin-8 regulation in differentiated and undifferentiated Caco-2 cells,
22 [14] Z.M. Song, N. Chen, J.H. Liu, H. Tang, X. Deng, W.S. Xi, K. Han, A. Cao, Y. Liu, H.
Wang, Biological effect of food additive titanium dioxide nanoparticles on intestine: an in
vitro study, Journal of applied toxicology, 35 (2015) 1169-1178.
[15] M.A. McGuckin, R.D. Eri, I. Das, R. Lourie, T.H. Florin, ER stress and the unfolded
protein response in intestinal inflammation, American Journal of Physiology-Gastrointestinal
and Liver Physiology, 298 (2010) G820-G832.
[16] V. Christen, M. Camenzind, K. Fent, Silica nanoparticles induce endoplasmic reticulum
stress response, oxidative stress and activate the mitogen-activated protein kinase (MAPK)
signaling pathway, Toxicology Reports, 1 (2014) 1143–1151.
[17] K.N. Yu, S.H. Chang, S.J. Park, J. Lim, J. Lee, T.J. Yoon, J.S. Kim, M.H. Cho, Titanium
Dioxide Nanoparticles Induce Endoplasmic Reticulum Stress-Mediated Autophagic Cell
Death via Mitochondria-Associated Endoplasmic Reticulum Membrane Disruption in Normal
Lung Cells, PloS one, 10 (2015) e0131208.
[18] R. Zhang, M.J. Piao, K.C. Kim, A.D. Kim, J.Y. Choi, J. Choi, J.W. Hyun, Endoplasmic
reticulum stress signaling is involved in silver nanoparticles-induced apoptosis, The
international journal of biochemistry & cell biology, 44 (2012) 224-232.
[19] J.D. Malhotra, R.J. Kaufman, Endoplasmic reticulum stress and oxidative stress: a
vicious cycle or a double-edged sword?, Antioxidants & redox signaling, 9 (2007) 2277-2293.
[20] B. Pignon, H. Maskrot, V.G. Ferreol, Y. Leconte, S. Coste, M. Gervais, T. Pouget, C.
Reynaud, J.F. Tranchant, N. Herlin-Boime, Versatility of laser pyrolysis applied to the
synthesis of TiO2 nanoparticles - Application to UV attenuation, European Journal of
Inorganic Chemistry, (2008) 883-889.
[21] E. Brun, F. Barreau, G. Veronesi, B. Fayard, S. Sorieul, C. Chaneac, C. Carapito, T.
23 impact and translocation through ex vivo, in vivo and in vitro gut epithelia, Particle and fibre
toxicology, 11 (2014) 13.
[22] M. Dorier, E. Brun, G. Veronesi, F. Barreau, K. Pernet-Gallay, C. Desvergne, T.
Rabilloud, C. Carapito, N. Herlin-Boime, M. Carriere, Impact of anatase and rutile titanium
dioxide nanoparticles on uptake carriers and efflux pumps in Caco-2 gut epithelial cells,
Nanoscale, 7 (2015) 7352-7360.
[23] P.B. Stathopulos, G.A. Scholz, Y.M. Hwang, J.A. Rumfeldt, J.R. Lepock, E.M.
Meiering, Sonication of proteins causes formation of aggregates that resemble amyloid,
Protein science, 13 (2004) 3017-3027.
[24] J.S. Taurozzi, V.A. Hackley, M.R. Wiesner, Ultrasonic dispersion of nanoparticles for
environmental, health and safety assessment--issues and recommendations, Nanotoxicology, 5
(2011) 711-729.
[25] S. Frelon, T. Douki, J.L. Ravanat, J.P. Pouget, C. Tornabene, J. Cadet, High-performance
liquid chromatography--tandem mass spectrometry measurement of radiation-induced base
damage to isolated and cellular DNA, Chemical research in toxicology, 13 (2000) 1002-1010.
[26] J.L. Ravanat, T. Douki, P. Duez, E. Gremaud, K. Herbert, T. Hofer, L. Lasserre, C.
Saint-Pierre, A. Favier, J. Cadet, Cellular background level of
8-oxo-7,8-dihydro-2'-deoxyguanosine: an isotope based method to evaluate artefactual oxidation of DNA during its
extraction and subsequent work-up, Carcinogenesis, 23 (2002) 1911-1918.
[27] M.W. Pfaffl, A. Tichopad, C. Prgomet, T.P. Neuvians, Determination of stable
housekeeping genes, differentially regulated target genes and sample integrity:
BestKeeper--Excel-based tool using pair-wise correlations, Biotechnology letters, 26 (2004) 509-515.
[28] M.W. Pfaffl, G.W. Horgan, L. Dempfle, Relative expression software tool (REST) for
group-wise comparison and statistical analysis of relative expression results in real-time PCR,
24 [29] J. Forstner, G.G. Forstner, Gastrointestinal mucus. , in: J. LR (Ed.) Physiology of the
gastrointestinal tract. 3rd edn, Raven Press, New York, 1994, pp. 1255–1283.
[30] X.X. Chen, B. Cheng, Y.X. Yang, A. Cao, J.H. Liu, L.J. Du, Y. Liu, Y. Zhao, H. Wang,
Characterization and preliminary toxicity assay of nano-titanium dioxide additive in
sugar-coated chewing gum, Small, 9 (2013) 1765-1774.
[31] E. Frohlich, E. Roblegg, Models for oral uptake of nanoparticles in consumer products,
Toxicology, 291 (2012) 10-17.
[32] J.J. Powell, N. Faria, E. Thomas-McKay, L.C. Pele, Origin and fate of dietary
nanoparticles and microparticles in the gastrointestinal tract, Journal of autoimmunity, 34
(2010) J226-233.
[33] C. McCracken, P.K. Dutta, W.J. Waldman, Critical assessment of toxicological effects of
ingested nanoparticles, Environmental Science-Nano, 3 (2016) 256-282.
[34] H. Shi, R. Magaye, V. Castranova, J. Zhao, Titanium dioxide nanoparticles: a review of
current toxicological data, Particle and fibre toxicology, 10 (2013) 15.
[35] M. Skocaj, M. Filipic, J. Petkovic, S. Novak, Titanium dioxide in our everyday life; is it
safe?, Radiology and oncology, 45 (2011) 227-247.
[36] K. Gerloff, C. Albrecht, A.W. Boots, I. Förster, R.P.F. Schins, Cytotoxicity and oxidative
DNA damage by nanoparticles in human intestinal Caco-2 cells Nanotoxicology 3(2009)
355–364.
[37] K. Gerloff, I. Fenoglio, E. Carella, J. Kolling, C. Albrecht, A.W. Boots, I. Forster, R.P.
Schins, Distinctive toxicity of TiO2 rutile/anatase mixed phase nanoparticles on Caco-2 cells,
Chemical research in toxicology, 25 (2012) 646-655.
[38] A. Lesniak, F. Fenaroli, M.P. Monopoli, C. Aberg, K.A. Dawson, A. Salvati, Effects of
the presence or absence of a protein corona on silica nanoparticle uptake and impact on cells,
25 [39] M.P. Monopoli, C. Aberg, A. Salvati, K.A. Dawson, Biomolecular coronas provide the
biological identity of nanosized materials, Nature nanotechnology, 7 (2012) 779-786.
[40] N.P. Mortensen, G.B. Hurst, W. Wang, C.M. Foster, P.D. Nallathamby, S.T. Retterer,
Dynamic development of the protein corona on silica nanoparticles: composition and role in
toxicity, Nanoscale, 5 (2013) 6372-6380.
[41] L.G. Hernandez, H. van Steeg, M. Luijten, J. van Benthem, Mechanisms of
non-genotoxic carcinogens and importance of a weight of evidence approach, Mutation research,
682 (2009) 94-109.
[42] G. Vales, L. Rubio, R. Marcos, Long-term exposures to low doses of titanium dioxide
nanoparticles induce cell transformation, but not genotoxic damage in BEAS-2B cells,
Nanotoxicology, 9 (2015) 568-578.
[43] J. Susewind, C.D. Carvalho-Wodarz, U. Repnik, E.M. Collnot, N. Schneider-Daum,
G.W. Griffiths, C.M. Lehr, A 3D co-culture of three human cell lines to model the inflamed
26 Table 1. RT-qPCR analysis of the mRNA expression of DNA repair proteins, redox enzymes
and proteins implicated in endoplasmic reticulum stressa
A12 6h NM105 6h E171 6h A12 48h NM105 48h E171 48h
DNA repair OGG1 0.90±0.14 0.77±0.16 1.06±0.18 0.94±0.71 1.63±1.11 1.81±1.43 APE1 1.44±0.49 1.00±0.38 0.89±0.30 0.99±0.25 1.08±1.17 0.87±0.31 PARP1 1.13±0.30 0.92±0.24 0.87±0.20 1.19±0.44 1.13±0.47 1.15±0.53 LIG3 1.07±0.29 0.88±0.21 0.70±0.50 1.05±0.37 1.03±0.40 1.30±0.48 XRCC1 1.19±0.36 0.93±0.32 2.52±2.53 1.57±1.02 1.54±0.96 1.89±1.30 PCNA 1.40±0.35 0.88±0.20 1.17±0.27 1.06±0.36 1.06±0.36 1.26±0.76 GADD45 1.27±0.44 0.71±0.24 0.74±0.27 1.66±0.62 1.86±0.70* 1.83±1.05 oxidative balance SOD1 1.20±0.32 1.63±0.63 1.22±0.63 0.66±0.34 0.92±0.44 0.49±0.15* SOD2 1.92±1.49 2.04±1.76 1.40±1.24 0.68±0.17* 1.04±0.47 1.00±0.53 CAT 0.99±0.29 1.44±0.53 0.85±0.41 1.14±0.57 0.96±0.49 0.96±0.42 GSR 0.75±0.34 1.08±0.43 0.81±0.40 1.15±0.69 0.70±0.35 1.11±0.34 NRF2 1.04±0.27 1.21±0.45 1.01±0.65 0.97±0.49 0.86±0.70 1.07±0.57
endoplasmic reticulum stress
IRE1 0.78±0.19 1.03±0.26 0.92±0.54 0.93±0.67 1.24±1.20 1.57±1.50 SXBP1 0.95±0.35 1.04±0.40 1.43±0.61 1.14±1.31 1.19±0.84 1.61±1.47 GRP78 0.88±0.20 0.94±0.19 1.09±0.41 1.24±1.21 1.15±0.63 1.51±0.93 ATF6 1.09±0.23 0.93±0.31 1.27±0.87 0.91±0.98 1.08±0.68 1.06±0.85
a
Impact on gene expression of selected genes, obtained by RT-qPCR from
Caco-2/HT29-MTX cells exposed for 6 h or 48 h to 50 µg/mL of TiO2 particles. Results are expressed as
fold-increase above the control (unexposed cells) and expressed as average ± standard
27 Figure 1. Proportion of Caco-2 and HT29-MTX cells in the co-culture. FACS analysis of
Caco-2-GFP/HT29-MTX co-culture immediately after seeding (A), or 6 h (B), or 48 h (C) or
72 h (D) after seeding. Proportion of green fluorescent cells to non-fluorescent cells (E),
reflecting the proportions of Caco-2-GFP and HT29-MTX cells. Results are expressed as
percentage (%) of each cell type (Caco-2-GFP: white and HT29-MTX: grey), presented as
28 Figure 2. Impact of TiO2 particles on cell viability. Cell metabolic activity, reflecting
viability, was probed with the MTT assay in Caco-2/HT29-MTX cells after 6h and 48h of
exposure to NM105 (A) and E171 food additive (B) at 20, 50, 100 and 200 µg/mL. Results
are expressed as percentage (%) of the value obtained in control cells (unexposed cells),
29 Figure 3. Intracellular ROS content. ROS content was measured using DCFH-DA assay, in
Caco-2/HT29-MTX co-culture exposed for 6 h, 24 h or 48 h to 50 µg/mL of A12 or NM105,
or E171 (A), or to 10, 50 and 100 µg/mL of E171 (B). As positive control, cells were exposed
for 24 h to 250 µM of KBrO3. ROS level is expressed as fold-change compared to ROS level
in control cells. Average ± standard deviation. *p < 0.05, exposed vs. control, #p<0.05, 50 or
30 Figure 4. DNA damage caused by TiO2 particles, assessed using alkaline and Fpg-modified
comet assay. Cells were exposed to 50 µg/mL A12 or NM105 or E171 for 24 h, then DNA
damage was investigated via comet assay. % tail DNA was measured; the alkaline version of
this assay probes strand breaks and alkali-labile sites (SBs+ALB) the Fpg-modified version of
this assay probes strand breaks, alkali-labile sites and Fpg-sensitive sites (SBs+ALB+Fpg),
the level of Fpg-sensitives sites is calculated by subtracting % tail DNA obtained in the
alkaline version of the assay from % tail DNA obtained in the Fpg-modified version (Net
Fpg). Ribo/UVA: positive control for comet-Fpg assay, cells treated with riboflavin then
exposed to UVA. MMS: positive control for alkaline comet assay, cells treated with 30
31 Figure 5. Double strand break level was measured via 53BP1 immunostaining and foci count,
using high content analysis. Double strand breaks in DNA were assessed via immunostaining
and counting of 53BP1 foci, in control cells (A), cells exposed to 50 µM of etoposide (B), or
50 µg/mL A12 (C) or NM105 (D) or E171 (E) for 24 h. Blue fluorescence corresponds to
staining of nuclei, and green fluorescence corresponds to staining of 53BP1. Numbers of foci
are summarized in graph (F). Results are expressed as average ± standard deviation. *p <
32 Figure 6. 8-oxo-dGuo level, measured via HPLC-MS/MS. Cells were exposed to 50 µg/mL
A12 or NM105 or E171 for 6 h, 24 h or 48 h. As positive control, cells were exposed for 24 h
to 250 µM of KBrO3. Results are expressed as average ± standard deviation. *p < 0.05,
33
9. Supplementary materials
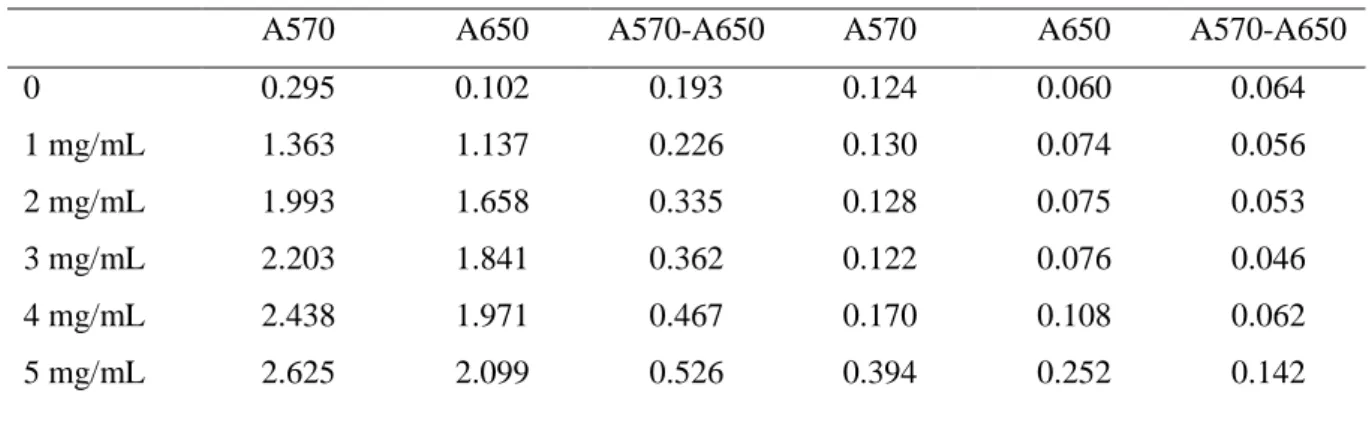
Table S1. Interference of E171 with MTT assaya
No centrifugation After centrifugation
A570 A650 A570-A650 A570 A650 A570-A650
0 0.295 0.102 0.193 0.124 0.060 0.064 1 mg/mL 1.363 1.137 0.226 0.130 0.074 0.056 2 mg/mL 1.993 1.658 0.335 0.128 0.075 0.053 3 mg/mL 2.203 1.841 0.362 0.122 0.076 0.046 4 mg/mL 2.438 1.971 0.467 0.170 0.108 0.062 5 mg/mL 2.625 2.099 0.526 0.394 0.252 0.142 a
Interference with MTT assay was assessed as follows: control Caco2/HT29-MTX cells (not exposed to E171 or TiO2-NPs) were incubated with MTT for 1 h at 37°C. The exposure medium was then
replaced by 100 µL of DMSO and agitated for 5 min in order to lyse the cells and release formazan. After agitation, this solution was mixed with 0, 1, 2, 3, 4, or 5 mg/mL of E171. Absorbance was measured at 570 nm (A570) and corrected via subtraction of background absorbance at 650 nm (A650). These values are indicated in the columns “No centrifugation”. The plate was then centrifuged for 5 min at 200 rcf, and 50 µL of each well was transferred to a clean well. Again, absorbance was measured at 570 nm (A570) and corrected via subtraction of background absorbance at 650 nm (A650). These values are indicated in the columns “After centrifugation”. In the non-centrifuged wells, A570-A650 gradually increases with increasing concentrations of E171. Conversely, when centrifugation was applied, A570-A650 did not increase. We therefore conclude that using an additional step of centrifugation at the end of the classical MTT protocol, is sufficient to avoid interference of E171. This conclusion is valid for concentrations of E171 from 1 to 3 mg/mL.
34 Table S2. Interference of TiO2 with DCFH-DA
a
Caco-2/HT29-MTX No cell
No DCFH-DA DCFH-DA DCFH-DA
Control 17.2±0.3 11643.2±937.7 2.6±0.1 A12 50 µg/mL 14.6±0.3 11992.4±1213.5 3.3±0.0 P25 50 µg/mL 14.6±0.9 16646.6±607.0 3.4±0.2 E171 10 µg/mL 17.1±1.3 14673.4±1454.1 2.7±0.2 E171 50 µg/mL 16.5±0.5 14940.1±1697.9 3.2±0.3 E171 100 µg/L 14.1±2.3 18843.0±2751.2 4.1±0.1 a
Potential interference of TiO2 particles with the DCFH-DA assay was tested by measurement of DCF
fluorescence, either in cells exposed to particles but not to DCFH-DA (“Caco-2/HT29-MTX; No DCFH-DA”), or in cells exposed to particles and to DCFH-DA, using the same protocol as in Figure 2 (“Caco-2/HT29-MTX; DCFH-DA”). Fluorescence was also measured on particle suspensions to which DCFH-DA was added (“No cell; DCFH-DA”).Fluorescence was measured with excitation at 480 nm and emission at 530 nm, cutoff 515 nm.
35 Table S3. Sequences of qPCR primers
Forward primer Reverse primer
Oxidative stress
CAT 5’-AGC-TTA-GCG-TTC-ATC-CGT-GT-3’ 5’-TCC-AAT-CATC-CGT-CAA-AAC-A-3’ GSR 5’-GAT-CCC-AAG-CCC-ACA-ATA-GA-3’ 5’-CTT-AGA-ACC-CAG-GGC-TGA-CA-3’ SOD1 5’-AGG-GCA-TCA-TCA-ATT-TCG-AG-3’ 5’-ACA-TTG-CCC-AAG-TCT-CCA-AC-3’ SOD2 5’-TCC-ACT-GCA-AGG-AAC-AAC-AG-3’ 5’-TCT-TGC-TGG-GAT-CAT-TAG-GG-3’ NRF2 5’-CAG-TCA-GCG-ACG-GAA-AGA-GT-3’ 5’-ACC-TGG-GAG-TAG-TTG-GCA-GA-3’
Endoplasmic reticulum stress
GRP78 5’-GGT-GAA-AGA-CCC-CTG-ACA-AA-3’ 5’-GTC-AGG-CGA-TTC-TGG-TCA-TT-3’ CHOP 5’-TGG-AAG-CCT-GGT-ATG-AGG-AC-3’ 5’-TGT-GAC-CTC-TGC-TGG-TTC-TG-3’ IRE1 5’-AGA-GAG-GCG-GGA-GAG-CCG-TG-3’ 5’-CGA-GGA-GGT-GGG-GGA-AGC-GA-3’ sXBP1 5’-GCA-GGT-GCA-GGC-CCA-GTT-GT-3’ 5’-TGG-GTC-CAA-GTT-GTC-CAG-AAT-GC-3’
36 Figure S1. Interference of TiO2 particles with the MTT assay. TiO2 may interfere with the MTT assay
due to their opacity, which impairs proper absorbance measurement. To get rid of this optical
interference, plates were centrifuged to allow particles to settle down. Then 50 µL of supernatant from each well was transferred to a clean plate, absorbance was measured and normalized to the values obtained in controls (unexposed cells). Measurement was performed on Caco-2 (A), HT29-MTX (B) or the Caco-2/HT29-MTX coculture (C), exposed to 25-200 µg/mL of E171.
0 50 100 150 200 0 50 100 150 200 v iabilit y (%) concentration (µg/mL) Caco-2 no centrifugation centrifugation