HAL Id: tel-02282007
https://tel.archives-ouvertes.fr/tel-02282007
Submitted on 9 Sep 2019HAL is a multi-disciplinary open access archive for the deposit and dissemination of sci-entific research documents, whether they are pub-lished or not. The documents may come from teaching and research institutions in France or abroad, or from public or private research centers.
L’archive ouverte pluridisciplinaire HAL, est destinée au dépôt et à la diffusion de documents scientifiques de niveau recherche, publiés ou non, émanant des établissements d’enseignement et de recherche français ou étrangers, des laboratoires publics ou privés.
contaminated by uranium
Ran Ji
To cite this version:
Ran Ji. Study of acoustic cavitation near metal surfaces contaminated by uranium. Other. Université Montpellier, 2018. English. �NNT : 2018MONTS131�. �tel-02282007�
Rapport de gestion
2015
THÈ SE POUR OBTENIR LE GRADE DE DOCTEUR
DE L’UNIVERSITÉ DE MONTPELLIER
En Chimie Sé parative - Maté riaux et Procé dé s
É cole doctorale Sciences Chimiques Balard (ED 459)
Unité de recherche Institut de Chimie Sé parative de Marcoule (UMR 5257)
Pré senté e par Ran JI
Le 13 novembre 2018
Sous la direction de Sergueï
NIKITENKO
Devant le jury composé de
[Jean-Franç ois DUFÊ CHE, Prof, Université Montpellier] [Jean-Yves HIHN, Prof, Université de Franche-Comté ] [Laurie BARTHE,MCF, INP Toulouse]
[Sergueï NIKITENKO, DR, CNRS Montpellier] [Claire LE NAOUR, CR, Université Paris Saclay] [Micheline DRAYE, Prof, Université Savoie Mont Blanc] [Rachel PFLIEGER, CR, CEA Marcoule]
[Matthieu VIROT, CR, CEA Marcoule] [Pascal PILUSO, CR, CEA Cadarache]
[Pré sident] [Rapporteur] [Rapporteur] [Directeur de Thè se] [Examinateur] [Examinateur] [Encadrant] [Encadrant] [Invité ]
Study of Acoustic Cavitation near Metal Surfaces
Contaminated by Uranium
i
Acknowledgements
The doctoral study of the past three years has greatly enriched my experience in academic and personal life. I would like to express my gratitude to my supervisors, colleagues, friends and family. Without their advice, assistance and support, the present work would not have been accomplished. I am also very grateful to all the jury members of my thesis defense for their comments and suggestions.
First and foremost, I would like to give my appreciation to my supervisor: Dr. Sergey Nikitenko, and my co-supervisors: Dr. Rachel Pflieger and Dr. Matthieu Virot. I am very fortunate and grateful to have such an opportunity to work on this topic under their guidance. Each of my publications and presentations has their invaluable contributions on countless discussions and encouragements. Without their insight and in-depth knowledge, this work could never have reached its present form.
I would like to thank my colleague Dr. Tony Chave for his patience in explaining the use of laboratory equipment and the meaning of many French words. I owe my thanks to Dr. Renaud Podor, Dr. Joseph Lautru and Xavier le Goff, who helped me with SEM, EDX analysis and 3D reconstruction measurements.
I appreciate all the people I met at ICSM during the past few years. It is a pleasure to work with them in such a good atmosphere. I am especially grateful to Danwen Qin, Elodie Dalodiere, Lauréanne Parizot, Témim Ouerhani and Laura Bonato for their kind help, friendship and amusement. We have had a lot of good times together, especially the countless and delicious dinners with Danwen (the best Chinese cuisine master in Avignon).
Finally, my ultimate and special thanks must be attributed to my mother, my father and my girlfriend, for their love, unconditional support and unwavering confidence.
iii
Résumé
Le démantèlement des réacteurs et usines de l’industrie nucléaire produit un grand volume de matériaux métalliques contaminés. Parmi ceux-ci, les alliages à base de magnésium issus des réacteurs UNGG sont connus pour être des métaux hautement réactifs présentant un risque élevé de corrosion et pouvant générer de l'hydrogène gazeux qui peut causer de graves dommages pendant le stockage. Afin de réduire le volume d’effluents radioactifs générés et de déclasser les déchets nucléaires, la sonochimie peut être considérée comme une alternative efficace pour la décontamination des surfaces métalliques. La sonochimie traite des effets des ondes ultrasonores sur les réactions chimiques en solution. Les effets observés en sonochimie proviennent du phénomène de cavitation acoustique, qui comprend la nucléation, croissance et effondrement implosif et rapide de microbulles remplies de gaz et de vapeur de solvant. Des espèces excitées ainsi que des radicaux peuvent être générés lors de son implosion. Le plasma formé au cœur de la bulle permet l’émission de lumière se propageant de l’UV au proche IR (sonoluminescence). Lorsque l’effondrement des bulles a lieu à proximité d'une surface solide étendue, la formation d’ondes de choc violentes et de micro-jets dirigés vers la surface contribue fortement au nettoyage, à la dépassivation et à la décontamination de surfaces métalliques.
Cette étude cible la décontamination de surfaces métalliques à base de magnésium sous irradiation ultrasonore. Après une synthèse bibliographique permettant de faire un état de l’art sur le traitement de surfaces métalliques par ultrasons de puissance, les outils expérimentaux et techniques analytiques utilisés dans ce travail sont décrits. La partie résultats et discussion est ensuite présentée selon trois chapitres distincts visant : 1) une étude fondamentale de sonoluminescence à 100 kHz permettant la caractérisation du phénomène de cavitation acoustique à proximité de surfaces solides étendues ; 2) l’étude de la structuration de surfaces de Mg sous irradiation ultrasonore ; 3) le traitement ultrasonore de surfaces métalliques radioactives contaminées au laboratoire avec de l’uranium naturel.
Ce travail met en évidence le fort impact de la fréquence ultrasonore sur l'activité sonochimique, sa distribution spatiale et sur les effets générés sur des échantillons de magnésium. Une répartition spatiale homogène de l'activité sonochimique est observée aux fréquences ≥ 100 kHz. Les résultats confirment que l'effondrement asymétrique des bulles est susceptible de se produire à proximité des surfaces solides étendues. La formation d’une structure allongée semblable à une balle de golf est observée pour des fréquences comprises entre 100 et 362 kHz. De telles architectures résultent de la dissolution sonochimique contrôlée de la surface de Mg. Il est probable que la nucléation hétérogène assurée par la création de défauts sous ultrasons combiné à la libération de gaz H2 soient à l'origine de cette
structuration. Les essais réalisés sur un alliage Mg-Zr montrent un comportement similaire permettant de simuler le comportement d’une gaine de réacteur UNGG. La décontamination rapide et totale de ces
iv
différents matériaux est observée en milieu oxalique dilué à 20°C. Un faible et lent processus de recontamination des matériaux à base de Mg est observé du fait de l'adsorption d’uranyle par la brucite formée sur les surfaces. Les essais réalisés sur des échantillons à géométrie complexe permettent également de souligner le fort potentiel de la sonochimie pour la décontamination efficace de surfaces à base de Mg.
v
Abstract
The dismantling of UNGG reactors produces large volumes of contaminated metallic materials. Among these, magnesium-based alloys which are known as highly reactive metals, have a high risk of corrosion and can generate hydrogen gas that can cause serious damages during storage. In order to reduce the volume of generated radioactive effluents and downgrade nuclear wastes, sonochemistry can be considered as an original and efficient alternative for metallic surface decontamination. Sonochemistry deals with the effects of ultrasound waves on chemical reactions in solution. The effects observed in sonochemistry originate from the acoustic cavitation phenomenon, which is the nucleation, growth and rapid implosive collapse of gas and vapor filled microbubbles. Excited species and radicals can be generated in the formed plasma and light (sonoluminescence) is emitted. When the bubble collapse takes place in the vicinity of a solid surface, it produces violent shock waves and microjets directed towards the surface. These physical effects strongly contribute in ultrasonic cleaning, surface depassivation and decontamination.
This study focuses on the decontamination of magnesium metal surfaces under ultrasonic irradiation. After a bibliographic synthesis making a state of the art on the treatment of metallic surfaces by ultrasonic power, the experimental tools and analytical techniques used in this work are described. The results and discussion section are then presented in three separate chapters: 1) a fundamental 100 kHz sonoluminescence study for the characterization of the acoustic cavitation phenomenon in solution and near extended solid surfaces; 2) a study of the structuring of Mg-based surfaces under ultrasonic irradiation; 3) Ultrasonic treatment of radioactive metal surfaces contaminated in the laboratory with natural uranium.
This work highlights the strong impact of ultrasonic frequency on sonochemical activity, its spatial distribution and the effects generated on magnesium samples. A homogeneous spatial distribution of sonochemical activity is observed at frequencies ≥ 100 kHz. The results confirm that asymmetrical bubble collapse is likely to occur near extended solid surfaces. The formation of an elongated structure similar to a golf ball is observed for frequencies between 100 and 362 kHz. Such architectures result from controlled sonochemical dissolution of the Mg surface. It is likely that the heterogeneous nucleation provided by the creation of ultrasonic flaws combined with the release of H2 gas is at the
origin of this structuring. The tests carried out on a Mg-Zr alloy show a similar behavior making it possible to simulate the behavior of a UNGG reactor cladding. Rapid and total decontamination of these different materials is observed in dilute oxalic medium at 20°C. A low and slow recontamination process of Mg-based materials is observed due to uranyl adsorption by brucite formed on the surfaces. Tests on samples with complex geometry also highlight the high potential of sonochemistry for effective decontamination of Mg-based surfaces.
vii
Foreword
The work presented in this thesis manuscript has been the subject of several scientific communications detailed hereinafter:
Award
Best oral presentation award from the Asia-Oceania Sonochemical Society (AOSS-3), Structuration of Magnesium Surface by Acoustic Cavitation, September 14th to 16th 2017, Kattankulathur, Chennai, India.
Publications
R. Ji, R. Pflieger, M. Virot, and S. I. Nikitenko, Multibubble Sonochemistry and Sonoluminescence at 100 kHz: The Missing Link between Low- and High-Frequency Ultrasound The Journal of Physical
Chemistry B 122 (2018) 6989–6994.
R. Ji, M. Virot, R. Pflieger, R. Podor, X. Le Goff, S. I. Nikitenko, Controlled “Golf Ball Shape” Structuring of Mg Surface under Acoustic Cavitation Ultrasonics Sonochemistry 40 (2017) 30-40. Communications (talks)
Acoustic Cavitation at Intermediate Frequency (100 kHz) Ultrasound, 16th Meeting of the European Society of Sonochemistry (ESS 16th), April 15th to 19th 2018, Besançon, France.
Structuration of Magnesium Surface by Acoustic Cavitation, 3rd Asia - Oceania Sonochemical Society conference (AOSS-3rd), September 14th to 16th 2017, Kattankulathur, Chennai, India.
Structuration of Magnesium Surface by Acoustic Cavitation, Journées Scientifiques Ultrasons et Procédés (JSUP IV), July 4th to 5th 2017, Toulouse, France.
Poster presentations
R. Ji, M. Virot, R. Pflieger, S. I. Nikitenko, Mg Surface Decontamination by Power Ultrasound in Aqueous Solution, Journées scientifiques de Marcoule, 2018, Bagnols sur Cèze, France.
R. Ji, M. Virot, R. Pflieger, S. I. Nikitenko, Structuration of Magnesium Surface by Acoustic Cavitation, Journées scientifiques de Marcoule, 2017, Bagnols sur Cèze, France.
R. Ji, M. Virot, R. Pflieger, S. I. Nikitenko, Acoustic Cavitation near Metal Surfaces Contaminated with Radionuclides, XVèmes Journées Nationales de Radiochimie et de Chimie Nucléaire, September 8th to
9th 2016, Nice, France.
R. Ji, M. Virot, R. Pflieger, S. I. Nikitenko, Acoustic Cavitation near Metal Surfaces Contaminated with Radionuclides, Journées scientifiques de Marcoule, 2016, Bagnols sur Cèze, France.
ix
Contents
ACKNOWLEDGEMENTS ... I RESUME ... III ABSTRACT ... V FOREWORD ... VII CONTENTS ... IX TABLE OF FIGURES ... XIII LIST OF TABLES ... XXIIIINTRODUCTION ... 1
CHAPTER I. BIBLIOGRAPHY ... 3
I.1 ULTRASOUND AND SONOCHEMISTRY ... 5
I.1.1 Ultrasound ... 5
I.1.2 Acoustic cavitation ... 6
I.1.3 Sonochemistry ... 12
I.1.4 Sonoluminescence ... 13
I.1.5 Dependence of sonochemistry and sonoluminescence on various factors... 16
I.2 ULTRASONIC MODIFICATION AND CLEANING OF SOLID SURFACES ... 21
I.2.1 Ultrasonic modification of solid surfaces ... 22
I.2.2 Ultrasonic cleaning of solid surfaces ... 26
I.3 DECONTAMINATION OF UNGG RADIOACTIVE STRUCTURE MATERIALS ... 27
I.3.1 UNGG reactors ... 27
I.3.2 Nuclear reactor cladding material: Mg-Zr alloy and stainless steel ... 35
I.3.3 Radioactive waste and decontamination method ... 40
CHAPTER II. MATERIALS AND METHODS ... 51
II.1 MATERIALS ... 53
II.2 PREPARATION OF CONTAMINATED METALLIC SURFACES ... 54
II.3 APPARATUS ... 54
II.4 CALIBRATION AND CHARACTERIZATION OF THE SONOREACTORS ... 57
II.4.1 Calorimetric method ... 57
II.4.2 Formation of H2O2 by water sonolysis ... 59
II.5 CHARACTERIZATION METHOD ... 60
x
II.5.2 Solution characterization ... 66
II.5.3 Gas characterization ... 66
II.5.4 Cavitation characterization ... 67
CHAPTER III. ACOUSTIC CAVITATION BEHAVIOR AT 100 KHZ AND IN THE VICINITY OF A SOLID BOUNDARY 69 III.1 INTRODUCTION ... 71
III.2 SONOCHEMISTRY AND SONOLUMINESCENCE IN AQUEOUS SOLUTION AT 100 KHZ ... 71
III.2.1 Sonochemical activity and SCL at different ultrasonic frequencies ... 72
III.2.2 Sonoluminescence photos and spectra at different ultrasonic frequencies ... 74
III.3 SONOCHEMISTRY AND SONOLUMINESCENCE IN THE VICINITY OF A SOLID BOUNDARY ... 80
III.3.1 Fixed stainless steel plate ... 81
III.3.2 Mobile stainless steel plate and Mg disc ... 86
III.4 CONCLUSION ... 91
CHAPTER IV. METALLIC SURFACE STRUCTURATION BY ULTRASOUND ... 93
IV.1 INTRODUCTION ... 95
IV.2 STRUCTURATION OF MG-BASED MATERIAL SURFACES BY ULTRASOUND... 95
IV.2.1 Characterization of native Mg surfaces ... 95
IV.2.2 Frequency effect on Mg surface sonication ... 97
IV.2.3 Solutions effect on Mg surface sonication ... 103
IV.2.4 Stirring velocity effect on Mg surface sonication ... 112
IV.2.5 Evolution of Mg surfaces sonicated at 200 kHz in oxalic acid ... 113
IV.2.6 Sonication of Mg-Zr surfaces ... 116
IV.3 CONCLUSION ... 121
CHAPTER V. METALLIC SURFACE DECONTAMINATION BY ULTRASOUND ... 123
V.1 INTRODUCTION ... 125
V.2 MG BASED MATERIAL SURFACES DECONTAMINATION BY ULTRASOUND ... 125
V.2.1 Characterization of UNGG cladding material and the contaminates on Mg based surfaces ... 125
V.2.2 Ultrasonic decontamination results ... 133
V.3 STAINLESS STEEL SURFACES DECONTAMINATION BY ULTRASOUND ... 142
V.3.1 Characterization of stainless steel and the contaminates on stainless steel surfaces ... 142
V.3.2 Ultrasonic decontamination results ... 144
V.4 CONCLUSION ... 148
GENERAL CONCLUSION ... 151
xi
APPENDIXES ... 175
APPENDIX A:CALORIMETRIC RESULTS ... 175
APPENDIX B:MOLAR EXTINCTION COEFFICIENT DETERMINATION ... 178
APPENDIX C:H2 FORMATION DETERMINATION DURING MS MEASUREMENT ... 179
APPENDIX D:SPECTRAL WAVELENGTH CALIBRATION AND QUANTUM EFFICIENCIES OF GRATINGS AND CCD ... 180
APPENDIX E:SIMULATION OF SL SPECTRA WITH SPECAIR SOFTWARE ... 180
APPENDIX F:SL EMISSION ABSORPTION BY H2O2 ... 181
APPENDIX G:MG SURFACE TOPOGRAPHY TREATED AT 665 KHZ ... 182
APPENDIX H:SCL PHOTOS ... 182
APPENDIX I:INFRARED AND RAMAN BANDS ... 183
xiii
Table of figures
Figure I-1 Ultrasound frequency category.[3] ... 5
Figure I-2 Acoustic cavitation generation and collapse.[11] ... 7
Figure I-3 Micro-jet formation.[26] ... 10
Figure I-4 Shock wave from a trapped sonoluminescing bubble produced by ultrasound at 21.4 kHz, pressure amplitude of 132 kPa, frame interval 30 ns.[29] ... 11
Figure I-5 Sonoluminescence generation from a cavitation bubble.[58] ... 14
Figure I-6 Comparison of MBSL and SBSL spectra in 1 M NaCl solution.[62] ... 15
Figure I-7 Size distribution of chemically active bubbles at different ultrasonic frequencies in 0.01 M luminol solution saturated by air.[56] ... 16
Figure I-8 Schema of a resonant standing wave: pressure variation (black) and displacement variation (grey). ... 20
Figure I-9 Surface roughness of ABS versus etching time in the presence and absence of ultrasound.[110] ... 22
Figure I-10 Erosion of fused silica glass sonicated 180 min in distilled water at 25°C by 20 kHz ultrasound at 49 W.cm-2.[32] ... 23
Figure I-11 SEM images of metallic surfaces sonicated at 20 kHz in pure water (40°C, 40 W.cm-2): (a) Al sonicated during 4 min; (b) Cu sonicated during 10 min; (c) Ag sonicated during 10 min and (d) Zn sonicated during 10 min.[120] ... 24
Figure I-12 SEM images of metallic surfaces sonicated at 20 kHz in pure water (65°C, 57 W.cm-2): (a) Al; (b) Mg alloys; (c) stainless steel; and (d) in 5 M NaOH solution (60°C, maximum 200 W.cm-2) Ti.[115, 122] ... 25
Figure I-13 Ultrasonic cleaning application as a function of frequency.[127] ... 26
Figure I-14 Cleaning of microstructures with high aspect ratio: without (left) and with megasonics (right).[129] ... 27
Figure I-15 Location of the 9 French UNGG reactors.[132] ... 28
Figure I-16 Scheme of a UNGG reactor (type SLA2).[132] ... 31
xiv
Figure I-18 UNGG fuel element evolution.[136] ... 33
Figure I-19 a) UNGG graphite pile in construction (CHA3, 1965);[133] b) UNGG fuel tube;[2] c) UNGG
graphite brick (type SLA2).[137] ... 34
Figure I-20 Element melting temperatures versus neutron absorption cross-sections.[139] ... 36
Figure I-21 Galvanic corrosion in the case of graphite deposited on Mg surface.[2] ... 39
Figure I-22 Mg structural waste stored in wet silos at Marcoule: a) Entire Mg alloy claddings; b) sheared fragments.[1] ... 42
Figure I-23 Inactive simulated Mg claddings in 223 L stainless steel container: a) before grouting; b) geopolymer material grouting; c) profile view after cutting the grouted package.[1] ... 42
Figure I-24 Radioactivity evolution of an ILW-LL package.[161] ... 43
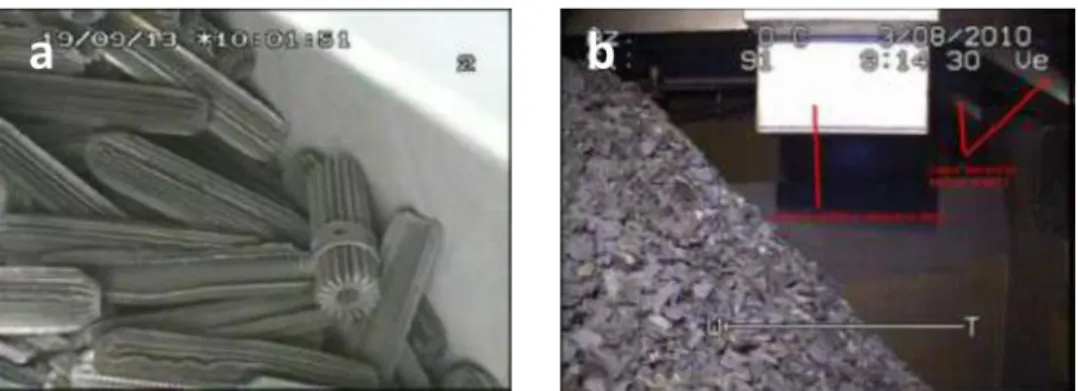
Figure I-25 Contaminates classification: free contamination, loose contamination, fixed contamination in cracks and in oxides. ... 44 Figure I-26 a) Ultrasonic fuel-cleaning technology scheme and b) video inspection of fuel assembly from USA Callaway plant before and after cleaning.[168] ... 46
Figure I-27 Ultrasonic cleaning equipment for VVER fuel assemblies in Russia.[169] ... 46
Figure I-28 a) Ultrasonic bath MO-42 for fuel assembly cladding decontamination and fuel assembly waste fragment from submarine: b) before treatment, c) after treatment.[169] ... 48
Figure I-29 MO-21 ultrasonic bath (left) and a remotely controlled ultrasonic module (right).[169] .... 48
Figure I-30 Underwater ultrasonic generators in decontamination tanks at La Hague: a) type AD1-BDH and b) type R7 for dismantling of vitrification plant [courtesy of Sinaptec]... 49 Figure II-1 UNGG cladding tube fragment used for sonication experiments. The Figure clearly shows the complexity of the sample and the chemical composition differences (inside vs. outside). ... 53 Figure II-2 Mg-Zr disc contamination procedure. ... 54 Figure II-3 Mg ribbon contaminated with a 0.02 M UO2(NO3)2 aqueous solution a) after heating, b)
bent in the form of a cylinder to simulate a sample with a complex geometry. ... 54 Figure II-4 Schematics of the reactors used for the sonication of the various metallic surfaces at (a) high and (b) low frequency ultrasound. Both set-ups enable the control of temperature, the sampling of solution, and the control of the sample position in the cell. ... 56 Figure II-5 Tea mesh filter used for samples with a complex geometry. ... 56 Figure II-6 Sonoluminescence and sonochemiluminescence apparatus schematic. ... 57
xv
Figure II-7 Example of the temperature variation of pure water (250 mL) sonicated at 100 kHz (Ar, 100
rpm stirring). ... 58
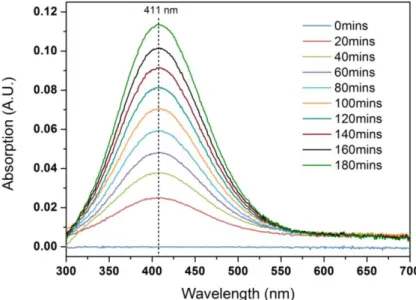
Figure II-8 UV-vis absorption spectra of the peroxotitanium(IV) complex formed by mixing sonicated pure water (100 kHz, Pac= 40 W, 20°C, Ar, 100 rpm stirring) with TiOSO4 solution. ... 60
Figure II-9 X-ray diffraction.[183]... 62
Figure II-10 Surface wetting: a) Wenzel model; b) Cassie–Baxter model.[188] ... 64
Figure II-11 Energy level diagram of Raman scattering.[189] ... 65
Figure II-12 SL spectrometer schematic (SP 2356i, Roper Scientific) ... 68
Figure III-1 H2O2 yields in pure water sonicated at 20 kHz (Pac= 33 W), 100 kHz (Pac= 40 W), 200 kHz (Pac= 45 W), 362 kHz (Pac= 43 W) and 612 kHz (Pac= 61 W) under 100 mL.min-1 Ar (blue) and Ar/(20 vol.%)O2 (red) flow, at 18°C, 100 rpm mechanical stirring (except at 20 kHz); insert: ratio of H2O2 yields for Ar/(20 vol.%)O2 and Ar. ... 72
Figure III-2 Photographs of 0.01 M luminol solution (pH = 11, Na2CO3) submitted to 20 kHz (Pac= 33 W), 100 kHz (Pac= 40 W) and 362 kHz (Pac= 43 W) under 100 mL.min-1 Ar and Ar/(20 vol.%)O2 flow at 18°C; exposure 10 s. ... 73
Figure III-3 Photographs of 0.01 M luminol solution (pH= 11, Na2CO3) submitted to a) 100 kHz (Pac= 40 W) from glass wall side and b) 362 kHz (Pac= 43 W) from optical window side, under 100 mL.min-1 Ar/(20 vol.%)O2 flow, at 18°C; exposure 10 s. ... 74
Figure III-4 Photographs of water SL at 20 kHz (Pac= 33 W), 100 kHz (Pac= 40 W) and 362 kHz (Pac= 43 W) under 100 mL.min-1 Ar and Ar/(20 vol.%)O 2 flow, at 18°C; exposure 60 s. ... 74
Figure III-5 SL spectra of pure water sonicated at 20 kHz (Pac= 33 W), 100 kHz (Pac= 40 W) and 362 kHz (Pac= 43 W) under 100 mL.min-1 Ar and Ar/(20 vol.%)O2 flow, at 18°C. The apparent broad peak around 400-475 nm at 362 kHz is an artefact due to 2nd order light emission of the strong SL UV part. ... 76
Figure III-6 Normalization of higher resolution SL spectra (after subtraction of a linear baseline) and their simulation (Specair) curves for water at 20 kHz (Pac= 33 W), 100 kHz (Pac= 40 W) and 362 kHz (Pac= 43 W) under 100 mL.min-1 Ar (blue) and Ar/(20 vol.%)O2 (red) flow, 18°C. ... 77
Figure III-7 SL spectra of pure water submitted to 20 kHz (blue, Pac= 33 W), 100 kHz (red, Pac= 40 W) and 362 kHz (green, Pac= 43 W) at 18°C under 100 mL.min-1 Ar/(20 vol.%)N2 flow. ... 79
Figure III-8 SL spectra of 1 M NaCl solution sonolysis at 362 kHz (Pac= 43 W) under 100 mL.min-1 Ar flow, 14°C. ... 81
xvi
Figure III-10 SL intensity of Na* (589 nm) as a function of the observation position in the presence of a fixed stainless steel plate in 1 M NaCl solution sonicated at 362 kHz (Pac= 43 W) under 100 mL.min -1 Ar flow, at 14°C. ... 83
Figure III-11 SL intensity of continuum (500 nm) as a function of the observation position in the presence of a fixed stainless steel plate in 1 M NaCl solution sonicated at 362 kHz (Pac= 43 W) under
100 mL.min-1 Ar flow, at 14°C. ... 83
Figure III-12 Scheme of the observation positions made through the quartz window correlated to 3 different zones ... 84 Figure III-13 SL intensity ratio between Na* (589 nm) and continuum (500 nm) emission as a function of the observation position in the presence of a fixed stainless steel plate in 1 M NaCl solution sonolysis at 362 kHz (Pac= 43 W) under 100 mL.min-1 Ar flow, at 14°C. ... 84
Figure III-14 Photographs of SL in pure water submitted to 100 kHz (Pac= 20 W) under 110 mL.min-1
Ar flow, at 18°C, exposure 120 s: a) free surface and b) stainless steel plate (on the top of the quartz window); photographs of SCL in 0.01 M luminol solution (pH= 11, Na2CO3) submitted to 100 kHz (Pac=
20 W) under 100 mL.min-1 Ar/(20 vol.%)O
2 flow, at 17°C, exposure 60 s) free surface and d) stainless
steel plate ... 85 Figure III-15 SL spectra in the presence of a stainless steel plate in 1 M NaCl solution at 362 kHz (Pac=
43 W) under 100 mL.min-1 Ar flow, 18°C, at resonant mode (red) and non-resonant mode (green)
distances ... 89 Figure III-16 SL spectra in the presence of Mg surface in the mixture solution of 1 M NaCl and 0.001 M oxalic acid at 362 kHz (Pac= 43 W) under 100 mL.min-1 Ar flow, at 18°C: free surface (blue),
“anti-resonant” mode (red) and ““anti-resonant” mode (green) distances ... 91 Figure IV-1 Photo and SEM observation of a native Mg surface. ... 95 Figure IV-2 3D reconstruction of a native Mg surface (insert: image of water contact angle). ... 96 Figure IV-3 Photos of Mg surfaces treated for 1 hour in 0.01 M oxalic acid solution (Ar, 18°C): a) under silent condition, stirring; b) at 20 kHz, Pac= 20 W; c) at 200 kHz, Pac= 20 W, stirring; d) at 1 MHz Pac=
40 W, stirring. ... 97 Figure IV-4 Mg surface treated at 20 kHz, Pac= 20 W for 1 hour in 0.05 M oxalic acid solution (Ar,
17°C): a) photo; b) and c) SEM observations. ... 97 Figure IV-5 SEM observations of Mg surfaces treated for 1 hour in 0.01 M oxalic acid solution, (Ar, 18°C, stirring 200 rpm): under silent condition; at 20 kHz, Pac= 20 W, no stirring; at 200 kHz, Pac= 20
xvii
Figure IV-6 Crater structures on Mg surface treated for 1 hour in 0.01 M oxalic acid solution (Ar, 18°C): a) and b) SEM observation with a 65° tilt angle at 200 kHz, Pac= 20 W; c) 3D reconstruction at 100 kHz,
Pac= 20 W. ... 100
Figure IV-7 3D reconstruction of Mg surfaces treated for 1 hour in 0.01 M oxalic acid solutions, Ar, 18°C stirring 200 rpm: a) under silent condition; b) 20 kHz, Pac= 20 W, no stirring; c) 200 kHz, Pac= 20
W, stirring; d) 1 MHz Pac= 40 W, (insert: images of water contact angle). ... 101
Figure IV-8 3D reconstruction of Mg surface treated at 20 kHz, Pac= 20 W for 1 hour in 0.05 M oxalic
acid solution (Ar, 17°C). The insert shows an image of water contact angle. ... 102 Figure IV-9 Solid surface wetting: a) Young contact angle; b) Wenzel model; c) Cassie-Baxter model.[224] ... 102
Figure IV-10 SEM observations of Mg surfaces treated at 200 kHz, Pac= 20 W, stirring, Ar, 18°C for 1
hour in: water, 0.01 M sodium oxalate solution and 0.001 M oxalic acid solution. ... 104 Figure IV-11 Mg surfaces treated at 200 kHz (Pac= 20 W, stirring, Ar, 18°C) for 1 hour in water, 0.001
M and 0.01 M oxalic acid solutions: a) water contact angle evolution; SEM image of Mg surface after 30 min treatment in b) 0.01 M oxalic acid solution and c) 0.001 M oxalic acid. ... 105 Figure IV-12 Dissolution of Mg surfaces treated at 200 kHz (Pac= 20 W, stirring, Ar, 18°C) for 1 hour
in water, 0.01 M sodium oxalate solution, 0.001 M and 0.01 M oxalic acid solutions. ... 107 Figure IV-13 Raman spectra of the white precipitate obtained in solution after Mg surface sonication at 20 kHz, Pac= 20 W for 1 hour in 0.05 M oxalic acid solution (Ar, 17°C) and glushinskite standard as
reference ... 107 Figure IV-14 X-ray diffraction pattern of the white precipitate obtained in solution after Mg surface sonication at 20 kHz, Pac= 20 W for 1 hour in 0.05 M oxalic acid solution (Ar, 17°C) (standard patterns
of MgC2O4 JCPDS 00-028-0625 and MgC2O4•2H2O JCPDS 00-026-1223) ... 108
Figure IV-15 SEM observations of the secondary phases on Mg surfaces treated at 200 kHz (Pac= 20
W, Ar, 18°C) for 1 hour in 0.01 M oxalic acid solution... 109 Figure IV-16 ATR-FTIR spectra of native Mg surface and of Mg surfaces treated at 200 kHz (Pac= 20
W, stirring, Ar, 18°C) for 1 hour in water, 0.01 M sodium oxalate solution and 0.01 M oxalic acid solution. ... 110 Figure IV-17 SEM-EDX analysis of secondary phases on Mg surface treated at 200 kHz (Pac= 20 W
for 1 hour in 0.01 M oxalic acid solution, Ar, 18°C). A shadowing effect can be noted on Mg map due to the position of the detector. Mg X-ray counts on the oxides are lower than bulk Mg explaining the color intensity differences for this map. ... 111
xviii
Figure IV-18 SEM observations of Mg surfaces treated at 200 kHz (Pac= 20 W, stirring, Ar, 20°C) for
1 hour in 0.01 M oxalic, sulfamic and nitric acid solutions. ... 111 Figure IV-19 Dissolution of Mg surfaces in 0.01 M oxalic acid solution, Ar, 20°C for 30 minutes by immersion, stirring (100 rpm and 200 rpm) and sonicated at 345 kHz, Pac= 40 W with stirring (100 rpm).
... 112 Figure IV-20 Iterative SEM observations of a crater structure formation on Mg surface treated at 100 kHz, Pac= 20 W for 1.5 hours in 0.001 M oxalic acid solution (Ar, 18°C): a) 10 min; b) 30 min; c) 60
min and d) 90 min. ... 113 Figure IV-21 Scheme of pitting corrosion on Mg surface ... 114 Figure IV-22 SEM observations of crater structures at grain boundaries on Mg surface treated at 345 kHz (Pac= 40 W, Ar, 20°C) for 1 hour in 0.01 M oxalic acid solution. ... 115
Figure IV-23 Photo and SEM observation of a native Mg-Zr surface. ... 116 Figure IV-24 3D reconstruction of a native Mg-Zr surface (insert: image of water contact angle). .. 117 Figure IV-25 Mg-Zr surface treated at 345 kHz, Pac= 40 W, stirring for 1 hour in 0.01 M oxalic acid
solution (Ar, 20°C): a) photo; b) and c) SEM observations. ... 118 Figure IV-26 3D reconstruction of Mg-Zr surface treated at 345 kHz, Pac= 40 W for 1 hour in 0.01 M
oxalic acid solution (Ar, 20°C). The insert is an image of the water contact angle. ... 118 Figure IV-27 Mg-Zr surfaces treated at 100 kHz, Pac= 20 W, stirring, Ar, 20°C for 2 hours in 0.001 M
oxalic acid (insert: SEM images at 30 minutes and 2 hours). ... 119 Figure IV-28 Mg-Zr surface treated at 345 kHz, Pac= 40 W for 1 hour in 0.01 M oxalic acid solution,
Ar, 20°C: a) zone with secondary phase; b) zone without secondary phase. ... 119 Figure IV-29 Dissolution of pure Mg and Mg-Zr surfaces treated at 345 kHz, Pac= 40 W, stirring, Ar,
20°C for 1 hour in 0.01 M oxalic acid solution. ... 121 Figure IV-30 SEM observations of Mg surface treated for 1 hour in 0.01 M oxalic acid solution, (Ar/(20 vol.%)O2, 20°C, stirring 100 rpm) at 345 kHz Pac= 40 W. ... 122
Figure V-1 Non-irradiated UNGG cladding tube fragment: a) photo; SEM BSE images of b) fin side and c) carbon side. ... 126 Figure V-2 X-ray diffraction pattern of the outer side (fin side) of a non-irradiated UNGG cladding tube fragment, in comparison with standard patterns of Mg JCPDS 00-035-0821, MgO JCPDS 01-080-4185 and Mg(OH)2 JCPDS 01-078-3952). ... 127
xix
Figure V-3 X-ray diffraction pattern of the inner side (carbon side) of a non-irradiated UNGG cladding tube fragment, in comparison with standard patterns of Mg JCPDS 089-5003, carbon JCPDS 01-075-0444 and Mg(OH)2 JCPDS 01-078-3952). ... 127 Figure V-4 FTIR spectra of a non-irradiated UNGG cladding tube fragment (fin side and carbon side), and non-contaminated areas of as-prepared pure Mg and Mg-Zr samples ... 128 Figure V-5 Raman spectra of a non-irradiated UNGG cladding tube fragment (fin side and carbon side), and non-contaminated area of as-prepared pure Mg and Mg-Zr samples. ... 128 Figure V-6 Contaminated Zr surface prepared by calcination at 500°C under Ar atmosphere of Mg-Zr surface on which 70 µL of 0.1 M UO2(NO3)2 were homogenously deposited. The right side of the
figure shows a SEM image of the contamination. ... 129 Figure V-7 Photos of: a) U3O8 produced by heating ammonium diuranate;[250] b) β-UO3 powder; c)
γ-UO3 powder[251] and d) as-prepared contaminated Mg-Zr surface (0.1 M UO2(NO3)2 70 μL). ... 130
Figure V-8 X-ray diffraction pattern of the fin side of a UNGG cladding tube fragment contaminated with 70 µL of 0.1 M UO2(NO3)2 in comparison with standard patterns of Mg (JCPDS 00-035-0821),
MgU3O10 (JCPDS 00-034-0985) and UO3 (JCPDS 00-015-0201). ... 131
Figure V-9 FTIR spectra of as-prepared contaminated Mg-Zr (0.1 M UO2(NO3)2, 70 μL) ... 132
Figure V-10 Raman spectra of as-prepared contaminated Mg-Zr (0.1 M UO2(NO3)2 70 μL) ... 132
Figure V-11 Photos and SEM images of Mg-Zr surfaces contaminated with U (0.1 M UO2(NO3)2, 70
μL) decontaminated under silent conditions (a and b) and by 345 kHz ultrasound, Pac= 40 W (c and d)
in 0.01 M oxalic acid, Ar, stirring 100 rpm, 20°C, 90 min ... 134 Figure V-12 α-radioactivity evolution of Mg-Zr surfaces contaminated with U (0.1 M UO2(NO3)2, 70
μL) decontaminated by 345 kHz ultrasound, Pac= 40 W (blue) and under silent conditions (red) in 0.01
M oxalic acid, Ar, stirring 100 rpm, 20°C, 90 min ... 135 Figure V-13 Photos of a contaminated Mg ribbon (0.1 M UO2(NO3)2, 50 μL) wound in a complex
geometry before and after 345 kHz sonication (Pac= 40 W) during 90 min in 0.01 M oxalic acid, Ar,
stirring 100 rpm, 20°C. ... 136 Figure V-14 α-radioactivity evolution of the inner side of a contaminated Mg ribbon (0.1 M UO2(NO3)2,
50 μL) wound in a complex geometry sonicated during 90 min at 345 kHz in 0.01 M oxalic acid, Ar, stirring 100 rpm, 20°C, Pac= 40 W (insert: SEM image after treatment). ... 136
Figure V-15 Photos of an as-prepared contaminated UNGG cladding fin side sample (0.1 M UO2(NO3)2,
30 μL) before and after 345 kHz sonication (Pac= 40 W) during 90 min in 0.01 M oxalic acid, Ar, stirring
xx
Figure V-16 α-radioactivity evolution of contaminated UNGG cladding fin side sample (0.1 M UO2(NO3)2, 30 μL) decontaminated by 345 kHz (Pac= 40 W) during 90 min in 0.01 M oxalic acid, Ar,
stirring 100 rpm, 20°C (insert: SEM image after treatment) ... 138 Figure V-17 Photos of the inner side of a UNGG cladding fragment showing the presence of carbon a) before and b) after 1 hour treatment in 0.01 M oxalic acid (345 kHz ultrasound, Ar, stirring 100 rpm, 20°C, Pac= 40 W (note: both samples are different). ... 138
Figure V-18 SEM observations of the inner carbon side of a UNGG cladding fragment a) before and b) after 1 h sonication (345 kHz) in 0.01 M oxalic acid (Ar, stirring 100 rpm, 20°C, Pac= 40 W). ... 139
Figure V-19 SEM-EDX analyses of the secondary phases observed on the fin side of a contaminated UNGG cladding fragment (0.1 M UO2(NO3)2, 30 μL) sonicated at 345 kHz during 90 min in 0.01 M
oxalic acid (Ar, stirring 100 rpm, 20°C, Pac= 40 W). ... 140
Figure V-20 ATR-FTIR spectra of contaminated Mg surfaces (0.1 M UO2(NO3)2, 70 μL) sonicated at
345 kHz during 1 hour in 0.01 M oxalic acid (Ar, stirring 100 rpm, 20°C, Pac= 40 W). ... 141
Figure V-21 Schematic representation of metal ions Mn+ adsorbed in Brucite structure.[253] ... 141
Figure V-22 Contaminated stainless steel surface prepared by calcination at 500°C under Ar atmosphere of a stainless steel surface on which 70 µL of 0.1 M UO2(NO3)2 were homogenously deposited. The
right side of the figure shows a SEM image of the contamination ... 143 Figure V-23 X-ray diffraction pattern of an as-prepared contaminated stainless steel surface (0.1 M UO2(NO3)2, 70 μL) (standard patterns of UO3 JCPDS 00-031-1416, U3O8 JCPDS 01-076-1851 and
CrFe7C0.45 JCPDS 03-065-9781). ... 143
Figure V-24 FTIR spectra of as-prepared contaminated stainless steel surface (0.1 M UO2(NO3)2, 70
μL) ... 144 Figure V-25 Raman spectra of as-prepared contaminated stainless steel surface (0.1 M UO2(NO3)2, 70
μL) ... 144 Figure V-26 Radioactivity evolution of contaminated stainless steel surfaces (0.1 M UO2(NO3)2 70 μL)
treated in 0.01 M oxalic acid, Ar, stirring 100 rpm, 20°C, for 90 minutes under silent condition (red) and by 345 kHz ultrasound, Pac= 40 W (blue). ... 145
Figure V-27 Photos and SEM images of stainless steel surfaces contaminated with U (0.1 M UO2(NO3)2,
70 μL) treated under silent conditions (a and b) and by 345 kHz ultrasound, Pac= 40 W (c and d) in 0.01
xxi
Figure V-28 Radioactivity evolution of contaminated stainless steel surfaces (0.1 M UO2(NO3)2 70 μL)
treated in 1 M nitric acid, Ar, stirring 100 rpm, 20°C, for 90 minutes under silent condition (red) and by 345 kHz ultrasound, Pac= 40 W (blue) ... 147
Figure V-29 Photos and SEM images of stainless steel surfaces contaminated with U (0.1 M UO2(NO3)2,
70 μL) decontaminated under silent conditions (a and b) and by 345 kHz ultrasound, Pac= 40 W (c and
xxiii
List of tables
Table I-1 Rovibronic temperatures estimated from the simulations of molecular emissions in sonoluminescence spectra from aqueous solutions.[18, 21, 23] ... 9
Table I-2 Characteristics of the 9 UNGG reactors implemented in France.[132, 133] ... 29
Table I-3 Composition of the coolant gas used in a UNGG reactor (SLA1 and SLA2).[132] ... 34
Table I-4 French radioactive waste classification.[132] ... 41
Table II-1 Calorimetric results obtained at 100 kHz (250 mL water, Ar, stirring at 100 rpm). ... 59 Table III-1 Ratios (between Ar-20%O2 and Ar) of OH peak height taken at 309 nm and of SL continuum
at 500 nm at different ultrasonic frequencies: 20 kHz (Pac= 33 W), 100 kHz (Pac= 40 W) and 362 kHz
(Pac= 43 W), 18°C. ... 76
Table III-2 Estimated vibrational (Tv) and rotational (Tr) temperatures of OH (A2Σ+) in water sonolysis
by 20 kHz (Pac= 33 W), 100 kHz (Pac= 40 W) and 362 kHz (Pac= 43 W) under 100 mL.min-1 Ar and
Ar/(20 vol.%)O2 at 18°C. ... 78
Table III-3 Photographs of SCL in 0.01 M luminol solution (pH= 11, Na2CO3) and SL in 1 M NaCl
solution in the presence of a stainless steel plate submitted to 362 kHz (Pac= 43 W) under 100 mL.min -1 Ar flow, at 18°C, exposure 20 s. ... 88
Table III-4 Photographs of SL in the presence of Mg surface in solution of 1 M NaCl and 0.001 M oxalic acid mixture submitted to 362 kHz (Pac= 43 W) under 100 mL.min-1 Ar flow, at 18°C, exposure
20 s. ... 90 Table IV-1 Chemical composition of a native Mg surface by EDX analysis... 96 Table IV-2 acoustic bubble resonance radius and estimated crater size of Mg surfaces treated for 1 hour in 0.01 M oxalic acid solution (Ar, 18°C, stirring 100 rpm): 20 kHz, Pac= 20 W; 100 kHz, Pac= 20 W ;
200 kHz, Pac= 20 W; 345 kHz Pac= 40 W; 1 MHz, Pac= 40 W. ... 100
Table IV-3 Estimated roughness for Mg surfaces treated during 1 hour in 0.01 M oxalic acid solutions (Ar, 18°C, stirring 100 rpm): silent condition; 20 kHz, Pac= 20 W, no stirring; 100 kHz, Pac= 20 W; 200
kHz, Pac= 20 W; 345 kHz Pac= 40 W; 1 MHz Pac= 40 W. ... 101
Table IV-4 Weight loss of Mg surfaces treated for 1 hour in 0.01 M oxalic acid solution (Ar, 18°C): under silent condition; at 20 kHz, Pac= 20 W; at 200 kHz, Pac= 20 W, stirring; at 1 MHz Pac= 40 W,
xxiv
Table IV-5 Water contact angles obtained for Mg surfaces treated at 200 kHz (Pac= 20 W, stirring, Ar,
18°C) for 1 hour in water, 0.01 M sodium oxalate solution and 0.001 M oxalic acid solution. ... 104 Table IV-6 Dissolution rate and H2 maximal formation rate of Mg surfaces treated at 200 kHz (Pac= 20
W, stirring, Ar, 18°C) for 1 hour in water, 0.01 M sodium oxalate solution, 0.001 M and 0.01 M oxalic acid solutions. ... 109 Table IV-7 Chemical composition of a native Mg-Zr surface by EDX analysis. ... 117 Table IV-8 Chemical composition of Mg-Zr surface treated at 345 kHz, Pac= 40 W for 1 hour in 0.01
1
Introduction
The natural uranium graphite-gas (UNGG) reactors were the first generation of nuclear reactors developed in France. They used graphite moderator, gas (air or carbon dioxide) coolant and natural uranium metal as fuel. Since 1956, in total 9 UNGG reactors have been built and put into operation in France. Until the last unit at Bugey was decommissioned in 1994, a large amount of nuclear wastes of various kinds, including spent fuel, graphite bricks, radioactive gases and metal structural wastes, have been generated during commission and dismantling processes of UNGG reactors. Among the radioactive metal wastes, large quantities of magnesium alloy, which has been used as fuel cladding tubes and plugs, are temporarily stored at La Hague and Marcoule, and wait for conditioning and transportation to long-term disposals. The large amounts of Mg cladding wastes take a huge volume of storage and present a risk of radioactive leakage, as well as great costs of conditioning and disposal.[1]
Moreover, as an active metal, Mg is easily corroded and can produce hydrogen gas, which can result in the risk of radioactive material leakage during long-term storage of these UNGG cladding wastes.[2] As
a result, it is necessary to reduce the volume of these cladding wastes by removing radioactive contaminants on their surfaces, thereby reducing their radiation level to a lower storage category or even to allow them to be unconditionally released or reused. One of the potentially efficient approaches for the decontamination of the UNGG Mg alloy cladding wastes is ultrasonic cleaning.
Ultrasound has been applied as a cleaning tool since the 1950s. Compared to other conventional cleaning methods, ultrasonic cleaning has the advantages of not being limited by complex shapes, fewer process stages, use of less or non-hazardous aqueous solutions, a wider range of substrate surfaces to be treated and milder operating conditions.[3] In fact, it is not the ultrasound wave itself, but the acoustic cavitation
phenomenon which interacts with treated surfaces in a liquid medium and removes contaminants. Acoustic cavitation results from the nucleation, growth and rapid implosive collapse of gas and vapor filled microbubbles in liquids exposed to an ultrasonic wave. In the vicinity of a solid boundary, the bubble collapse produces violent shock waves and micro-jets directed towards the substrate surface. Thanks to the combination of the in-situ generation of chemically active species with the enhancement of mass transfer by acoustic streaming on the treated surface, an efficient cleaning by power ultrasound can be achieved. However, though ultrasonic cleaning has been widely studied and used in various fields, the behavior of cavitation in liquid in the presence of a solid boundary is still unclear. Meanwhile, the impacts of cavitation on metal surfaces and the ultrasonic cleaning efficiency on radioactive materials are of great interest in material science and for the nuclear industry.
2
The first chapter is a literature review. In this part the general principles of acoustic cavitation, including sonochemistry and sonoluminescence, and some application examples of ultrasonic modification and cleaning of solid surfaces are reported. Besides, the conceptions of UNGG reactors and current state of storage of Mg cladding wastes in France, as well as some examples of ultrasonic decontamination are described later.
The second chapter is devoted to the description of the experimental techniques and methods. The sample surfaces and experimental set-ups used in this study are described in detail, as well as the corresponding characterization tools.
Chapter III aims to determine the effect of ultrasonic frequency on sonochemical activity and sonoluminescence intensity, especially in the range of the less studied intermediate frequency (100 kHz). It also allows to identify cavitation bubble activity and distribution in the presence of a solid surface in liquid, including the cavitation behavior at different distances to the surface and in different acoustic standing wave fields induced by the reflection on the surface. This study is accomplished by chemical measurements (H2O2 yields and sonochemiluminescence of luminol) and spectroscopic probes
(multibubble sonoluminescence of OH*, NH*, Na* and continuum).
Investigations on how sonication affects extended Mg and Mg-Zr alloy surfaces are presented in chapter IV. The evolution of surfaces treated at different ultrasonic frequencies in different solutions is characterized by surface roughness, morphology, dissolution rate, hydrogen generation rate and evolution of chemical composition. The formation of an original and unprecedented golf-ball shape microstructure on Mg based sample surfaces sonicated at ultrasonic frequencies in the range of 100 to 345 kHz is discussed in detail. The way it affects surface properties is studied via roughness and wettability measurements.
Chapter V is dedicated to the assessment of the efficiency of ultrasonic decontamination of metal surfaces contaminated by natural uranium to simulate real UNGG cladding materials. It considers samples of Mg, Mg-Zr alloy, non-irradiated UNGG cladding fragments and stainless steel.
Finally, general conclusions and perspectives for a future work are given.
This study has been carried out at Marcoule Institute for Separation Chemistry (ICSM) and was supported by the Division of Nuclear Energy (DEN) of the French Alternative Energies and Atomic Energy Commission (CEA).
3
5
I.1
Ultrasound and sonochemistry
I.1.1 Ultrasound
Ultrasound is the inaudible sound wave with frequency above 16 kHz, higher than the upper limit of human hearing range. In nature, animals like bats and dolphins, echolocate quarries or obstacles by producing ultrasound. For human beings, the first research about the effects of ultrasound or cavitation was done by Thornycroft and Barnaby, when they were trying to explain the observation of submarine propeller erosion in 1895.[3] And the first purposeful application of ultrasound was developed by
Langevin in 1917. Again for submarine, Langevin had designed an underwater detector, which can emit ultrasonic waves in water and collect echoes form certain objects to identify their distances. Such device is now well known under the name of sonar.[3-5]
There are several basic properties of ultrasound: frequency 𝑓 and acoustic power 𝑃𝑎𝑐, the latter includes
acoustic power density 𝑃𝑎𝑐,𝑉 and power intensity 𝐼𝑎𝑐.
I.1.1.1
Ultrasonic frequency
The ultrasound frequency 𝑓 (Hz) is given by:
𝑓 = 𝑐 𝜆⁄ (I-1)
Where 𝑐 (m·s-1) is the ultrasound wave velocity in a considered medium and λ (m) is the wavelength of
the ultrasound.
Figure I-1 Ultrasound frequency category.[3]
According to its frequency, ultrasound can be divided into three frequency domains, namely power ultrasound (16 – 100 kHz), high frequency ultrasound (100 kHz or sometimes 200 kHz – 1 MHz), and diagnostic ultrasound (> 1 MHz), as presented in Figure I-1. Power ultrasound and high frequency ultrasound are widely applied in ultrasonic cleaning and sonochemistry, where chemical and physical effects caused by acoustic cavitation bubbles are desired.[6]
6
I.1.1.2
Acoustic power
The absorbed acoustic power 𝑃𝑎𝑐 (W) is the power transmitted to the medium by ultrasound. Normally
for better controlling and comparing between different experimental conditions, parameters such as acoustic power density 𝑃𝑎𝑐,𝑉 (W·mL-1) and acoustic power intensity 𝐼𝑎𝑐 (W·cm-2) are used.
𝑃𝑎𝑐,𝑉 =
𝑃𝑎𝑐
𝑉 (I-2)
Where 𝑉 (mL) is the volume of irradiated liquid.
𝐼𝑎𝑐 =
𝑃𝑎𝑐
𝑆 (I-3)
Where 𝑆 (cm2) is the area normal to the direction of ultrasonic wave propagation, e.g. for a horn type
ultrasonic transducer tip, 𝑆 is the surface of the probe tip.
Based on ultrasonic intensity, ultrasound can also be classified into power ultrasound and diagnostic ultrasound. The acoustic intensity of power ultrasound should be higher than a certain intensity to produce violent acoustic cavitation collapse, which is known as the Blake threshold.[7] The Blake
threshold is closely related to ultrasonic frequency, for example: 0.49 W·cm-2 at 20 kHz, 0.88 W·cm-2
at 140 kHz and 3 W·cm-2 at 1 MHz.[8] Thus for non-destructive medical imaging at a frequency over 1
MHz, acoustic power intensity is limited to 1 W·cm-2 or less to avoid cavitation.
By changing the ultrasonic frequency or acoustic power, the effect of ultrasound can be completely different. Fundamentally, the ultrasonic effect difference arises from changes in the behavior of acoustic cavitation.
I.1.2 Acoustic cavitation
Acoustic cavitation is the process of the formation, growth and implosive collapse of bubbles in liquids irradiated by ultrasound, accompanied by a series of physical and chemical phenomena and effects: sonoluminescence, sonochemiluminescence, generation of excited species and radicals, formation of H2O2, shock waves, microjets, micro-streaming and etc.[9]
I.1.2.1
Cavitation mechanism
When a liquid is exposed to ultrasound, alternating rarefaction and compression cycles are propagated by the ultrasonic waves, as shown in Figure I-2. In compression cycles, liquid molecules are pressed together by a locally positive force. In rarefaction phase, it is in the opposite that a negative force draws the liquid molecules apart. In fact, this force comes from the difference between ambient pressure in liquid and acoustic pressure from ultrasonic wave. And in rarefaction phase, if the local acoustic pressure
7
is larger than ambient pressure, a negative force can be produced. When this negative force exceeds the liquid tensile strength in the rarefaction phase, tiny gas or vapor filled bubbles appear. For a pure degassed liquid, its tensile strength is too strong to easily form bubbles. However, in real situations, there are usually inhomogeneities such as dissolved gases in liquid, which can reduce the tensile strength and play as nuclei of bubbles.[6, 10]
Figure I-2 Acoustic cavitation generation and collapse.[11]
These bubbles continue to expand in rarefaction phase, until their sizes arrive to the maximum when the pressure on the bubble wall is no more negative. If the bubble oscillates between rarefaction and compression phases for several cycles around an equilibrium radius, this process is called stable cavitation. Since there is no significant change in bubble size, stable cavitation does not strongly involve in physical or chemical effects of ultrasound. However, if the bubble exists for only a few cycles and grows rapidly to a maximum size (tens or hundreds times the initial bubble diameter) with a following violent implosion, transient cavitation happens. Extreme temperature and pressure are created during the implosion in a transient cavitation bubble, which leads to obvious physical and chemical effects: sonoluminescence light emission and sonochemical reactions. Besides, stable cavitation can resolve itself into transient cavitation. After the collapse of transient cavitation bubbles, the generated daughter bubbles can also perform as nuclei of stable cavitation. There are some bubbles exhibiting both stable and transient cavitation characteristics, such as bubbles with a long lifetime as well as strong physical/chemical effects.[9, 10, 12]
I.1.2.2
Cavitation mathematical model
Rayleigh’s mathematical formulation was the first basic model formulated for the collapse of an empty cavitation bubble.[13] If one assumes that the cavity is an adiabatic bubble filled with an ideal gas,
8 𝑅𝑅̈ +3 2𝑅̇ 2=(𝑃0+ 2𝜎 𝑅0) ( 𝑅0 𝑅 ) 3𝛾 −2𝜎𝑅 −4𝜇𝑅̇𝑅 − 𝑝∞ 𝜌 (I-4)
Where 𝑅 is the radius of the cavitation bubble, one and two dots are the first and second order time derivatives of bubble radius, 𝑅0 is the bubble radius at equilibrium, 𝑃0 is the hydrostatic (ambient)
pressure, 𝑝∞ is the liquid pressure in the bulk of liquid, 𝛾 is the specific heat ratio of the gas in bubble,
𝜎 is the surface tension, 𝜇 is the liquid viscosity and 𝜌 is the density of the liquid.
However, due to the complexity and instability of the collapse of bubbles (especially in multibubble systems), there were more dynamical equations and numerical analysis developed from Rayleigh-Plesset equation.[14]
I.1.2.3
Hot spot theory
A widely accepted theory to explain most cavitation effects is the hot spot theory.[9, 12, 15] According to
the first law of thermodynamics:
∆𝑈 = 𝑄 − 𝑊 (I-5)
With ∆𝑈 the change in internal energy of a closed system, 𝑄 the heat transferred to the system and 𝑊 the work done by the system
When compressing a gas:
𝑊 = 𝑝∆𝑉 (I-6)
Where 𝑝 is the pressure and ∆𝑉 is the volume change (negative). Compression introduces energy to the system. In a very simple approximation, one may consider an adiabatic system during the bubble violent collapse, because the temperature increase of the gas inside a bubble is too fast for an important heat transport to happen (𝑄 ≅ 0). A localized transient hot spot is created in the bubble, with an average gas temperature and pressure up to 5,000 K and 500 atm, and a fast cooling rate of 109 to 1010 K·s-1.[16-18]
This hot spot is believed to be the origin of sonoluminescence and sonochemistry.[12, 19]
I.1.2.4
Non-equilibrium model
It was recently shown that the hot spot theory is not sufficient to take into account the complex conditions in cavitation: quasi-adiabatic bubble compression, water vapor at the bubble wall, intrabubble chemical reactions and gas molecules ionization. Therefore, a non-equilibrium model has been developed. As presented in Table I-1, spectroscopic studies of OH (A2Σ+-X2Π), NH (A3Π-X3Σ-) and C
2
Swan bands emissions from multibubble system in aqueous solutions proved evidence for non-equilibrium plasma formation inside the collapsing bubbles.[20, 21] Such non-equilibrium plasma cannot
9
be characterized by a single gas temperature, but by multiple temperatures of different particles and degrees of freedom in the plasma: electron (Te), vibrational (Tv), rotational (Tr) and translational (T0)
temperatures. These temperatures in a plasma far from thermodynamic equilibrium follow the inequality
Te > Tv > Tr ≈ T0.[22]
Table I-1 Rovibronic temperatures estimated from the simulations of molecular emissions in
sonoluminescence spectra from aqueous solutions.[18, 21, 23]
Solution Gas Ultrasonic frequency (kHz) Transition Tv (K) Tr (K) Reference Benzene 10-3 M Ar 20 C2 Swan (d3Π g– a3Π u) 4300 ± 200 - [18] tert-butanol 0.05-0.4 M Ar 20 C2 Swan (d3Π g– a3Π u) 6300 ± 1000 4800 ± 1000 [23] tert-butanol 1·10-3 – 5·10-3 M Ar 204 / 362 / 613 C2 Swan (d3Π g– a3Π u) 5800 / 8000 / 5000 (± 1000) 5800 / 4000 / 4000 (± 1000) tert-butanol 0.12 M Xe 20 C2 Swan (d3Π g– a3Π u) 14000 ± 1000 2500 ± 1000 Ammonia 0.1 M Ar 20 OH (A2Σ+ -X2Π) 9000 ± 1000 5000 ± 500 [21] NH (A3 Π-X3Σ-) 7000 ± 1000 4000 ± 500 Ammonia 0.1 M Ar 359 OH (A2Σ+ -X2Π) 13000 ± 2000 6000 ± 1000 NH (A3 Π-X3Σ-) 10000 ± 1000 2200 ± 500
10
I.1.2.5
Microjet
As presented in Figure I-3, when acoustic cavitation occurs close to a solid boundary, a micro-jet is formed towards the wall.[14, 24] It also happen when neighbour bubbles are close enough to each other.[19, 25]
Figure I-3 Micro-jet formation.[26]
To explain this process, the concept of impulse is significant. Impulse 𝐼 is the inertia of the liquid moving towards a solid boundary close to the cavitation bubbles:[14]
𝐼 = 𝑢𝑀 (I-7)
Where 𝑢 is the speed of the centre of the bubble perpendicular to the substrate surface and 𝑀 is the added mass of the bubble. This mass is based on the assumption that some liquid is carried by the moving bubble, thus leading to a virtual addition of the bubble mass. 𝑀 can be expressed as:
𝑀 = 𝑐𝜌𝑉 (I-8)
Where 𝑐 is the added mass coefficient, 𝜌 is the liquid density and 𝑉 is the volume of the bubble. So the impulse can also be expressed as:
I = ucρV (I-9)
In the absence of any external force, the impulse remains nearly constant with the bubble approaching to the substrate. With the sharp shrinking of the bubble volume V during collapse, the speed of the bubble 𝑢 increases dramatically. When the velocity 𝑢 gets too large that the spherical bubble cannot undertake the large external pressure difference from the high velocity, a liquid inrush enters the bubble from the side away of the substrate and pierces the other side of the bubble, targeting to the surface.[24, 27] Such so called micro-jets can achieve a velocity of several hundreds meters per second [28].
I.1.2.6
Shock wave
Shock wave is another strong acoustic phenomenon occurring during the collapse of cavitation bubbles. Extremely rapid compression and the enormous pressure inside bubble at the collapse moment produce a shock wave faster than the sound velocity in liquid.[8] Figure I-4 shows the propagation of a shock
11
wave from a trapped sonoluminescing bubble driven by low frequency ultrasound. The tiny black spot in the center is the acoustic bubble and the ring is the shock wave.[29]
Figure I-4 Shock wave from a trapped sonoluminescing bubble produced by ultrasound at 21.4 kHz,
pressure amplitude of 132 kPa, frame interval 30 ns.[29]
The high velocity (1,000 to 4,000 m s-1) and pressure (GPa) of the shock wave make it destructive,
though it is a very localized impact due to the fast attenuation of wave energy in the medium.[30, 31]
For both micro-jet and shock wave occuring in the vicinity of a solid boundary, an important parameter to be considered is the stand-off distance γ:[32, 33]
γ = 𝐿 𝑅𝑚𝑎𝑥
(I-10)
Where 𝐿 is the distance between solid substrate and bubble center, and 𝑅𝑚𝑎𝑥 is the bubble radius at its
maximum expansion.
Obvious effects from micro-jets and shock waves on a solid surface can be observed only with a stand-off distance γ ≤ 2 .[34, 35] These two phenomena are considered to be the principle mechanisms
responsible for surface damage, modification and cleaning.
I.1.2.7
Acoustic streaming
In an intense ultrasonic field, the acoustic wave propagation is attenuated due to the liquid viscosity.[36]
This attenuation produces a gradient of radiation pressure in liquid, which generates a steady motion of fluid, hence an acoustic streaming.[8, 36] Two different types of acoustic streaming exist: i) Eckart
streaming in the bulk of a liquid, which accelerates fluid in the direction of acoustic traveling wave propagation; ii) vortex-like Rayleigh streaming at the solid boundary due to the local viscous stress.[8, 37]
Acoustic streaming can significantly enhance convective heat exchange in an irradiated liquid and accelerate the mass transfer in a heterogeneous system, thus increases sonochemical reaction rate and ultrasonic cleaning efficiency.[38, 39]
When near a small bubble or particle, a similar but localized fluid motion caused by viscous dissipation happens at a small length scale, named microstreaming.[8] It is a typically circulation flow with a velocity
12
of several millimeters per second.[40] Microstreaming can also change the processes of heat and mass
diffusion of cavitation bubbles, thus alter the phenomenon of sonochemistry and sonoluminescence.[40]
I.1.3 Sonochemistry
In general, sonochemistry is the use of acoustic cavitation to achieve chemical reactions or chemical process. From a historical point of view, Richards and Loomis first reported the chemical effects of power ultrasound in 1927.[41] Sonochemistry is different from the other conventional chemical processes,
due to its special cavitation bubble collapse: extreme local temperature and pressure with exceptional cooling rate. By applying ultrasound, high energy chemical interactions can be generated in mild conditions. The applications of sonochemistry are diverse in the domains of chemical synthesis, catalysis, material science (nanomaterial and biomaterial) etc. Depending on the reaction environment, ultrasonic chemical effects can be categorized into homogeneous sonochemistry of liquid systems and heterogeneous sonochemistry at liquid-liquid or liquid-solid interfaces.[3, 4, 9, 42, 43]
I.1.3.1
Homogeneous sonochemistry
The use of ultrasound in aqueous solutions results in the production of different intermediates such as H·, HO·, HO
2· and of primary products such as H2 and H2O2. Reactions (I-11) to (I-18) present the
sonolysis of water in the presence of argon and oxygen:[4, 44]
H2O ))) → H⋅+ HO⋅ (I-11) 𝐻⋅+ 𝐻𝑂⋅ → 𝐻2𝑂 (I-12) 2𝐻⋅→ 𝐻2 (I-13) 2 𝐻𝑂⋅→ 𝐻2𝑂2 (I-14) 𝐻⋅+ 𝑂2 → 𝐻𝑂2⋅ (I-15) 𝐻⋅+ 𝐻𝑂2⋅ → 𝐻2𝑂2 (I-16) 2𝐻𝑂2⋅→ 𝐻2𝑂2+ 𝑂2 (I-17) 𝐻2𝑂 + 𝐻𝑂⋅ → 𝐻2𝑂2+ 𝐻⋅ (I-18)
If the cavitation energy is high enough, for example in the case of Ar saturated water exposed to high frequency ultrasound, the dissociation of diatomic gas or volatile molecules, such as oxygen and nitrogen, can happen at bubble collapse:[45, 46]
13 𝑂2 ))) → 2𝑂⋅ (I-19) 𝑁2 ))) → 2𝑁⋅ (I-20)
The produced oxygen and nitrogen radicals can react with radicals and molecules:
𝑂⋅+ 𝐻2𝑂 → 2𝐻𝑂⋅ (I-21)
𝑂⋅+ 𝐻⋅ → 𝐻𝑂⋅ (I-22)
𝑁⋅+ 𝐻⋅ → 𝑁𝐻⋅ (I-23)
𝑁⋅+ 𝐻𝑂⋅ → 𝑁𝑂𝐻⋅ (I-24)
The key of sonochemical reactions is the radicals formed during sonolysis of water. For example, 𝐻𝑂⋅ and 𝐻2𝑂2 are strong oxidants which can react with solutes in the liquid surrounding the cavitation
bubbles. Meantime, it is found that an artificial introduction of cavitation nuclei is important for an efficient homogeneous sonochemical process.[9]
I.1.3.2
Heterogeneous sonochemistry
Thanks to the mechanical effects of cavitation bubble collapse, sonochemistry in heterogeneous systems is more efficient than in homogeneous systems and has been widely studied and applied for decades. Micro-jets, shock waves and micro-streaming strongly enhance the mass transfer and significantly accelerate the chemical reactions in the heterogeneous systems.[4, 9, 47, 48]
In liquid-liquid system, power ultrasound can form very fine emulsions, which is applied to increase the combustion efficiency of petrol, and decrease the so-produced pollution as well.[49]
At liquid-solid interfaces, the erosion and deformation from micro-jets and shock waves is obvious.[50]
This property is widely used for ultrasonic cleaning and decontamination.[3, 51] Other studies and
applications in the fields of solid catalysts, material crystallization and electrochemistry also present the enhancements and benefits of ultrasound in chemical process.[52-55]
More detail investigations and applications of power ultrasound in heterogeneous system will be discussed later.
I.1.4 Sonoluminescence
The light emitted from liquid irradiated by ultrasound is called sonoluminescence (SL) or sonochemiluminescence (SCL). The difference between SL and SCL is the origin of light emission: SL is light emitted directly by the acoustic cavitation bubbles, as shown in Figure I-5, while SCL is
14
chemiluminescence from chemical reactions, e.g. luminol with oxidants (𝐻𝑂⋅and 𝐻
2𝑂2) created by
cavitation.[8] Cavitation bubbles can have both activities of sonochemistry and SL, but it is believed that
SL bubbles are larger than sonochemical bubbles at certain ultrasonic frequency and power conditions.[56, 57]
Figure I-5 Sonoluminescence generation from a cavitation bubble.[58]
SL was first observed by Frenzel and Schultes in 1934.[9] The mechanism of SL is still unclear, though
different theories tried to explain it.[31, 42] One of the hypotheses is that the origin of SL is the
chemiluminescence from the plasma inside collapsing bubbles, which is similar to a flame plasma.[12]
Such plasma is created during the compression cycle or the implosion moment, when the intrabubble gas temperature is extremely high. At such high temperature, gas and volatile molecules insides bubbles can be degraded and excited.[17, 18] However, recent studies revealed non-equilibrium plasma as SL
source in cavitation, which indicates multiple temperatures characterization of SL emissions: lifetime of this plasma is not long enough to allow equilibration.[22]
There are two types of SL: multibubble sonoluminescence (MBSL) and single-bubble sonoluminescence (SBSL).[8, 9] In general conditions of liquid exposed to ultrasound, MBSL can be
observed with large numbers of interacting cavitation bubbles and bubble clusters.[59, 60] SBSL is from a
specially produced stable cavitation bubble in a standing wave of an ultrasonically irradiated and degassed liquid.[61] Both MBSL and SBSL spectra in water present continuum emissions, which are
originated of Bremsstrahlung (electron-atom or electron-ion Bremsstrahlung) and radiative recombination (electron-ion or 𝐻⋅-𝐻𝑂⋅radical recombination).[8, 62] For MBSL in water, a peak around
310 nm is present in spectra from excited radical of 𝐻𝑂⋅.[9, 62, 63] Emission lines of some nonvolatile
metal ions such as Na and K were also reported in MBSL spectra in aqueous solutions of NaCl and KCl respectively (see Figure I-6).[62, 64, 65] But for SBSL, only in some typical solutions such as sulfuric acid
(Ar, Xe dissolved) or at very low acoustic pressure in water, emission lines of gas molecules like Ar, Xe or 𝐻𝑂⋅ radicals can be observed.[8, 66]
![Figure I-6 Comparison of MBSL and SBSL spectra in 1 M NaCl solution. [62]](https://thumb-eu.123doks.com/thumbv2/123doknet/12854615.368158/44.892.208.684.141.480/figure-i-comparison-mbsl-sbsl-spectra-nacl-solution.webp)


![Figure I-30 Underwater ultrasonic generators in decontamination tanks at La Hague: a) type AD1-BDH and b) type R7 for dismantling of vitrification plant [courtesy of Sinaptec]](https://thumb-eu.123doks.com/thumbv2/123doknet/12854615.368158/78.892.236.661.380.839/underwater-ultrasonic-generators-decontamination-dismantling-vitrification-courtesy-sinaptec.webp)


![[PDF] Méthodologie de Programmation avec Objective CAML | cours informatique](data:image/gif;base64,R0lGODlhAQABAIAAAP///wAAACH5BAEAAAAALAAAAAABAAEAAAICRAEAOw==)