An Analysis of Baseball Pitch Data: Quantifying the Effect of Speed, Location and Movement on a Batter's Chances of Getting a Hit
by Helen Zelman
Submitted to the Department of Mechanical Engineering in Partial Fulfillment of the Requirements for the Degree of
Bachelor of Science at the
Massachusetts Institute of Technology June 2006
C 2006 Helen Zelman
The author hereby grants to MIT permission to reproduce and to distribute publicly paper and electronic copies of this thesis document in whole or in part.
ARCHNES
Signature
of Author ...
...
... ...Department of Mechanical Engineering May 12, 2006
Certified
By
...
...
...
' Ernest G. Cravalho Professor of Mechanical Engineering Thesis Supervisor
Accepted
By ...
...
....
John H. Lienhard V Professor of Mechanical Engineering Chairman, Undergraduate Thesis Committee
1
MAWCHUSETTS INS~TM OF TECHNOLOGY
An Analysis of Baseball Pitch Data: Quantifying the Effect of
Speed, Location and Movement on a Batter's Chances of
Getting a Hit
By Helen Zelman
Submitted to the Department of Mechanical Engineering on May 12, 2006 in partial fulfillment of the requirements for the
Degree of Bachelor of Science in Mechanical Engineering
Abstract
Advances in high-speed camera technology have made it possible to measure the trajectory of a baseball in flight. These trajectories allow for analysis of the
characteristics make a pitch difficult to hit. The goal of this paper is to examine the effect of speed, location and movement on hitting statistics such as batting average. The results of this examination support conventional baseball wisdom. Fastballs and pitches in the strike zone are more likely to result in hits than off-speed pitches and pitches outside of the strike zone. Also, additional speed and movement on a pitch decreases the batter's chances of getting a hit. Finally, a preliminary model was created to observe the combined effects of speed, location and movement.
Thesis Supervisor: Ernest G. Cravalho Title: Professor of Mechanical Engineering
--Table of Contents
Title Page 1 Abstract 2Table of Contents
3
List of Figures
5
List of Tables
6
1 Introduction 7 1.1 Data Acquisition ... 7 2 Pitch Speed 9 2.1 2.2 2.3 2.4 The Effect of Pitch Speed on Batting Average ... 9The Effect of Pitch Speed on Batting Average Over 87 mph ... 10
The Effect of Pitch Speed on Fastballs and Non-Fastballs ... 12
The Effect of Change of Speed on Batting Average ... 15
3 Location 17 3.1 Breaking Down the Strike Zone ... 18...18
3.2 Comparing Strikes and Ball ... ... 19
4 Movement 21 4.1 Comparing Movement and Speed ... ... ... 21
4.2 The Effect of Net Movement on Batting Average ... ...23
5 Putting It All Together 25
6
Conclusion
27
6.1
Further
Study
...
...
... 27
7 References 28
List of Figures
Figure
Page
Figure 2.1 Batting Average Vs. Pitch Speed (All Pitches) 10 Figure 2.2 Batting Average Vs. Pitch Speed (>87 mph) 11
Figure 2.3 Pitch Speed Distribution 12
Figure 2.4 Batting Average Vs. Pitch Speed (Fastballs Only) 13 Figure 2.5 Batting Average Vs. Pitch Speed (Non-Fastballs) 14
Figure 2.6 Batting Average Vs. Change of Speed 16
Figure 3.1 The Strike Zone 17
Figure 3.2 Batting Averages in the Strike Zone 18
Figure 3.3 Slugging Percentages in the Strike Zone 19
Figure 4.1 Horizontal Movement Vs. Pitch Speed 22
Figure 4.2 Vertical Movement Vs. Pitch Speed 22
List of Tables
Table
Page
Table 1.1 Data for an Example Pitch 8
Table 2.1 Batting Statistics for Fastballs and Non-Fastballs 15
Table 3.1 Batting Statistics for Strikes and Balls 20
1. Introduction
"Hitting is timing. Pitching is upsetting timing" - Warren Spahn
Warren Spahn certainly knew a lot about upsetting hitters' timing. In 21 Major League seasons, Spahn won 363 games, the most ever by a left-hander. He was named to the National League All-Star team 14 times. In 1957, he led the Milwaukee Braves to a World Championship while winning the Cy Young Award. In 1965, his number #21 was retired by the Braves organization. Spahn's variety of pitches in his arsenal was almost
as extensive as his Hall of Fame credentials. When he came up with the Boston Braves in 1942, he featured a fastball, curveball, changeup and sinker. Later on in his career, as his fastball started to fade, he added a screwball, a slider and even a knuckleball.
While each Major League pitcher throws a different combination of pitches, all pitchers have the same goal of upsetting hitters timing. To do this they vary the speed, movement and location of each pitch. With currently available high-speed camera technology, it is possible to measure the trajectory of a baseball in flight. Pitch tracking systems have already been used to evaluate umpires abilities to call balls and strikes, but this same data can be used to analyze the effectiveness of a pitch. By looking at the
speed, movement and location of the nearly 50,000 pitches thrown during the 2004 and 2005 seasons at Fenway Park, we can begin to discover what makes some pitches nearly unhittable, while others land on the other side of the Green Monster.
1.1 Data Acquisition
The data used in this thesis has come from Questec's Umpire Information System at Fenway Park during the 2004 and 2005 baseball seasons. "The UIS uses QuesTec's proprietary measurement technology that analyzes video from cameras mounted in the rafters of each ballpark to precisely locate the ball throughout the pitch corridor."' The system uses two cameras in the rafters to triangulate the 3-dimensional trajectory, and
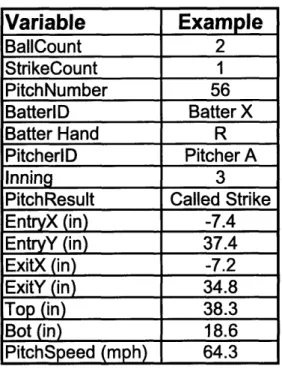
two cameras in the dugouts to reference the top and bottom of the strike zone. Table 1.1 below describes the data made available for this analysis.
Table 1.1: Data for an Example Pitch
Variable Example BallCount 2 StrikeCount 1 PitchNumber 56 BatterlD Batter X Batter Hand R PitcherlD Pitcher A Inning 3
PitchResult Called Strike
EntryX (in) -7.4 EntryY (in) 37.4 ExitX (in) -7.2 ExitY (in) 34.8 Top (in) 38.3 Bot (in) 18.6 PitchSpeed (mph) 64.3
In the example from the table, the 5 6 th pitch of the game was thrown by Pitcher A
to Batter X (a right-handed batter) on a 2-1 count. The result of this pitch was a called strike. Entry X and Exit X refer to the horizontal point at which the pitch entered and exited the strike zone. A value of zero would indicate that the pitch was located in the center of the plate. From the pitcher's view, negative values indicate that the pitch is to the right of the center and positive values indicate that the pitch is to the left of center. Entry Y and Exit Y refer to the vertical point at which the pitch entered and exited the
strike zone. This distance indicates the height of the pitch from the ground. The top and bottom of the strike zone are uniquely calculated for each batter and also indicate
2. Pitch Speed
"One of the bestfastballs I'd ever thrown was hitfor a home run [by the Braves' Joe Torre]. I learned the hard way that it would be impossible to get by in the
major leagues with just afastball, no matter how hard it was thrown" -- Nolan Ryan
With all other factors being equal (movement and location), additional speed on a fastball most likely decreases the batter's ability to get a hit. Regardless of a pitcher's
intentions, increasing the speed of a pitch decreases the time a batter has to react.
However, pitchers should not take the mound with the mentality to throw the ball as hard as they can. Increasing speed generally leads to less movement and decreases the
pitcher's ability to control the location of the pitch. While speed often comes at the sacrifice of other desirable features of a pitch, it is not necessarily desirable for all types of pitches.
Consider the change-up. Pitchers often describe a change-up as a difficult pitch to learn. A pitcher who throws a good change-up tries to use the exact same pitching
motion as he does to throw a fastball. This will upset a hitter's timing and will generally cause him to swing to early. What makes this pitch successful is the difference in speed from the pitcher's fastball. For example, a pitcher who throws a 94 mph fastball might try to throw a change-up that is 82 mph. If his change-up was only a few miles-per-hour slower than his fastball, he will probably find this to be a very ineffective pitch.
Therefore, speed is not necessarily desired on all types of pitches.
2.1 The Effect of Pitch Speed on Batting Average
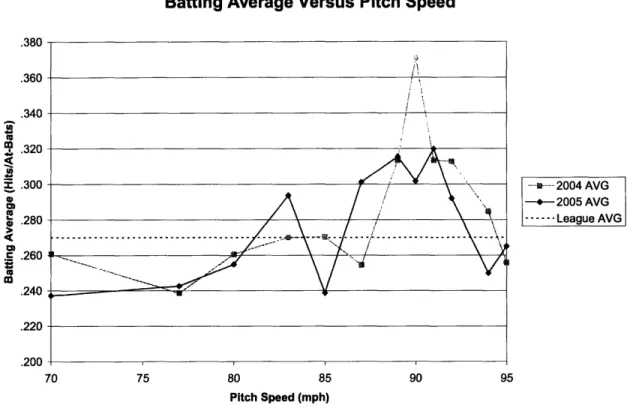
The first study done to measure the effect of pitch speed on hitting ability included all pitches from each of the 2004 and 2005 seasons. Pitch speed was binned into 12 intervals of 2000 pitches. Only pitches that resulted in at-bats (hits or outs) were used to calculate batting average. The results of this study are shown in figure 2.1 below.
Batting Average Versus Pitch Speed .380 .360 .340 m, .320 I .300 2 .280 .E .260 m .240 .220 .200 --- 2004 AVG -.- 2005 AVG --- League AVG 70 75 80 85 90 95 Pitch Speed (mph)
Figure 2.1: Batting Averages Versus Pitch Speed for All Pitches
While this graph does not show a relationship between batting average and pitch speed over the full range of pitches, it does provide interesting results. At speeds at and below 85 mph, batting averages tend to be significantly below league average, but at speeds above 85 mph, batting averages tend to be above league average. In fact, at speeds within a few mph of 90, batters remarkably hit over .300. This implies that fastballs are simply easier to hit than off-speed pitches. However, batting average appears to peak at 90 mph and decrease at speeds above this threshold. This may imply that batting ability decreases with additional speed on fastballs.
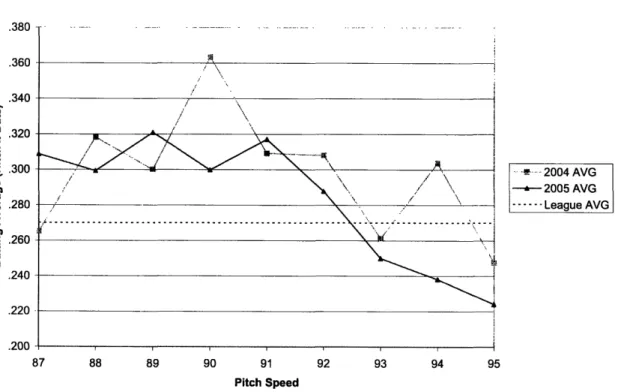
2.2 The Effect of Pitch Speed on Batting Average (Pitches Over 87 mph)
The first attempt to distinguish fastballs from other types of pitches involved declaring 87 mph to be an arbitrary cut-off. This is not the ideal method, because some fastballs only reach the low-to-mid 80s and some off-speed pitches begin to creep up to
---the low 90s. Pitch speed was binned in 1 mph intervals and was capped at 95 mph because there weren't a significant number of at-bats above that speed. Only pitches that
resulted in at-bats (hits or outs) were used to calculate batting average. The results of this study are shown in figure 2.2 below.
Batting Average Versus Pitch Speed
.380 .360 .340 m .320 I .300 f .280 ._ .260 m .240 .220 .200 .... ---- 2004 AVG - 2005 AVG --.- - League AVG 87 88 89 90 91 92 93 94 95 Pitch Speed
Figure 2.2: Batting Average Versus Pitch Speed for Pitches Over 87 mph
The results from the above graph are mixed. The data from 2004 appeared to show very little correlation (R2 = 0.1022) between batting average and pitch speed.
However, the data from 2005 showed a strong correlation (R2 = 0.731). The 2005 model
predicted that 1 extra mph on the fastball decreased batting average by roughly 11 points. The discrepancies are most likely due to sample size, because there were a different number of at-bats for each speed. Interestingly, the peak batting average at 90 mph in 2005 occurred at the most frequently observed speed. Perhaps, hitters had timed the 90 mph fastball well because that is the speed that they were most used to hitting.
2.3 The Effect of Pitch Speed on Fastballs and Non-Fastballs
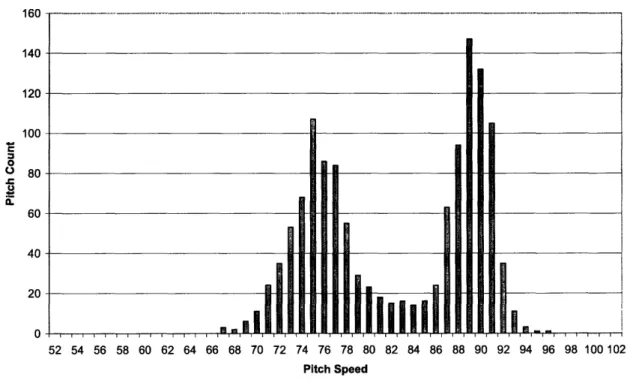
A better model for distinguishing fastballs from other types of pitches would take in to account individual pitchers. For a specific pitcher, a pitch speed distribution can be generated. This bar graph will show how often a pitcher throws at a specific speed. From these graphs, you can begin to get an idea of the different types of pitches a particular pitcher throws. Consider the 1281 pitches observed from Pitcher A in 2004:
Pitcher A's 2004 Pitch Speed Distribution
160 140 120 M 0 0M 2 K 100 80 60 40 20 0 52 54 56 58 60 62 64 66 68 70 72 74 76 78 80 82 84 86 88 90 92 94 96 98 100 102 Pitch Speed
According to his scouting report on ESPN.com, Pitcher A throws four different pitches. He throws a 2-seam and 4-seam fastball that goes from 88-89 mph and up to 92 mph at times. His change-up has been clocked at 76-79 mph and his curve is generally in the 73-78 mph range.2 The graph above tends to agree with the scouting report. The graph also shows that the lower limit to Pitcher A's fastball is at about 86 mph. By repeating this process for each pitcher, a better model is developed to distinguish fastballs
from off-speed pitches.
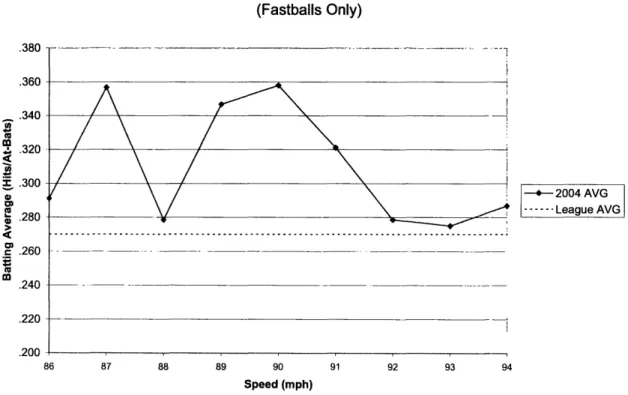
For every pitcher that pitched at Fenway Park in 2004, a pitch speed distribution graph was generated to determine the lower limit of each pitcher's fastball. This new definition was used to distinguish between fastballs and non-fastballs. Pitches were again binned into 1 mph intervals and batting averages were calculated for pitch speeds with at least 100 at-bats.
Batting Average Versus Pitch Speed
(Fastballs Only) .380 .360 .340 i, .320 X .300 0 0 .280 m C .260 .240 .220 .200 i--- 2004 AVG --- League AVG 86 87 88 89 90 91 92 93 94 Speed (mph)
Figure 2.4: Batting Average Versus Pitch Speed for Pitches Determined to be Fastballs
This model produces only slightly better results than the previous one that used an arbitrary lower limit for the fastball. This time the correlation (R2= 0.1373) was still weak and indicated that an additional 1 mph decreased batting average by 5 points. At each fastball speed, the batting average calculated was above league averages. The same analysis was repeated for pitches that did not qualify as fastballs.
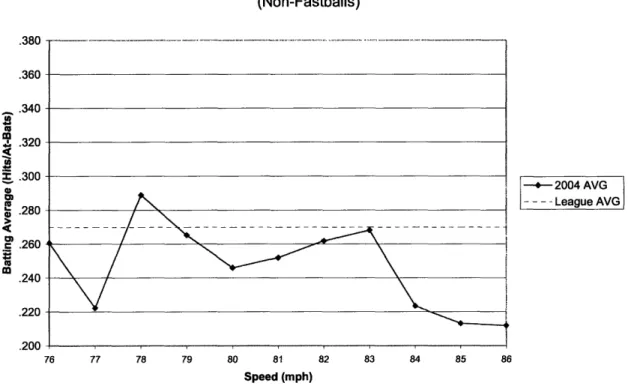
Batting Average Versus Pitch Speed
(Non-Fastballs)
- 2004 AVG
- - - -League AVG
76 77 78 79 80 81 82 83 84 85 86
Speed (mph)
Figure 2.5: Batting Average Versus Pitch Speed for Pitches Determined Not to be Fastballs
.3OU .360 .340 E .320 I .300 -M .280 C .260 .240 .220 .200
For non-fastballs, there is a better correlation (R2= 0.288) between batting average and pitch speed. It appears as if additional speed is a desirable feature when comparing an off-speed pitch to other off-speed pitches. Here, an additional 1 mph on a non-fastball equates to a decrease in 4 points in batting average. More important though, is the fact that all but one of the batting averages calculated for non-fastballs were below league average.
A simple comparison between fastballs and non-fastballs yields interesting results.
Table 2.1: Batting Statistics for Fastballs and Non-Fastballs
Fastballs Compared To Non-Fastballs
H AB AVG SLG HR K
Fastballs 947 3063 .309 .555 113 498
Non-Fastballs 612 2468 .248 .415 68 643
In 2004, fastballs resulted in 3063 at-bat outcomes and non-fastballs resulted in 2468 at-bat outcomes. Fastballs resulted in a significantly higher batting average as well as slugging percentage. Almost twice as many homeruns were hit off fastballs as
compared to non-fastballs and fastballs resulted in nearly 25% fewer strikeouts. Considering this statistics, it is possible to conclude that fastballs are a lot easier to hit than off-speed pitches.
2.4 The Effect of Change of Speed on Batting Average
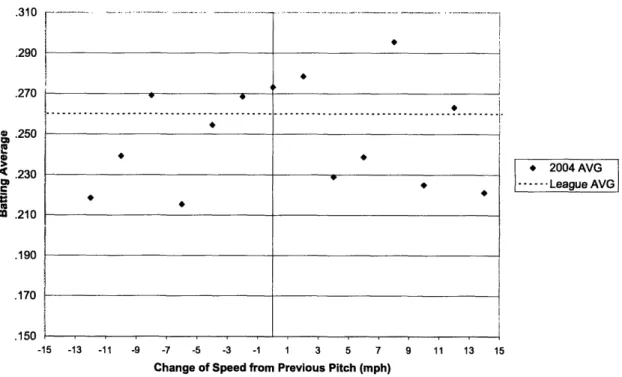
A simple study was done to measure the effect that changing speed from the previous pitch had on the outcome of a pitch. All pitches from 2005, excluding the first pitch of each at-bat were considered. On average, batters hit .260 on pitches that did not end on the first pitch of the at-bat. Batting average was then calculated for each change of speed at 2 mph intervals. A change of speed of zero would indicate that the pitch was thrown at the same speed as the previous pitch. A positive value of change of speed would indicate that the pitch was thrown faster than the previous pitch, while a negative value of change of speed would indicate that the pitch was thrown slower than the
previous. For example, an 88-mph fastball thrown after a 76-mph curveball would result in a +12 mph change of speed. The results of this study are shown in figure 2.6.
Batting Average Versus Change of Speed
.JIU .290 .270 a .250 E < .230 ._ m .210 .190 .170 150 -15 -13 -11 -9 -7 -5 -3 -1 1 3 5 7
Change of Speed from Previous Pitch (mph)
9 11
* 2004 AVG
... League AVG
13 15
Figure 2.6: Batting Average Versus Change of Speed from Previous Pitch
As the magnitude of change of speed increases, batting averages decrease. This relationship is stronger when the pitch is slower than the previous pitch than when the pitch is faster than the previous pitch, but holds true in both directions. In particular, hitters struggled when the magnitude of change of speed from the previous pitch was greater than 10 mph. This is most likely the result of upsetting hitters' timing.
4
~~
--- -- 4 .. .... ... .. . . . .. . . . .. . . .. .. .. . .. --- ... 0 . . . .. l ' ' 4n ... - . ... ... ... .. ... ] I I r r r F3. Location
"In pitching, as in real estate, there's a simple mantra: Location, location,
location. "- Johnny Bench
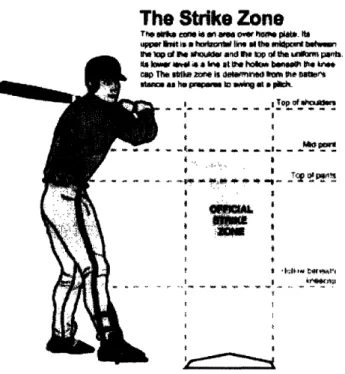
According to Johnny Bench, location is the single most important attribute of a pitch. Most pitchers and catchers would agree with Bench's statement. In general, pitchers try to throw strikes that pass through the strike zone as little as possible. This usually means aiming for the corners of the strike zone. As defined by Major League Baseball's Official Rules, the Strike Zone "is that area over home plate the upper limit of which is a horizontal line at the midpoint between the top of the shoulders and the top of the uniform pants, and the lower level is a line at the hollow beneath the knee cap. The Strike Zone shall be determined from the batter's stance as the batter is prepared to swing at a pitched ball."3 This definition is accompanied by the figure below.
The Strike Zone
ftH mils w L im at eM OnW htIs pemt. Im
uppe I, r ai bhle nt l ~ ni nI wi h mca wa
p tE kg urtiw and 3a h~p td the mtnn pni.
*i i k4 at k4 haO htned the &th he stk 2e IS bleWed tm Fe ~At I a ha prmt 'a s n mN lFimqta ~I ~~~I
I
I
* N~~~~~ I: i r~~~~~ ~~~ li·hm# NrmYImI~ II p ' I-·~~~~~~ Y·Wu r- m1~-IW* tinC.I~
Ni I' a i§ r alilUTa ir
I fl
I I "rH:lr
i
i
Figure 3.1: The Strike Zone as Defined by Official MLB Rules
3 Official Baseball Rules,
Commonly accepted pitching theories attribute success to pitchers who can locate their pitches down in the strike zone and can use both corners of the plate. Pitches
thrown right down the center of the plate often result in hits or even homeruns. Similarly, pitches that are up and over the plate allow the hitter to extend his arms fully to reach his maximum power stroke. With currently available pitch tracking technologies, it is possible to accurately record pitch locations within 1/2". This allows the conventional wisdom regarding pitching location to be objectively analyzed.
3.1 Breaking Down the Strike Zone
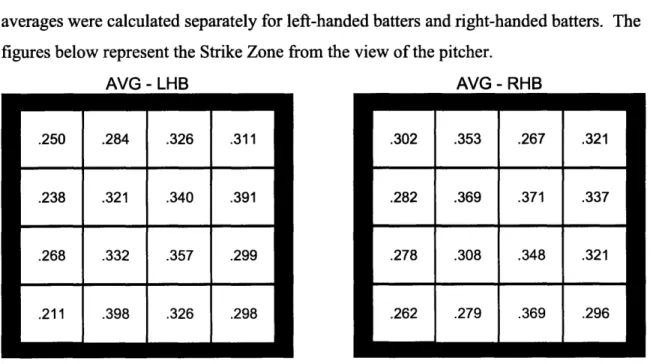
Breaking down the Strike Zone is a simple task. For this study, the Strike Zone was broken down into 16 sections. The data from both 2004 and 2005 were combined so that there would be a more significant number of at-bats for each section. The batting averages were calculated separately for left-handed batters and right-handed batters. The figures below represent the Strike Zone from the view of the pitcher.
AVG - LHB AVG - RHB .250 | .284 .326 .311 .238 .321 .340 .391 .268 .332 .357 .299 .211 .398 .326 .298 .302 .353 .267 .321 .282 .369 .371 .337 .278 .308 .348 .321 .262
----
.279 .369 .296I
Figure 3.2: Batting Averages Calculated for Each Section of the Strike Zone
It is clear from these diagrams that locating a pitch in the middle of the strike zone is very dangerous for a pitcher. Both left-handed batters and right-handed batters hit at least .300 on pitches in the middle four sections of the Strike Zone. More directly,
left-handed batters hit .340 in the middle four sections and .31 1 in the rest of the zone while right-handed batters hit .348 in the middle four sections and .302 in the rest of the zone.
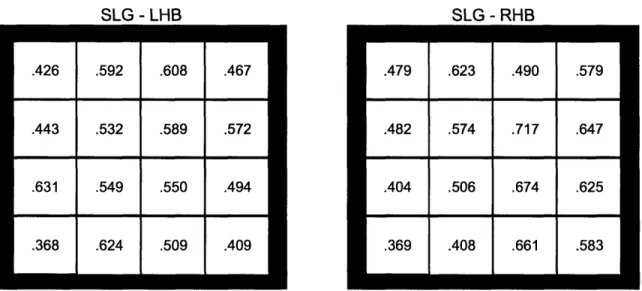
A similar study can be done to observe the effect of location on slugging percentage. This will give a better representation of hitting ability for extra bases in different areas of the Strike Zone. The Strike Zone is broken up into the same 16 sections as above. SLG - LHB SLG - RHB .426 .592 .608 .467 .443 .532 .589 .572 .631 .549 .550 .494 .368 .624 .509 .409 .479 .623 .490 .579 .482 .574 .717 .647 .404 .506 .674 .625 .369 .408 .661 .583
Figure 3.3: Slugging Percentages Calculated for Each Section of the Strike Zone
The analysis of slugging percentage in different sections of the Strike Zone produces similar results to that of batting average. For both left-handed and right-handed hitters, slugging percentage is over .500 in the middle four sections of the zone. In fact, for left-handed hitters slugging percentage is .557 in the middle four sections and .518 in the rest of the zone. For right-handed hitters, slugging percentage is .616 in the middle 4 sections and .512 in the rest of the plate. These data show that pitchers should avoid throwing pitches over the middle of the plate.
3.2 Comparing Strikes and Balls
Based on the official definition of the Strike Zone, all of the pitches in the 2005 data set were determined to be balls or strikes. This analysis was done in order to be completely umpire-independent. Regardless of the umpire's call or whether or not the
batter made contact, all pitchers were categorized by their location. Batting average and slugging percentage were calculated for pitches in the Strike Zone and pitches out of the
Strike Zone. Homeruns and strikeouts were counted as well.
Table 3.1: Batting Statistics for Strikes and Balls
Strikes Compared to Balls
H AB AVG SLG HR K
Strikes 1158 3672 .315 .531 141 416
Balls 389 1856 .210 .304 27 595
Clearly, the Strike Zone exists for a reason. Batters have extreme difficulties hitting pitches out of the zone. The batting average for balls is 105 points lower than the batting average for strikes. Likewise, the slugging percentage for balls is 227 points lower than the slugging percentage for strikes. Less than 1/6th of homeruns are hit on
balls. Finally, more strikeouts occur when pitchers fool batters in to swinging at pitches outside of the Strike Zone.
4. Movement
"I was taught that movement is more important than velocity. That advice came
from somebody I trusted I still believe that today" -- Greg Maddux
Not known for throwing very hard, Greg Maddux has put together a spectacular career by relying on the movement of his fastball. Movement is the most difficult variable of a pitch to calculate. Without knowing the full trajectory of the pitch or the spin of the ball in flight, it is impossible to figure out the entire horizontal and vertical break. For this analysis, only the entry point and exit point of the Strike Zone are used. Horizontal movement will be defined as the net horizontal displacement as the ball passes through the zone and vertical movement defined as the net vertical displacement as the ball passes through the zone. The following equations illustrate these definitions.
Xmovement, Xexi - Xentry (1)
Ymovement = it - Yentry (2)
It is fair to expect most pitches to break several inches as the ball approaches the plate. It is important to reiterate that for this investigation, the movement is only being calculated over the distance from the front end to the back end of the plate. This causes the movement to be on the order of one to two inches. It is assumed that this is a reasonable estimation with respect to the entire flight of a pitch.
4.1 Comparing Movement and Speed
To gain a better understanding of pitch movement, psuedocolor plots were generated to display movement with respect to pitch speed. The data set chosen was all of the pitches thrown by Pitcher A in 2004. These plots appear to present a better description of pitch type as opposed to the pitch speed distribution graphs.
F .t _ 4 ;( r 'o' ' '"'~.. i'',. dee
1
. r .' .'P-?
Figure 4.1: Pseudocolor Plot Showing the Horizontal Movement and Speed of Pitcher A's Pitches in 2004
.
:'.
'pi n-iiI
4
Figure 4.2: Pseudocolor Plot Showing the Vertical Movement and Speed of Pitcher A's Pitches in 2004
As expected, pitches at lower speeds tend to have more movement in both directions than pitches at higher speeds. These plots clearly differentiate Pitcher A's fastball from his off-speed pitches. The variance in each of the clusters lends to the probability that Pitcher A has multiple types of fastballs and multiple off-speed pitches at his disposal. This would support the scouting report as mentioned earlier.
4.2 The Effect of Net Movement on Batting Average
In order to observe the effect of movement on batting ability, horizontal
movement and vertical movement were combined into one variable. This new variable, net movement, is calculated by the following equation:
Netmovement = Xmovement + Ymovement (3)
This study included all pitches from the 2005 season that resulted in at-bat outcomes. Net movement was rounded to the nearest tenth inch and batting average was calculated for intervals with at least 100 at-bats.
Batting Average Vs. Net Movement
*~~~~~~~~~~~~~~~~~~~~
* 2005 AVG --- Linear (2005 AVG)
2 2.5
Net Movement (in)
Figure 4.3: Batting Average Versus Net Movement for All Pitches
There appears to be a correlation (R2= 0.2339) between batting average and net movement. It would be expected that increased movement reduces the batters chances of
getting a hit. In this model, increasing movement by 1 inch results in a 43 point decrease in batting average. .380 .360 .340 m .320 S .300 L .280 .= .260 .240 .220 .200 1.5 3 3.5 1
5. Putting it All Together
Finally, a preliminary study was done in order to combine the effects of speed, location and movement. In this model, the following variables were used to describe the pitch:
Speed speed (mph) andfastball or not (I or O)
Location - strike or not (I or O)
Movement net movement (in)
These variables were used to predict whether the pitch would result in a hit. A logistic regression was used because the dependent variable was binary. Either the pitch resulted in a hit, or the pitch resulted in an out. Pitches that did not result in an at-bat outcome were excluded from the model.
Table 5.1: SPSS Output for the Logistic Regression
Model Summary
-2 Log Cox & Snell Nagelkerke Step likelihood R Square R Square
1 6527.920a .017 .025
a. Estimation terminated at iteration number 4 because parameter estimates changed by less than .001.
Variables in the Equation
B S.E. Wald df Sig. Exp(B) Sep PitchSpeed -.020 .007 8.955 1 .003 .981
1 NetMove -.217 .082 6.892 1 .009 .805
FBOrNot .358 .090 15.690 1 .000 1.431
StrikeOrNot .560 .074 57.822 1 .000 1.750
Constant .536 .653 .673 1 .412 1.709 a. Variable(s) entered on step 1: PitchSpeed, Net_Move, FBOrNot, StrikeOrNot.
The model only accounts for only 2.5% of the variability in whether or not a pitch will result in a hit, given the variables in the equation listed above. Considering the wide range of factors that account the outcome of an at-bat (pitch sequence, defensive
alignment, individual talents, etc.), this result is expected. However, the last column of the second table describes the effect a one unit increase in each variable in the model will do to the odds of the pitch becoming a hit. An increase in 1 mph in pitch speed will result in a 2% decrease of the pitch becoming a hit and an increase in 1 inch in movement will result in a 20% decrease. Fastballs are 43% more likely to produce hits and strikes are 75% more likely to produce hits.
6. Conclusion
Speed, location and movement are all important factors in pitching. Several important conclusions can be drawn from the studies in this paper, all of which support conventional baseball wisdom: (1) Fastballs are much more likely to become hits than off-speed pitches. (2) Additional speed on a pitch will decrease the batter's chances of getting a hit. (3) Pitches within the strike zone are much more likely to become hits than pitches outside of the strike zone. (4) Additional movement on a pitch will decrease the batter's chances of getting a hit.
6.1 Further Study
A more complex model can be created to predict whether a pitch will result in a hit. The variables used in this paper were oversimplified. A better model would account for more specific pitch location, the pitch direction of movement and amount of pitch movement. Additional factors to consider might be the change in speed from the previous pitch and lefty-righty splits. Further considerations might include pitches that do not result in hits or outs such as called pitches, swings and misses, and foul balls.
References
Adair, Robert K. The Physics of Baseball. New York: Harper Collins, 1990. Baseball Reference, http://www.baseball-reference.com
ESPN.com, http://insider.espn.go.com/mlb/players/insider?playerId=????
James, Bill, and Rob Neyer. The Neyer/James Guide to Pitchers. New York: Fireside, 2004.
Official Baseball Rules,
http://mlb.mlb.com/NASApp/mlb/mlb/official info/official rules/definition terms 2.jsp Questec, http://www.questec.com
Voorhees, Randy, and Mark Gola. As Koufax Said...: The 400 Greatest Things Ever Said About Baseball. New York: McGraw Hill, 2003.
Acknowledgements
I would first like to thank my thesis advisor, Professor Cravalho, for all of his help on this thesis. It was a pleasure working with such a huge baseball fan.
Thanks to thank Professor Andy Andres from Boston Unviersity and Tufts University for his invaluable help and supervision with this project. He kept me focused and constantly shared his baseball knowledge.
I would also like to thank David Tybor, a graduate student at Tufts University for allowing me to take his and Andy's Sabermetrics course. He also taught me SPSS and helped with my regressions.
A special thanks to Jennifer Gefksy, John Abbamondi and the rest of the Major League Baseball Labor Relations Department for helping get the data.
I would like to thank Edward Plumacher and Ivan Santucci from Questec for answering all of my questions about the pitch tracking system.
I would like to acknowledge Ben Gallup for all of his help writing code in MATLAB. Finally, I thank my friends and family for their support. They have tolerated endless hours of baseball chatter.