HAL Id: hal-02661072
https://hal.inrae.fr/hal-02661072
Submitted on 30 May 2020
HAL is a multi-disciplinary open access
archive for the deposit and dissemination of
sci-entific research documents, whether they are
pub-lished or not. The documents may come from
teaching and research institutions in France or
abroad, or from public or private research centers.
L’archive ouverte pluridisciplinaire HAL, est
destinée au dépôt et à la diffusion de documents
scientifiques de niveau recherche, publiés ou non,
émanant des établissements d’enseignement et de
recherche français ou étrangers, des laboratoires
publics ou privés.
Citrus species and their effectiveness for genetic
mapping
François Luro, Gilles Costantino, Javier Terol, Thierry Allario, Xavier Argout,
Patrick Wincker, Manuel Talón, Patrick Ollitrault, Raphaël Morillon
To cite this version:
François Luro, Gilles Costantino, Javier Terol, Thierry Allario, Xavier Argout, et al.. Transferability
of the EST-SSRs developed on Nules clementine (Citrus clementina Hort ex Tan) to other Citrus
species and their effectiveness for genetic mapping. BMC Genomics, BioMed Central, 2008, 9, pp.287.
�10.1186/1471-2164-9-287�. �hal-02661072�
Open Access
Research article
Transferability of the EST-SSRs developed on Nules clementine
(Citrus clementina Hort ex Tan) to other Citrus species and their
effectiveness for genetic mapping
François L Luro*
1, Gilles Costantino
1, Javier Terol
2, Xavier Argout
3,
Thierry Allario
4, Patrick Wincker
5, Manuel Talon
3, Patrick Ollitrault
4and
Raphael Morillon
4Address: 1INRA, Unité de Recherche GEQA, INRA San Giuliano, 20230 San Nicolao, France, 2Centro de Genomica, Instituto Valenciano de Investigationes Agrarias, Valencia, Spain, 3CIRAD AMIS, Montpellier, France, 4UPR 'Amélioration génétique d'espèces à multiplication végétative', CIRAD, Montpellier, France and 5Genoscope, CNS, Evry, France
Email: François L Luro* - luro@corse.inra.fr; Gilles Costantino - costantino@corse.inra.fr; Javier Terol - jterol@ivia.es; Xavier Argout - argout@cirad.fr; Thierry Allario - allario@cirad.fr; Patrick Wincker - pwincker@genoscope.cns.fr; Manuel Talon - mtalon@ivia.es; Patrick Ollitrault - ollitrault@cirad.fr; Raphael Morillon - morillon@cirad.fr * Corresponding author
Abstract
Background: During the last decade, numerous microsatellite markers were developed for genotyping and to identify
closely related plant genotypes. In citrus, previously developed microsatellite markers were arisen from genomic libraries and more often located in non coding DNA sequences. To optimize the use of these EST-SSRs as genetic markers in genome mapping programs and citrus systematic analysis, we have investigated their polymorphism related to the type (di or trinucleotide) or their position in the coding sequences.
Results: Among 11000 unigenes from a Clementine EST library, we have found at least one microsatellite sequence
(repeated units size ranged from 2 to 6 nucleotides) in 1500 unigenes (13.6%). More than 95% of these SSRs were di or trinucleotides. If trinucleotide microsatellites were encountered trough all part of EST sequences, dinucleotide microsatellites were preferentially (50%) concentrated in the 5' 100th nucleotides. We assessed the polymorphism of 41 EST-SSR, by PCR amplification droved with flanking primers among ten Citrus species plus 3 from other genera. More than 90% of EST-SSR markers were polymorphic. Furthermore, dinucleotide microsatellite markers were more polymorphic than trinucleotide ones, probably related to their distribution that was more often located in the 5' UnTranslated Region (UTR). We obtained a good agreement of diversity relationships between the citrus species and relatives assessed with EST-SSR markers with the established taxonomy and phylogeny. To end, the heterozygosity of each genotype and all dual combinations were studied to evaluate the percentage of mappable markers. Higher values (> 45%) were observed for putative Citrus inter-specific hybrids (lime lemon, or sour orange) than for Citrus basic true species (mandarin, pummelo and citron) (<30%). Most favorable combinations for genome mapping were observed in those involving interspecific hybrid genotypes. Those gave higher levels of mappable markers (>70%) with a significant proportion suitable for synteny analysis.
Conclusion: Fourty one new EST-SSR markers were produced and were available for citrus genetic studies. Whatever
the position of the SSR in the ESTs the EST-SSR markers we developed are powerful to investigate genetic diversity and genome mapping in citrus.
Published: 16 June 2008
BMC Genomics 2008, 9:287 doi:10.1186/1471-2164-9-287
Received: 13 January 2008 Accepted: 16 June 2008 This article is available from: http://www.biomedcentral.com/1471-2164/9/287
© 2008 Luro et al; licensee BioMed Central Ltd.
This is an Open Access article distributed under the terms of the Creative Commons Attribution License (http://creativecommons.org/licenses/by/2.0), which permits unrestricted use, distribution, and reproduction in any medium, provided the original work is properly cited.
Background
Simple Sequence Repeats are tandem repeat sequences that are quite abundant in eukaryotes genomes [1]. Numerous genomic libraries enriched in SSR have been established from many plant species [2-5]. Those repeat sequences also called microsatellites (MS) present a higher level of polymorphism and higher expected heter-ozygosity when compared with to other dominant (AFLP and RAPD) or codominant markers (RFLP) [6]. Since SSRs are ubiquitously present in genomes with randomly occurrence, they are communally used as genetic markers in many different plant species to unravel the interspecific and intraspecific diversity [7-10].
In citrus, the number of published markers of genomic SSRs is still limited [11,12]. Those markers were used for genetic diversity assessment and for germplasm manage-ment [13,14]. A high-density microsatellite consensus map is still lacking. The major goal of genetic mapping is to localize genes or QTLs, involved in traits of interest that are linked to molecular markers. Those molecular markers can be used as a starting point for gene identification or to reduce schemes of selection. One other way to address this aim is to develop markers directly localized in the coding sequences. ESTs (Expressed Sequence Tags) derived from cDNA libraries obtained from the genome expression have been investigated for microsatellite screening, in barley [15], wheat [16], rice [17], citrus [18,19], sugarcane [20] and grape [21]. It is assumed that those SSRs markers should enable to assess the molecular evolution of the genes in which they are positioned. Indeed, it has been observed that in ESTs, the flanking region of SSRs are more conserved and can also be found in related genera [22]. Thousands of EST-SSRs were iden-tified in numerous species such as grape and cereal. A high level of transferability was noted between rice, wheat and barley [17]. In citrus, thousands of ESTs are now available in databases. Recently, using public sequence databases resources, Chen et al. [23], published the characterization of 56 EST-SSR markers identified among 2295 citrus ESTs, mappable in a progeny obtained from a cross between sweet orange (Citrus sinensis L. Osb.) and trifoliate orange (Poncirus trifoliata L. Raf.). If those two genotypes repre-sent important resources of agronomical characters for rootstock and cultivar improvement scheme, numerous other citrus species offer a large panel of specific traits interesting breeders or consumers. For example, Clemen-tine (Citrus clementina Hort. Ex Tan.) is a model citrus crop in Mediterranean area and sour orange (C. aurantium L.) or Cleopatra mandarin (C. reshni Hort. Ex Tan.) are toler-ant to abiotic constraints such as salt stress or calcareous soils [24]. Citrus as many fruit trees have a juvenility period with around 5 years of duration limiting the possi-bility to study the allelic segregation on a second genera-tion of hybrids (F2 or BC). Consequently citrus genetic
maps are established on F1 progenies at interspecific [25], and intergeneric levels [26-31]. To maximize the potential for the development of EST-SSR based maps we need to investigate the polymorphism and the heterozygosity of these markers in different combined genotypes at the ori-gin of F1 progenies. Another point of reflexion concerning the polymorphism of SSRs in EST is the usefulness of the derived markers such as STMS (Sequence Tagged MicroS-atellite) in cultivar distinctness and in relationships between varieties and species. The particular position of these SSRs inside coding sequences may question the genetic diversity information that we can extract from those markers related to the putative influence of the selection on the SSR polymorphism.
In a full-length clementine (Citrus clementina) ESTs data-base [19], we looked for SSR markers. Screening of 37 000 ESTs allowed us to identify about 1600 SSRs. We report here the outline investigation of the polymorphism of EST-SSR among a set of 16 citrus species covering a wide range of citrus genetic diversity. We assessed also the map-pability of these markers on our different progenies estab-lished for heredity studies. The effect of repeated motif length (dinucleotide or trinucleotide) and their position on the cDNA sequence, on their polymorphism are also discussed.
Methods
SSR detection
SSR detection was undertaken on 11632 non-redundant sequences generated by the StackPACK application homepage [32] from 37 000 ESTs obtained from Nules clementine. The MIcroSAtellite identification tool (MISA) [33] was used to perform the search of 2 to 6 nucleotide motif repeats into the unigene dataset. Dinucleotide SSRs were identified with a minimum of six repeats and the other types of SSR with a minimum of five repeats. The maximum interruption between 2 SSRs to consider a SSR as a compound one was set at 100 nucleotides. Perl script modules linked to the primer modelling software Primer3 [34], were used to design primers flanking each SSR region found. The primer product size range was chosen between 100 and 280 nucleotides. The optimum size of primers was set to 17 nucleotides (range from 15 to 23 nucle-otides) with an optimum melting temperature of 56.0°C (range from 50 to 63°C). When possible, 3 pairs of prim-ers were picked for each STMS. The localization of SSRs in comparison with the coding sequence was estimated by BLASTx analysis realised during initiation of the Clemen-tine EST Database (ESTtik, CIRAD, Montpellier, France) for assessing putative function to the unigene sequence. The codon sequences were translated in nucleotide sequences and then the SSR position related to the CDS was elucidate and detailed as following: in 5'UTR, in CDS or in 3'UTR.
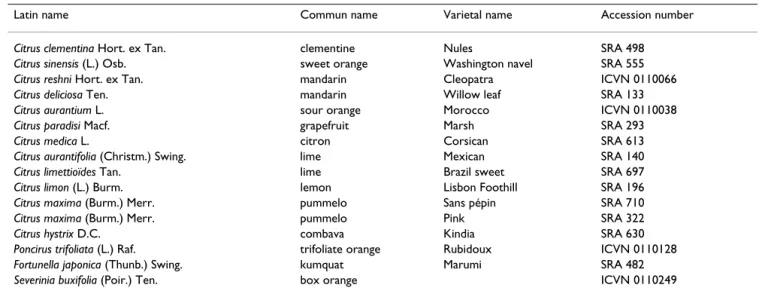
Plant material
Sixteen citrus genotypes were investigated for microsatel-lite screening. Thirteen varieties from 10 species were cho-sen to reprecho-sent the Citrus genus (Table 1). One accession of the two other true citrus genera, Fortunella marumi and
Poncirus trifoliate and a related wild genus, Severinia buxifo-lia, completed the citrus sample set. All those accessions
are maintained in the INRA CIRAD citrus depository at San Giuliano (Corsica, France).
EST functional annotation
Functional annotation of ESTs was based on Gene Ontol-ogy (GO) annotation [35], and performed of with BLAST2GO [36]. B2G parameters were: NCBI non-redun-dant DB for BLAST search, 20 hits maximum for BLAST result, 100 nt as minimum HSP-length to retain putative annotating hits and default Evidence Code Weights for Gene Ontology annotation that assigns high ECWs to experimental-based and curate annotations while penal-ized electronic and non-curate annotations. Minimum values for BLAST e-value and % similarity of the BLAST result were e-06 and 55% respectively and ultimate anno-tation cut-off value was set to 55.
To provide a broad representation of the distribution of gene product functions, the ESTs were organized in sets according to broad GO ontology categories, as described by the GO Slim Classification for Plants developed at TAIR. GOSlim annotations of the Citrus ESTs were also generated with the B2G software, using the plant GOSlim mapping tool provided in TAIR. The GO Slim classifica-tion was performed for both the whole collecclassifica-tion of 37 000 ESTs and the subset of sequences carrying SSRs.
SSR polymorphism analysis
Total DNA was extracted from leaf samples according to the method developed by Doyle and Doyle [37]. Amplifi-cations were performed according to Kijas et al. [11] in a thermocycler (PTC 200, MJ Research) using 10 ng of DNA, 0.5 μM of each primer and 0.8 unit of Taq polymer-ase (Goldstar, Eurogentec). The annealing temperature was fixed for all primer pairs at 55°C (this condition was taking account during the primer designing). Separation of alleles was performed on a 6% polyacrylamide sequencing gel containing 7 M urea in 0.5× TBE buffer at 60 W for 2 h to 3 h. Three microliters of PCR product was mixed to an equal volume of loading buffer containing 95% formamide, 0.25% bromophenol blue and 0.25% xylen cyanol, and 10 mM of EDTA. This mixture was heated for 5 min at 94°C to denature the DNA before loading. Gels were stained with silver nitrate following the protocol detailed by Chalhoub et al. [38], for gel electro-phoresis analysis and by comparison with the 10 bp DNA standard ladder (Invitrogen).
Genetic diversity and data analysis
Four parameters of diversity were estimated for each locus corresponding to a subset of 39 SSR markers: percentage of polymorphic loci, the mean number of alleles per locus, observed heterozygosity (H0), and the identifica-tion rate (IR). H0 was estimated for each type of EST-SSR marker. IR represents the degree of polymorphism of each marker suitable for genotype distinctness and was calcu-lated as where Pi is the rate of identified geno-types across all individuals at i locus and n is the number of observed loci. The value of IR varies between 1 (all the individuals are distinct at all loci) and 0 (all individuals
1 1 n Pi i n =
∑
Table 1: Citrus accessions used in this study for STMS screening maintained at the Corsican citrus germplasm.
Latin name Commun name Varietal name Accession number
Citrus clementina Hort. ex Tan. clementine Nules SRA 498
Citrus sinensis (L.) Osb. sweet orange Washington navel SRA 555
Citrus reshni Hort. ex Tan. mandarin Cleopatra ICVN 0110066
Citrus deliciosa Ten. mandarin Willow leaf SRA 133
Citrus aurantium L. sour orange Morocco ICVN 0110038
Citrus paradisi Macf. grapefruit Marsh SRA 293
Citrus medica L. citron Corsican SRA 613
Citrus aurantifolia (Christm.) Swing. lime Mexican SRA 140
Citrus limettioïdes Tan. lime Brazil sweet SRA 697
Citrus limon (L.) Burm. lemon Lisbon Foothill SRA 196
Citrus maxima (Burm.) Merr. pummelo Sans pépin SRA 710
Citrus maxima (Burm.) Merr. pummelo Pink SRA 322
Citrus hystrix D.C. combava Kindia SRA 630
Poncirus trifoliata (L.) Raf. trifoliate orange Rubidoux ICVN 0110128
Fortunella japonica (Thunb.) Swing. kumquat Marumi SRA 482
have a same molecular profile at any locus). An ANOVA was applied as statistical analysis to test the effect of the SSR features on diversity parameters.
To determine the genetic diversity structure and relation-ships between species we scored the SSR profile at 41 loci for each citrus sample by coding the presence (1) and the absence (0) of each allele. Genetic distance between each citrus genotype was estimated by calculating the Dice dis-similarity index [39]. A dendrogram was constructed with the Neighbour joining method [40]. This analysis was per-formed with the "DARwin" software developed by CIRAD (Montpellier, France). We have calculated the percentage of heterozygous loci of each of the 15 genotypes (Severinia
buxifolia was not included in this analysis) and also the
percentage of polymorphic and monomorphic hetero-zygous loci between each pair of genotypes. The percent-age of mappable loci in each hypothetical genotype association was estimated by the addition of the rate of heterozygous loci from two parents and avoiding to tak-ing account twice the commune markers.
Results
EST-SSRs frequency and GO representation
1692 SSRs (excepted mononucleotide unit) were identi-fied among 11 391 unigenes from 37 000 EST clones. We first analyzed the type nucleotide repetition in the SSRs. Some unigenes contained more than one microsatellite sequences and at the end, 1501 unigenes (13%) had at least one SSR. Functional characterization of ESTs was per-formed assigning Gene Ontology annotations [35], with the BLAST2GO software [36]. To provide a general repre-sentation of the annotation, the Slim GO Classification was obtained (see Materials and Methods), for both the whole set of ESTs and the subset displaying SSRs. ESTs with SSRs were present in every major Slim GO category, and no significant differences could be found with respect the whole EST collection (Fig. 1).
The different SSRs found among our Clementine EST library and their frequency were: the most common trinu-cleotide repeats (53.9%) followed by dinutrinu-cleotide repeats (37.6%), tetranucleotide repeats (3.7%), hexanucleotide repeats (2.4%) compound repeats (2%) and the less abundant pentanucleotide repeats (0.4%).
Comparison of the unigenes distribution in MIPs function categories between the citrus EST collection and the ESTs that con-tain SSR
Figure 1
Comparison of the unigenes distribution in MIPs function categories between the citrus EST collection and the ESTs that contain SSR.
Distribution of di or trinucleotide SSRs on ESTs
The SSRs display preferential location along EST sequences from clementine EST database [19] was, with a high concentration of these before the 100th nucleotide
from the 5' extremity (75%). The analysis of the SSR type showed a difference on distribution along the EST sequence (Fig. 2). Dinucleotide microsatellites were located preferentially at the beginning (5'part) of the cDNA (50% of the total were located before the 100th
nucleotide) and in the UTR (75%). Trinucleotide SSRs were less concentrated at the beginning of the 5' terminal region of the cDNA sequence (25%) when compared to dinucleotide SSRs. Microsatellites were localized either inside, either outside the translated region (TR). Since the absence of a stop codon in some cDNA sequences (the sequencing was not complete in the 3' extremity), it wasn't possible to detect any translated sequences or ORFs (open reading frame) for the cDNA sequences corre-sponding to the EST-SSR markers N° 16, 21, 26, 34 and 43. For EST sequences where the TR was detected, dinucle-otide SSRs were preferentially concentrated (75% of them) in untranslated regions (UTR). Trinucleotide mic-rosatellites were equitably distributed inside and outside the TR of the ESTs (48% and 52% respectively).
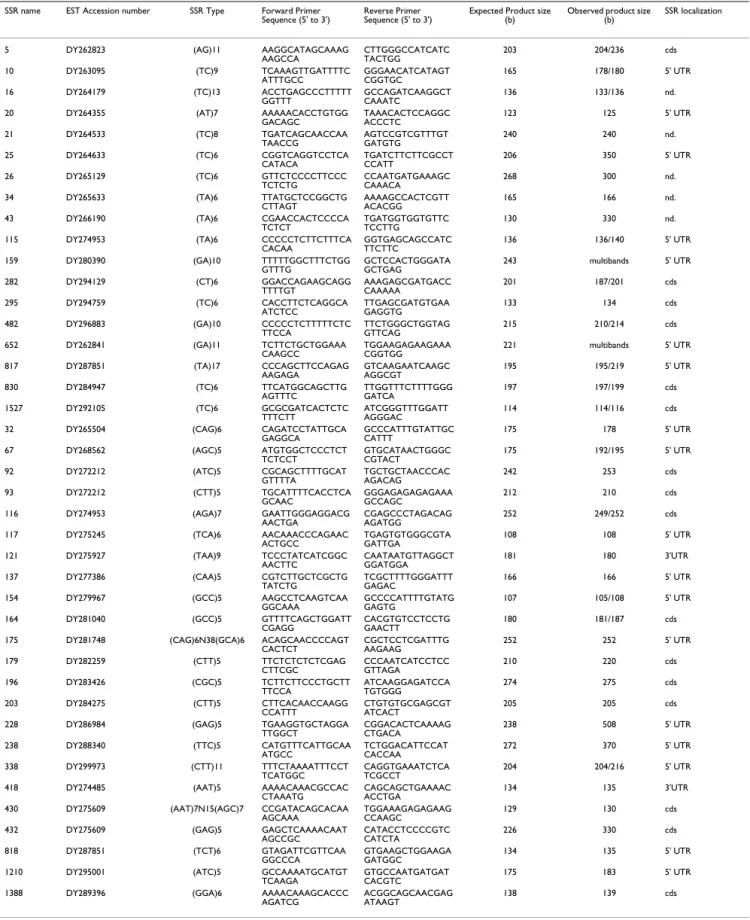
Development of EST-SSR markers
A set of 48 pairs of primers was randomly chosen among the 1692 microsatellites that matched with identified genes sequences from nucleic acid data bases (EMBL or NCBI) to amplify 23 dinucleotide SSRs and 25 trinucle-otide SSRs. Among them, 7 did not amplify even clemen-tine suggesting that the selected primers were not adapted or that the PCR product was too large to be amplified. 41 primer pairs amplifying DNA fragment in Clementine were presented in Table 2. In order to check the
redun-dancy or the novelty of those markers, we compared by BLASTn the sequences of EST clones supporting the devel-opment of EST-SSR markers in clementine with those published by Chen et al [23]. We have not detected any similarity between both sets of markers. The amplified DNA profile of EST-SSR markers N°115 and N°482 were multi-bands suggesting genome duplications of corre-sponding genes or nonspecific PCR amplification. We have also compared the expected size of DNA fragment containing each SSR and flanked by primers (calculated from the EST sequence), and the size of corresponding amplified fragments from genomic DNA of Clementine (estimated on gel electrophoresis) (Table 2). The observed PCR product sizes were mainly equal to the expected ones with differences minus than 10 nucleotides. These small variations could be associated to errors during ESTs sequencing or in size estimation on gel electrophoresis. For 6 EST-SSR markers (N° 21, 25, 34, 203, 228 and 430) variations were greater than 30 nucleotides with a maxi-mum of 270 bases of increase of the DNA fragment size for marker N°430. In those markers, we suspected the presence of introns in the amplified DNA fragments. The 39 single EST-SSR markers were used to amplify the DNA of 16 genotypes representing a wide genetic varia-tion of the Corsican citrus germplasm. Amplificavaria-tions were successful for all the citrus genotypes with all primer pairs excepted for 3 markers which did not amplify any DNA fragment for Box orange (Severinia buxifolia). This genotype was considered to a member of the Citrinae sub-tribes as true citrus genera (Poncirus, Fortunella and Citrus). Observed size variations in amplified DNA fragments were always correlated to the size of the repeated sequence unit of each SSR suggesting that the polymorphism was only related to the difference of repetition number of SSR. On the figure 3 is represented the polymorphism detected with the trinucleic microsatellite marker N°164. Note that the size differences between each DNA fragments were equal or multiple of 3 (181/187 bases, 181/190 bases, 184/181 bases for respectively Nules clementine, Morocco sour orange and Mexican lime). The sequencing of these different SSR alleles confirmed that the size vari-ation was due to the difference in the number of repeats unit.
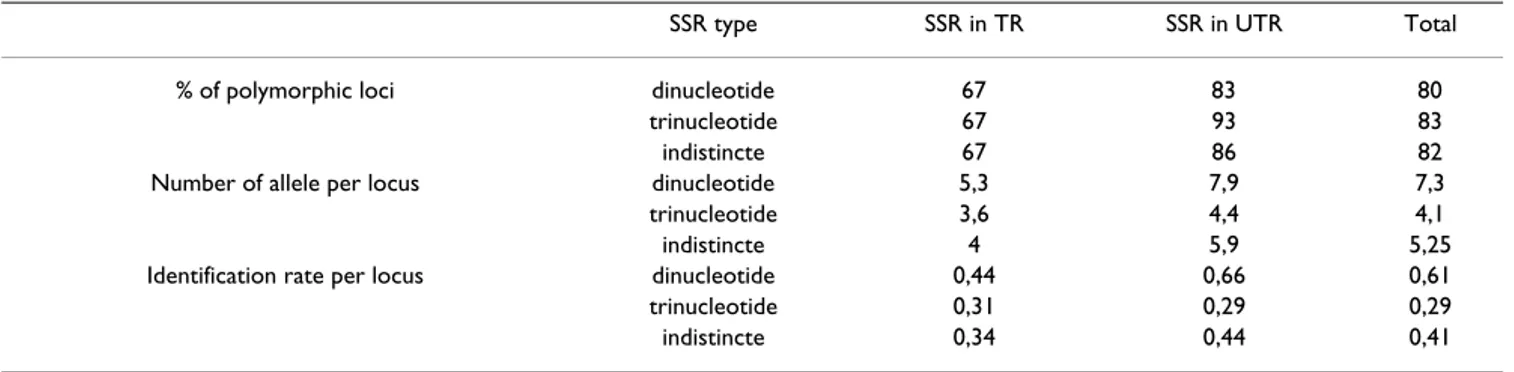
Position and SSR type effect on polymorphism
Polymorphism, number of allele per locus and number of genotypes per locus for the 16 dinucleic and 23 trinucleic SSRs when compared to their respective position on the EST sequence (Table 3). Without any distinction about the type of SSR we have observed an effect of the SSR posi-tion on the polymorphism. The polymorphism obtained was greater when SSRs were in UTRs (86% versus 67%) whatever the type of repeats. Considering only the type of
Position of the dinucleotide and trinucleotide SSRs from 5' end EST sequences
Figure 2
Position of the dinucleotide and trinucleotide SSRs from 5' end EST sequences.
Table 2: Primers sequences of a random selection of 41 EST-STMS.
SSR name EST Accession number SSR Type Forward Primer Sequence (5' to 3')
Reverse Primer Sequence (5' to 3')
Expected Product size (b)
Observed product size (b)
SSR localization
5 DY262823 (AG)11 AAGGCATAGCAAAG
AAGCCA CTTGGGCCATCATC TACTGG 203 204/236 cds 10 DY263095 (TC)9 TCAAAGTTGATTTTC ATTTGCC GGGAACATCATAGT CGGTGC 165 178/180 5' UTR 16 DY264179 (TC)13 ACCTGAGCCCTTTTT GGTTT GCCAGATCAAGGCT CAAATC 136 133/136 nd.
20 DY264355 (AT)7 AAAAACACCTGTGG
GACAGC TAAACACTCCAGGC ACCCTC 123 125 5' UTR 21 DY264533 (TC)8 TGATCAGCAACCAA TAACCG AGTCCGTCGTTTGT GATGTG 240 240 nd. 25 DY264633 (TC)6 CGGTCAGGTCCTCA CATACA TGATCTTCTTCGCCT CCATT 206 350 5' UTR 26 DY265129 (TC)6 GTTCTCCCCTTCCC TCTCTG CCAATGATGAAAGC CAAACA 268 300 nd.
34 DY265633 (TA)6 TTATGCTCCGGCTG
CTTAGT
AAAAGCCACTCGTT ACACGG
165 166 nd.
43 DY266190 (TA)6 CGAACCACTCCCCA
TCTCT
TGATGGTGGTGTTC TCCTTG
130 330 nd.
115 DY274953 (TA)6 CCCCCTCTTCTTTCA
CACAA GGTGAGCAGCCATC TTCTTC 136 136/140 5' UTR 159 DY280390 (GA)10 TTTTTGGCTTTCTGG GTTTG GCTCCACTGGGATA GCTGAG 243 multibands 5' UTR 282 DY294129 (CT)6 GGACCAGAAGCAGG TTTTGT AAAGAGCGATGACC CAAAAA 201 187/201 cds 295 DY294759 (TC)6 CACCTTCTCAGGCA ATCTCC TTGAGCGATGTGAA GAGGTG 133 134 cds 482 DY296883 (GA)10 CCCCCTCTTTTTCTC TTCCA TTCTGGGCTGGTAG GTTCAG 215 210/214 cds
652 DY262841 (GA)11 TCTTCTGCTGGAAA
CAAGCC
TGGAAGAGAAGAAA CGGTGG
221 multibands 5' UTR
817 DY287851 (TA)17 CCCAGCTTCCAGAG
AAGAGA GTCAAGAATCAAGC AGGCGT 195 195/219 5' UTR 830 DY284947 (TC)6 TTCATGGCAGCTTG AGTTTC TTGGTTTCTTTTGGG GATCA 197 197/199 cds 1527 DY292105 (TC)6 GCGCGATCACTCTC TTTCTT ATCGGGTTTGGATT AGGGAC 114 114/116 cds
32 DY265504 (CAG)6 CAGATCCTATTGCA
GAGGCA
GCCCATTTGTATTGC CATTT
175 178 5' UTR
67 DY268562 (AGC)5 ATGTGGCTCCCTCT
TCTCCT
GTGCATAACTGGGC CGTACT
175 192/195 5' UTR
92 DY272212 (ATC)5 CGCAGCTTTTGCAT
GTTTTA TGCTGCTAACCCAC AGACAG 242 253 cds 93 DY272212 (CTT)5 TGCATTTTCACCTCA GCAAC GGGAGAGAGAGAAA GCCAGC 212 210 cds
116 DY274953 (AGA)7 GAATTGGGAGGACG
AACTGA
CGAGCCCTAGACAG AGATGG
252 249/252 cds
117 DY275245 (TCA)6 AACAAACCCAGAAC
ACTGCC
TGAGTGTGGGCGTA GATTGA
108 108 5' UTR
121 DY275927 (TAA)9 TCCCTATCATCGGC
AACTTC CAATAATGTTAGGCT GGATGGA 181 180 3'UTR 137 DY277386 (CAA)5 CGTCTTGCTCGCTG TATCTG TCGCTTTTGGGATTT GAGAC 166 166 5' UTR 154 DY279967 (GCC)5 AAGCCTCAAGTCAA GGCAAA GCCCCATTTTGTATG GAGTG 107 105/108 5' UTR 164 DY281040 (GCC)5 GTTTTCAGCTGGATT CGAGG CACGTGTCCTCCTG GAACTT 180 181/187 cds
175 DY281748 (CAG)6N38(GCA)6 ACAGCAACCCCAGT
CACTCT CGCTCCTCGATTTG AAGAAG 252 252 5' UTR 179 DY282259 (CTT)5 TTCTCTCTCTCGAG CTTCGC CCCAATCATCCTCC GTTAGA 210 220 cds 196 DY283426 (CGC)5 TCTTCTTCCCTGCTT TTCCA ATCAAGGAGATCCA TGTGGG 274 275 cds 203 DY284275 (CTT)5 CTTCACAACCAAGG CCATTT CTGTGTGCGAGCGT ATCACT 205 205 cds
228 DY286984 (GAG)5 TGAAGGTGCTAGGA
TTGGCT CGGACACTCAAAAG CTGACA 238 508 5' UTR 238 DY288340 (TTC)5 CATGTTTCATTGCAA ATGCC TCTGGACATTCCAT CACCAA 272 370 5' UTR 338 DY299973 (CTT)11 TTTCTAAAATTTCCT TCATGGC CAGGTGAAATCTCA TCGCCT 204 204/216 5' UTR
418 DY274485 (AAT)5 AAAACAAACGCCAC
CTAAATG
CAGCAGCTGAAAAC ACCTGA
134 135 3'UTR
430 DY275609 (AAT)7N15(AGC)7 CCGATACAGCACAA
AGCAAA
TGGAAAGAGAGAAG CCAAGC
129 130 cds
432 DY275609 (GAG)5 GAGCTCAAAACAAT
AGCCGC CATACCTCCCCGTC CATCTA 226 330 cds 818 DY287851 (TCT)6 GTAGATTCGTTCAA GGCCCA GTGAAGCTGGAAGA GATGGC 134 135 5' UTR
1210 DY295001 (ATC)5 GCCAAAATGCATGT
TCAAGA
GTGCCAATGATGAT CACGTC
175 183 5' UTR
1388 DY289396 (GGA)6 AAAACAAAGCACCC
AGATCG
ACGGCAGCAACGAG ATAAGT
138 139 cds
Both the expected PCR product size and observed product size are base number (b), multibands mean a non specific amplification or multilocus profile. Cds: Coding sequence; 3'UTR or 5'UTR 3' end or 5' end of untranslated region
repeated unit, differences were also observed. If the per-centage of polymorphic loci was quite similar between tri-nucleic SSRs (83%) and ditri-nucleic SSRs (80%), for the two last indicators of marker diversity the effect of unit repeat was significantly different. Dinucleic repeated units revealed significant higher polymorphism than trinucleic repeated units with 7.3 versus 4.1 alleles per locus (P = 0.015), and 0.61 versus 0.29 for the IR (P = 0.010). If we combine parameters, type and position, differences were particularly important for SSRs localized in UTR. In this situation, dinucleic repeats had a number of alleles per locus greater than trinucleic repeats (7.9 versus 4.4) and a rate of identification 2 fold greater (0.66 versus 0.29). The higher value of alleles per locus for dinucleic SSRs could
be related to the higher percentage of heterozygous loci (54% versus 29% for trinucleic SSRs).
EST-SSR markers for genetic mapping
Heterozygosity of genotypes is a key component for genetic mapping on F1 progenies classically used for citrus genetic mapping. Based on a unique F1 progeny obtained from a cross between two heterozygous genotypes it is possible to develop a genetic map for each parent. Among our genotypes it varies from 8% for citron to 58% for Bra-zil Sweet lime (Table 4). Excepted citron, the heterozygos-ity of other citrus genotypes is higher than 23%. In order to estimate the rate of mappable EST-SSR markers in each putative F1 progeny we have considered the percentage of
Polymorphism of the trinucleotide microsatellite (EST164 STMS) among citrus genotypes detected by silver nitrate staining gel electrophoresis
Figure 3
Polymorphism of the trinucleotide microsatellite (EST164 STMS) among citrus genotypes detected by silver nitrate staining gel electrophoresis. Below the photography size allelic interpretation of each genotype is detailed. The
order of the sample is the following: Invitrogen 10 bp ladder (Lane M), 'Nules' clementine (lane 1), 'Washington Navel' sweet orange (lane 2), 'Cleopatra' mandarin (lane 3), 'Willow leaf' mandarin (lane 4), 'Morocco' sour orange (lane 5), 'Marsh' grape-fruit (lane 6), 'Corsican' citron (lane 7), 'Mexican' lime (lane 8), 'Brazil sweet' lime (lane 9), 'Lisbon Foothill' lemon (lane 10), 'Sans pepin' pummelo (lane 11), 'Pink' pummelo (lane 12), 'Kindia' combava (lane 13), 'Rubidoux' trifoliate orange (lane 14), 'Marumi' kumquat (Lane 15).
Table 3: Comparison of polymorphism parameters between dinucleotide and trinucleotide EST-SSR located in untranslated region (UTR) or in translated region (TR)
SSR type SSR in TR SSR in UTR Total
% of polymorphic loci dinucleotide 67 83 80
trinucleotide 67 93 83
indistincte 67 86 82
Number of allele per locus dinucleotide 5,3 7,9 7,3
trinucleotide 3,6 4,4 4,1
indistincte 4 5,9 5,25
Identification rate per locus dinucleotide 0,44 0,66 0,61
trinucleotide 0,31 0,29 0,29
heterozygous loci, polymorphic and monomorphic between two genotypes in all putative combinations (Table 4). We have not considered Severinia buxifolia in this table because it is sexually incompatible with other true citrus varieties and so unsuitable for progeny creation for genetic programs. Heterozygous loci polymorphic between two genotypes could be used as anchored mark-ers suitable for comparative genetic maps (sinteny). Higher values were observed between highly hetero-zygous species like Morocco sour orange (45%) and Marsh grapefruit (43%) with 29% of loci usable for parative mapping. At the opposite, whatever the com-bined genotype, very few loci (less 10%) were available for sinteny in all combinations involving citron that is the less heterozygous citrus specie. In general, combinations including interspecific hybrids such as limes, lemon, grapefruit, orange, and sour orange gave the highest per-centage of EST-SSR markers suitable for sinteny (>20%). Kindia combava which is wild citrus specie is hetero-zygous as interspecific hybrids (43%) and is also charac-terized by high percentage of suitable markers for sinteny whatever the parental partner excepted with Corsican cit-ron and Pink pummelo. We have estimated also the per-centage of monomorphic heterozygous loci (upper part of the table 4). If the allelic segregation could be expected in these loci, the parental origin for inherited allele could not be assigned and then the information related to meiosis in both genotypes is lost. These markers were usually included in segregation data set for genetic map construc-tion from F1 progeny, with the hypothesis of equal recombination rate and normal segregation between male and female genomes. In few combinations the percentage of heterozygous and monomorphic loci is quite high for instance for clementine/sweet orange (20%) or Brazil
sweet lime/lemon (21%). Nevertheless, excepted pairs involving clementine and sweet orange combined with Willow leaf mandarin, sour orange and grapefruit, the percentage of heterozygous loci showing a same profile between two genotypes was very low near zero.
Estimated percentages of mappable loci in each F1 prog-eny were presented in Table 5. The mean value of mappa-ble loci calculated on the basis of all results was 57% for this set of genotypes. In details, higher values were observed for different combinations involving Brazil sweet lime with different genotypes, as Marsh grapefruit (80%), Valencia late sweet orange (78%) or Morocco sour orange (77%). It is quite interesting to note that the com-bination of the two more heterozygous genotypes (Brazil sweet lime and Lisbon lemon) produced a relatively low percentage of mappable marker (65%) due to high level of commune markers (21% of polymorphic plus 21% of monomorphic). The less efficient combination was observed for Corsican citron associated with Cleopatra mandarin (29%) due to the high homozygous level of these genotypes.
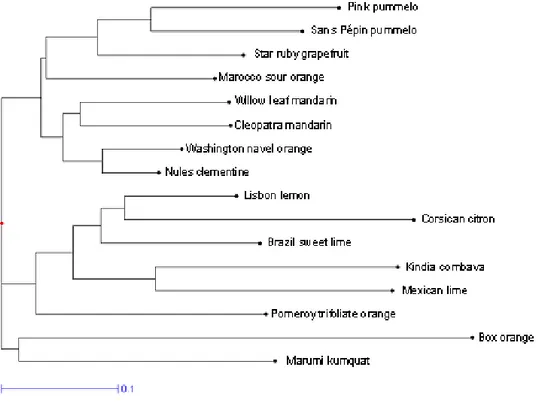
EST-SSR markers for genetic diversity analysis
In order to evaluate the ability of EST-SSR markers to be used for systematic studies a cluster analysis of genetic diversity was done combining polymorphism data of dinucleic and trinucleic EST-SSR (Fig. 4). The sixteen gen-otypes were clearly differentiated and the relationships between them were organized around two major groups, clearly defined: The first group associated mandarins, orange, sour orange, grapefruit and pummelo. The second one was constituted mainly by the acidic species such as lemon, limes, citron and combava. We can note that
trifo-Table 4: Percentage of heterozygous loci, for each citrus genotype (diagonally bold characters); percentage of monomorphic heterozygous loci between each pair of genotype (italic characters in the upper right size of the table) and percentage of polymorphic heterozygous loci between two genotypes (normal characters in the left down part of the table).
IN* Varieties 1 2 3 4 5 6 7 8 9 10 11 12 13 14 15
1 Clementine 36 20 3 18 11 9 0 0 3 6 0 0 0 0 3
2 Valencia late sweet orange 3 40 6 15 11 12 0 0 3 6 0 3 0 0 3
3 Cleopatra mandarin 11 3 24 6 3 0 0 0 3 3 0 0 0 0 3
4 Willow leaf mandarin 9 3 12 43 9 9 0 0 3 3 0 3 0 0 3
5 Morocco sour orange 20 23 11 15 45 3 0 0 3 6 0 3 0 0 3
6 Marsh grapefruit 12 18 12 12 29 43 0 3 0 0 0 3 0 0 0
7 Corsican citron 6 3 3 3 3 3 8 3 0 0 3 0 0 0 0
8 Mexican lime 24 21 15 24 24 18 3 41 9 6 3 3 3 0 0
9 Brazil sweet lime 20 17 11 24 23 21 3 24 58 21 6 6 6 0 6
10 Lisbon lemon 21 15 15 24 24 21 3 24 21 49 9 3 0 3 6
11 Sans pepins pummelo 15 15 12 15 18 12 3 15 18 9 32 0 0 0 0
12 Pink pummelo 6 9 9 9 6 12 3 12 12 9 12 27 0 0 0
13 Kindia combava 21 21 15 21 24 18 6 21 24 21 21 9 43 0 0
14 Pomeroy trifoliate orange 11 17 9 12 17 18 3 18 20 9 15 12 21 29 0
15 Marumi kumquat 11 11 11 9 17 15 3 12 11 9 12 6 15 17 34
liate orange was included in this group even if it repre-sents related genera. The last two genotypes, Severinia
buxifolia and Fortunella japonica, were not included in any
genetic clusters.
Discussion
Frequency, distribution, and polymorphism
From the 11 391 unigenes obtained from 37 000 EST [19], 1692 microsatellite sequences were identified. 14% of unigenes contain at list one microsatellite as already men-tioned for other citrus resources by Chen et al. [23]. This
Dendrogram representing the structure of genetic diversity and relationships observed between the 16 citrus genotypes aimed by the polymorphism of the 39 single locus EST-STMS markers
Figure 4
Dendrogram representing the structure of genetic diversity and relationships observed between the 16 citrus genotypes aimed by the polymorphism of the 39 single locus EST-STMS markers.
Table 5: Percentages of mappable loci in each progeny derived from all genotype combinations.
IN* Varieties 1 2 3 4 5 6 7 8 9 10 11 12 13 14
1 Clementine
2 Valencia late sweet orange 53
3 Cleopatra mandarin 46 55
4 Willow leaf mandarin 52 65 49
5 Morocco sour orange 50 51 55 64
6 Marsh grapefruit 58 56 55 65 56
7 Corsican citron 38 45 29 48 50 48
8 Mexican lime 53 60 50 60 62 63 43
9 Brazil sweet lime 71 78 68 74 77 80 63 66
10 Lisbon lemon 58 68 55 65 64 71 54 60 65
11 Sans pepins pummelo 53 57 44 60 59 63 34 55 66 63
12 Pink pummelo 57 55 42 58 63 55 32 53 67 64 47
13 Kindia combava 58 62 52 65 64 68 45 60 71 71 54 61
14 Pomeroy trifoliate orange 54 52 44 60 57 54 34 52 67 66 46 44 51
15 Marumi kumquat 56 60 44 65 59 62 39 63 75 68 54 55 62 46
value can be considered as quite high by taking account of the selection pressure that is applied on genes to maintain a lower diversity on the coding region. Nevertheless this frequency is higher than observed for dicotyledonous spe-cies ranged between 2.65% and 10.62% [41,42]. The fre-quency is dependent on the presence or not of redundancy but also related to the parameters used for SSRs screening in the database mining. Varshney et al [43] reported that the frequency was about 5% when the min-imum length for the detection of microsatellite was 20 nucleotides. In our study we were less drastic for the detec-tion of SSR. We have fixed this criterion to a minimum of 6 repetitions for dinucleotide repeats (12 base pairs in length) and 5 for the others (15 base pairs in length for tri-nucleotide). This difference could explain our higher fre-quency of SSRs in ESTs without apparently any effect on polymorphism (see below). Trinucleotide and dinucle-otide repeats were the most common SSRs in clementine ESTs (53.9% and 37.6% respectively). These values reflect the predominance of trinucleotide and dinucleotide repeats in many EST plant species [23,42-46] meanwhile a strong divergence was observed in a hexanucleotide repeat frequency. In many crops they were abundant with a frequency ranged between 13–26%. In clementine ESTs they represent only 2.4% of overall SSRs.
Functional characterization of ESTs performed with GO annotation showed that all the main functional categories were represented. This is in agreement with previous results [18,19]. The EST- SSRs showed similar distribu-tions in the GO Slim categories, and no functional group was overrepresented, indicating that there is no preference in the location of microsatellites with respect to function of the genes.
Relation between SSR polymorphism and phenotypic var-iation could be investigated in any MIPSs functional cate-gories. Moreover, the EST-SSRs could represent a convenient and cheap way for genes mapping when com-pared to RFLP technique and sequencing. Unfortunately, the frequency of gene containing a SSR sequence is rela-tively low (14%). Moreover less than 66% of the analyzed SSR were polymorphic. That means that less than 9% (14% × 66%) of the unigenes should be mapped by inter-nal SSR markers. Seven of the 47 couples of primers amplified DNA fragments from clementine that were larger than expected suggesting the presence of introns. It is possible that the non amplification for the 9 other prim-ers couples was also due to the presence of introns. From the position analyze of SSRs in ESTs we founded that the majority of SSRs were located in the UTR and mostly (75%) in the first hundred bases of the 5' cDNA extremity. This non equal distribution of SSRs along the cDNA sequence was also reported in other crops such as
rice, wheat and barley [17] but with some divergences. In barley, the majority of SSRs are present in the EST 3'-sequences with a high proportion of dimeric and tetra-meric SSRs despite tetratetra-meric SSRs are quite absent in Clementine ESTs. As clementine EST clones were single-pass sequenced from their 5' end and their main size were about 800 nucleotides [19], 3'end sequences of these ESTs were certainly under represented. The EST 3' end region was known to be also reached in microsatellites sequences [44,45]. As a consequence of this method of EST produc-tion, we believe that we have introduced a bias in the gen-eral distribution of the different SSRs along the clementine transcribed sequences. Nevertheless, few works described the abnormally high frequency of micro-satellite in 5'UTR regions of plant genes, and a lower abundance in coding region or 3'UTRs [43,45]. Our results seem to confirm this feature. This heterogeneous distribution of SSRs could be explained by the incidence of the SSR variability on the gene transcription and/or proteins structure integrity and function. In UTR, these microsatellites can be more variable without changing gene transcription and translation. The dominance of trimeric SSRs in TR can be explained by the suppression of non-trimeric SSRs in coding regions due to the risk of frame shift mutations that may occur when those micros-atellites alternate in size of one unit. In the case of trimeric repeats, it is worth to note that this kind of microsatellite was distributed homogenously along ESTs. It could be hypothesized that trinucleotide SSR variations has less impact than dinucleotide variations in the gene function-ality. Indeed, modification of the number of repeats of tri-nucleotide does not affect the reading frame. Furthermore, dimeric SSRs seem to be more polymorphic than trimeric ones and particularly in UTR with a putative higher allelic diversity combined with higher heterozygos-ity contributing to a powerful capacheterozygos-ity for distinctness. These differences between repeated unit types were atten-uated or disappeared when they were located in TR. How-ever, the importance of this result has to be attenuated since we do not have an equal representation for each sit-uation and a too low sampled marker set. Unfortunately, only 4 loci with di-SSRs in TR were detected when com-pared to 12 for trimeric SSRs and then the differences were not statistically significant.
EST-SSR markers for citrus diversity
Genetic diversity analysis and systematic is a classical application of SSR markers. For such application, the abil-ity of one marker to differentiate germplasm accessions is an important characteristic. Due to their higher polymor-phism, markers localized in UTR are more interesting than markers in TR. Moreover, better rate of accession identification have been obtained with dinucleotide markers (0.61) than with trinucleotide ones (0.29).
The organization of genetic diversity obtained with EST-SSR is in agreement with the knowledge of the genetic relationships between Citrus species previously reported by studies using different markers for systematic analyses: morpho-physiological characters [47], biochemistry [48], isozymes [49,50], genomic SSR markers [13,14], CAPS markers [51], or RFLP and RAPD markers [52]. Three major ancestral species: mandarins, pummelos and cit-rons are at the origin of many cultivated hybrids. As well, the parental relation of limes and lemons with citrons was clearly demonstrated by all these studies. It is in agree-ment with the strong differentiation we observed between acidic citrus group (lime-lemon-citron) and the pum-melo-mandarin (and their hybrids) group. Lemon is thought to be a natural hybrid of a citron and a lime [47,48], or a hybrid of citron and sour orange [51,53]. Our results seem to comfort the participation of sour orange because 15 alleles specific from this genotype were detected in lemon since 10 from citron and only 3 from lime were observed. Nevertheless, we can not certify the parental combination because in our sampling the lime and citron groups were limited to a unique variety. The diversity of these groups were not represented as described previously [13,14] and so few alleles from lemon (4) were still absent in the three putative parents of our study. Sev-eral hypotheses have also been proposed to explain the origin of Mexican limes: hybrids of citrons and papedas [48], tri-hybrid cross of citron, pummelo, and Microcitrus [47] or hybrid between citron and C. micrantha [51]. As for lemon the limited diversity of our analysis does not allow to discuss these hypotheses. Sour orange is a natural hybrid of a mandarin and a pummelo and in our analysis it is associated to the pummelo cluster. The participation of the two basic species, pummelo and mandarin, to the sweet orange formation is attested by the citrus taxonomy literature. However, some troubles still remain concern-ing the number of crosses between these two basic species. Barkeley et al. [14] suggested that sweet orange was derived from one or more backcrosses to the mandarin and then its genetic was makeup derived from mandarin and a small proportion from pummelo. Nicolosi et al. [51] have proposed a single cross based on equal propor-tions of alleles from mandarin and pummelo. Our results, with a common cluster of mandarin and sweet orange support the first hypothesis where sweet orange has a higher proportion of alleles from mandarin.
Compared to the phylogeny made with genomic SSR [14] a single difference was observed in our representation. It concerns the genetic diversity between citrus genera. The trifoliate orange (Poncirus trifoliata) joins the cluster of cit-ron-limes-lemon while kumquat (Fortunella japonica) remains genetically distant to other citrus. In previous work [14] about genetic relationships based on genomic SSRs, the situation was inverted wherein Fortunella species
were much more closely related to the four other Citrus (mandarins, pummelos, citrons and papedas), and the group of Poncirus accessions were very distant to all others. This difference could be related by the overrepresentation of kumquat diversity in our study or by a real difference of polymorphism rate between genomic SSRs and EST-SSRs. A similar study on a larger citrus sampling could be suita-ble to resolve this question. We can not compare the transferability of EST-SSR and genomic SSRs, but a large majority of EST-SSR markers could be used to investigate the genetic of citrus relatives. Indeed, only 10% of those EST-SSR markers gave unsuccessful amplification in Box orange (Severinia buxifolia).
EST-SSR marker for citrus genome mapping
Citrus have a juvenility period with around 5 years of duration limiting the possibility to work on a second gen-eration of hybrids. Consequently a lot of citrus genetic maps are established on F1 progenies at interspecific [25] and intergeneric level [26-31]. In order to evaluate the proportion of mappable EST-SSR markers we have calcu-lated the percentage of heterozygous markers informative for all combinations between 15 sexually compatible cit-rus genotypes, currently used or susceptible to be used in citrus genetic programs. Table 4 represents a tool for the selection of the sexual cross most suitable for a higher effi-ciency of mappable markers associated to the better situa-tion for comparison of both parental maps. Higher percentages of markers are available to map secondary species of cultivated citrus than to establish genetic maps of the three basic taxa (citron, mandarin, pummelo). As a result, a very low rate of EST-SSR markers is usable to make comparative genetic mapping between these three basic taxa: it is only 3% for Citron/Pummelo, 3% for Cit-ron/Mandarin (cv Cleopatra) and around 9% for Pum-melo (cv Pink)/Mandarin (cv Cleopatra).
It is clear that the best way to map the higher number of markers in a single progeny is to work on segregation of interspecific or intergeneric crosses. Citrus × Poncirus prog-enies have been highly investigated [11,54-59]. A recent work on EST genetic maps for Citrus sinensis and Poncirus
trifoliata was published [59]. For these maps the authors
have studied the segregation of 300 pairs of primers gen-erating EST-SSR markers on the intergeneric progeny sweet orange × trifoliate orange. Among them 141 mark-ers (47%) were mapped and distributed as following: 122 markers (40.7%) on sweet orange map, 59 (19.7%) on tri-foliate orange one and 40 (13.3%) were commune to both. These values were very similar to those proposed in our work (table 4 and 5) where for the same parental cross we have estimated at 52% of of mappable EST-SSR mark-ers and 40%, 29% and 17% respectively for orange, trifo-liate orange maps and commune markers. This mapping work was done with a majority of non abundant SSRs in
ESTs such as compound, tetra-, penta- and hexa-nucle-otide repeats. Di and tri-nuclehexa-nucle-otide SSRs represent only 26.7% of the total studied SSR markers.
On the base of the genetic differentiation observed in our cluster analysis, it appears that in this frame, interesting progenies should be obtained from F1 hybrids between citron and pummelo, citron and mandarin, as well between poncirus or kumquat with citron or mandarin or pummelo. Such intrageneric progenies should probably have more interest for further QTLs analysis of quality traits.
Conclusion
We have observed a differential repartition of dinucleic and trinucleic SSRs in the clementine ESTs with a high concentration in UTR and more precisely in the 5'initial region (but without a default of representation of 3'UTR regions du to the strategy of EST sequencing). The degree of SSR polymorphism is strongly modified by the utility of coding regions. These two elements suggest that the natural selection should limit the number and the poly-morphism of SSRs in coding translated sequences. EST-SSRs are useful for enhancing individual species map, but can be used as anchor probes for creating links between maps in comparative studies. With the appropriate prog-eny arise from crosses between interspecific or interge-neric hybrids as parents, we can expect to use up to 80% of the EST-SSR markers representing 9% of the global set of genes from all the identified function groups. We sug-gest to focus on the dinucleotide SSRs localised in UTR (more heterozygous and polymorphic) to increase the efficiency of mapping loci and then to reduce the cost of molecular marker screening between the parents of a progeny. In addition to mapping ESTs via microsatellite loci for locating putative functions, the EST-SSR markers developed in this study are powerful for the study of genetic diversity of citrus.
Authors' contributions
FLL carried out molecular genetic studies, data analysis and drafted the manuscript. GC and TA participated to generate results on genotyping. JT and XA generated the EST data base and did the annotation. PW and MT, were in charge of the clementine EST analysis in the framework Genoscope project. PO and RM coordinated the Geno-scope project and participated to the drafting of the man-uscript.
Acknowledgements
We thank the Collectivite Territorial de Corse for funding this study.
References
1. Tautz D: Hypervariability of simple sequences as a general
source of polymorphic DNA markers. Nucleic Acid Res 1989, 17:6463-6471.
2. Lanaud C, Risterucci AM, Pieretti I, Falque M, Bouet A, Lagoda PJL:
Isolation and characterization of microsatellites in
Theo-broma cacao L. Molecular Ecology 1999, 8:2141-2152.
3. Billotte N, Risterucci AM, Barcelos E, Noyer JL, Amblard P, Baurens FC: Development, characterisation, and across-taxa utility of
oil palm (Elaeis guineensis Jacq.) microsatellite markers.
Genome 2001, 44:413-425.
4. Bon MC, Hurard C, Gaskin J, Risterucci AM: Polymorphic
micro-satellite markers in polyploid Lepidium draba L. ssp. Draba (Brassicaceae) and cross-species amplification in closely related taxa. Molecular Ecology Notes 2005, 5:68-70.
5. Risterucci AM, Duval MF, Rohde W, Billotte N: Isolation and
Char-acterization of microsatellite loci from Psidium guajava L.
Molecular Ecology Notes 2005, 5:745-748.
6. Powell W, Morgante M, Andre C, Hanafey M, Vogel J, Tingey S, Rafal-ski JA: The comparison of RFLP, RAPD, AFLP and SSR
(mic-rosatellite) markers for germplasm analysis. Molecular
Breeding 1996, 2:225-238.
7. Gupta PK, Varshney RK: The development and use of
microsat-ellite markers for genetics and plant breeding with emphasis on bread wheat. Euphytica 2000, 113:163-185.
8. Plieske J, Struss D: Microsatellite markers for genome analysis
in Brassica. I. Development in Brassica napus and abundance in Brassicaceae species. Theor Appl Genet 2001, 102:689-694.
9. Cordeiro GM, Pan YB, Henry RJ: Sugarcane microsatellites for
the assessment of genetic diversity in sugarcane germplasm.
Plant Science 2003, 165:181-189.
10. Agrama HA, Tuinstra MR: Phylogenetic diversity and
relation-ships among sorghum accessions using SSRs and RAPDs.
African Journal of Biotechnology 2003, 2:334-340.
11. Kijas JMH, Thomas MR, Fowler JCS, Roose ML: Integration of
tri-nucleotide microsatellites into a linkage map of citrus. Theor
Appl Genet 1997, 94:701-706.
12. Froelicher Y, Dambier D, Costantino G, Lotfy S, Didout C, Beaumont V, Brottier P, Risterucci A-M, Luro F, Ollitrault P: Characterization
of microsatellite markers in Citrus reticulata Blanco. Molecular
Ecology Note 2007.
13. Luro F, Rist D, Ollitrault P: Evaluation of genetic relationships in
Citrus genus by means of sequence tagged microsatellites. In
Proceedings of the International Symposium on Molecular markers for char-acterizing genotypes and identifying cultivars in horticulture: 6–8 marsh 2000 Volume 546. Edited by: Doré C, Dosba F, Baril C. ISHS Acta Horticultarae; 2001:537-542.
14. Barkley NA, Roose ML, Krueger RR, Federici CT: Assessing
genetic diversity and population structure in a citrus germ-plasm collection utilizing simple sequence repeat markers (SSRs). Theor Appl Genet 2006, 112:1519-1531.
15. Thiel T, Michalek W, Varshney RK, Graner A: Exploiting EST
data-bases for the development and characterization of gene-derived SSR-markers in barley (Hordeum vulgare L.). Theor
Appl Genet 2003, 106:411-422.
16. Gao LF, Jing RL, Huo NX, Li Y, Li XP, Zhou RH, Chang XP, Tang JF, Ma ZY, Jia JZ: One hundred and one new microsatellite loci
derived from ESTs (EST-SSRs) in bread wheat. Theor Appl
Genet 2004, 108:1392-1400.
17. La Rota M, Kantety RV, Yu JK, Sorrells ME: Nonrandom
distribu-tion and frequencies of genomic and EST-derived microsat-ellite markers in rice, wheat, and barley. BMC Genomics 2005, 6:23.
18. Forment J, Gadea J, Huerta L, Abizanda L, Agusti J, Alamar S, Alos E, Andres F, Arribas R, Beltran JP, Berbel A, Blazquez MA, Brumos J, Canas LA, Cercos M, Colmenero-Flores JM, Conesa A, Estables B, Gandia M, Garcia-Martinez JL, Gimeno J, Gisbert A, Gomez G, Gonzalez-Candelas L, Granell A, Guerri J, Lafuente MT, Madueno F, Marcos JF, Marques MC, Martinez F, Martinez-Godoy MA, Miralles S, Moreno P, Navarro L, Pallas V, Perez-Amador MA, Perez-Valle J, Pons C, Rodrigo I, Rodriguez PL, Royo C, Serrano R, Soler G, Tadeo F, Talon M, Terol J, Trenor M, Vaello L, Vicente O, Vidal Ch, Zacarias L, Conejero V: Development of a citrus genome-wide EST
col-lection and cDNA microarray as resources for genomic stud-ies. Plant Mol Biol 2005, 57:375-391.
19. Terol J, Conesa A, Colmenero JM, Cercos M, Tadeo FR, Agustí J, Alós E, Andres F, Soler G, Brumos J, Iglesias DJ, Götz S, Legaz F, Argout X, Courtois B, Ollitrault P, Dossat C, Wincker P, Morillon R, Talon M:
quality, production and salinity tolerance. BMC Genomics 2007, 8:31.
20. Cordeiro GM, Casu R, McIntyre CL, Manners JM, Henry RJ:
Micros-atellite markers from sugarcane (Saccahrum spp.) ESTs cross transferable to erianthus and sorghum. Plant Science
2001, 160:1115-1123.
21. Scott KD, Eggler P, Seaton G, Rossetto M, Ablett EM, Lee LS, Henry RJ: Analysis of SSRs derived from grape ESTs. Theor Appl Genet 2000, 100:723-726.
22. Holton TA, Christopher JT, McClure L, Harker N, Henry RJ:
Identi-fication and mapping of polymorphic SSR markers from expressed gene sequences of barley and wheat. Mol Breed
2002, 9:63-71.
23. Chen C, Zhou P, Choi YA, Huang S, Gmitter FG: Mining and
char-acterizing microsatellites from citrus ESTs. Theor Appl Genet
2006, 112:1248-1257.
24. Ollitrault P, Luro F: Citrus. In Tropical plant breeding Edited by: Char-rier A, Jacquot M, Hamon S, Nicolas D. Montpellier: CIRAD; 2001:55-77.
25. Oliveira RP, Cristofani M, Vildoso CIA, Machado MA: Genetic
link-age maps of 'Pêra' sweet orange and 'Cravo' mandarin with RAPD markers. Pesquisa Agropecuária Brasileira 2004, 39:159-165.
26. Ruiz C, Asins MJ: Comparison between Poncirus and Citrus
genetic linkage maps. Theor Appl Genet 2003, 106:826-36.
27. Bernet GP, Margaix C, Jacas J, Carbonell EA, Asins MJ: Genetic
anal-ysis of citrus leafminer susceptibility. Theor Appl Genet 2005, 110:1393-400.
28. Weber CA, Moore GA, Deng Z, Gmitter FG: Mapping freeze
tol-erance quantitative trait loci in a Citrus grandis × Poncirus trifoliata F1 pseudo-testcross using molecular markers. J
Amer Soc Hort Sci 2003, 128:508-514.
29. Siviero A, Cristofani M, Machado MA: QTL mapping associated
with rooting of stem cuttings from Citrus sunki × Poncirus trifoliate hybrids. Crop breeding and Applied Biotechnology 2003, 3:83-88.
30. Siviero A, Cristofani M, Furtado EL, Garcia AAF, Coelho ASG, Mach-ado MA: Identification of QTLs associated with citrus
resist-ance to Phytophthora gummosis. Journal of applied genetics 2006, 47:23-28.
31. Lyon MT, Federic CT, Kacar Y, Chen C, O'Malley D, Chaparro JX, Gmitter FG, Roose ML: SSR-Based Linkage Maps For Sweet
Orange And Trifoliate Orange [abstract]. Plant & Animal
Genome XVth Conference, January 13–17, 2007 Town & Country Conven-tion Center San Diego, CA .
32. Transcript reconstruction and variation analysis manage-ment system (StackPACK™) [http://www.egenetics.com/stack
pack.html]
33. MIcroSAtellite identification tool (MISA)
[http://pgrc.ipk-gatersleben.de/misa]
34. Rozen S, Skaletsky H: Primer3 on the WWW for general users
and for biologist programmers. In Bioinformatics methods and
pro-tocols: methods in molecular biology Edited by: Krawetz S, Misener S. Totowa: Humana Press; 2000:365-386.
35. Berardini TZ, Mundodi S, Reiser L, Huala E, Garcia-Hernandez M, Zhang P, Mueller LA, Yoon J, Doyle A, Lander G, Moseyko N, Yoo D, Xu I, Zoeckler B, Montoya M, Miller N, Weems D, Rhee SY:
Func-tional Annotation of the Arabidopsis Genome Using Con-trolled Vocabularies. Plant Physiol 2004, 135:745-755.
36. Conesa A, Gotz S, Garcia-Gomez JM, Terol J, Talon M, Robles M:
Blast2GO: a universal tool for annotation, visualization and analysis in functional genomics research. Bioinformatics 2005, 21:3674-3676.
37. Doyle JJ, Doyle JL: A rapid DNA isolation procedure for small
quantities of fresh leaf tissue. Phytochem Bull 1987, 19:11-15.
38. Chalhoub BA, Thibault S, Laucoou V, Rameau C, Höfte H, Cousin R:
Silver staining and recovery of AFLP amplification products on large denaturing polyacrylamide gels. BioTechniques 1997, 22:216-220.
39. Dice L: Measure of the amount of ecologic association
between species. Ecology 1945, 26:297-302.
40. Saitou N, Nei M: The neighbor-joining method: A new method
for reconstructing phylogenetic trees. Mol Biol Evol 1987, 4:406-425.
41. Kumpatla SP, Mukhopadhyay S: Mining and survey of simple
sequence repeats in expressed sequence tags of dicotyledo-nous species. Genome 2005, 48:985-998.
42. Poncet V, Rondeau M, Tranchant C, Cayrel A, Hamon S, de Kochko A, Hamon P: SSR mining in coffee tree EST databases:
poten-tial use of EST-SSRs as markers for the Coffea genus. Mol Gen
Genomics 2006, 276:436-449.
43. Varshney RK, Graner A, Sorrells ME: Genetic microsatellite
markers in plants: features and applications. Trends Biotechnol
2005, 23:1.
44. Sharma PC, Grover A, Kahl G: Mining microsatellites in
eukari-otic genomes. Trends biotechnol 2007, 25:11.
45. Berube Y, Zhuang J, Rungis D, Ralph S, Bohlmann J, Ritland K:
Char-acterization of EST-SSRs in lobolly pine and spruce. Tree
Genetics and Genomes 2007, 3:251-259.
46. Gao LF, Tang JF, Li HW, Jia JZ: Analysis of microsatellites in
major crops assessed by computational and experimental approaches. Mol Breed 2003, 12:245-261.
47. Barrett HC, Rhodes AM: A numerical taxonomic study of
affin-ity relationships in cultivated Citrus and its close relatives.
Syst Bot 1976, 1:105-136.
48. Scora RW: On the history and origin of Citrus. Bull Torr Bot Club 1975, 102:369-375.
49. Ollitrault P, Jacquemond C, Dubois C, Luro F: Citrus. In Genetic diversity of cultivated plants Edited by: Montpellier: CIRAD. Hamon P, Seguin M, Perrier X, Glaszmann X; 2003:193-197.
50. Herrero R, Asins MJ, Carbonell EA, Navarro L: Genetic diversity
in the orange subfamily Aurantioideae. I. Intraspecifies and intragenus genetic variability. Theor Appl Genet 1996, 92:599-609.
51. Nicolosi E, Deng ZN, Gentile A, La Malfa S, Continella G, Tribulato E:
Citrus phylogeny and genetic origin of important species as investigated by molecular markers. Theor Appl Genet 2000, 100:1155-1166.
52. Federici CT, Fang DQ, Scora RW, Roose ML: Phylogenetic
rela-tionships within the genus Citrus (Rutaceae) and related gen-era as revealed by RFLP and RAPD analysis. Theor Appl Genet
1998, 94:812-822.
53. Gulsen O, Roose ML: Chloroplast and nuclear genome analysis
of the parentage of lemons. J Amer Soc Hort Sci 2001, 126:210-215.
54. Jarrell DC, Roose ML, Traugh SN, Kupper RS: A genetic map of
Citrus based on the segregation of isozymes and RFLPs in an
intergeneric cross. Theor Appl Genet 1992, 84:49-56.
55. Durham RE, Liou PC, Gmitter FG Jr, Moore GA: Linkage of
restric-tion fragment length polymorphisms and isozymes in citrus.
Theor Appl Genet 1992, 84:39-48.
56. Cai Q, Guy CL, Moore GA: Extension of the linkage map in
cit-rus using random amplified polymorphic DNA (RAPD) markers and RFLP mapping of cold-acclimation-responsive loci. Theor Appl Genet 1994, 89:606-614.
57. Luro F, Lorieux M, Laigret F, Bové JM, Ollitrault P: Genetic
map-ping of an intergeneric Citrus hybrid using molecular mark-ers. Fruits 1994, 49:404-408.
58. Moore GA, Tozlu I, Weber CA, Guy CL: Mapping quantitative
trait loci for salt tolerance and cold tolerance in Citrus grandis (L.) Osb. × Poncirus trifoliata(L.) Raf. Hybridpopulations. Acta
Horticulturae 2000, 535:37-45.
59. Chen C, Bowman KD, Choi Ya, Dang PM, Rao MN, Huang S, Soneji JR, McCollum TG, Gmitter FG: EST-SSR genetic maps for Citrus
sinensis and Poncirus trifoliate. Tree Genetics & Genomes 2008, 4:1-10.