Analysis of Hurricane Wind Load Safety Factors
by
Nora A. Humphrey B. S., Civil Engineering (1998) Massachusetts Institute of Technology
Submitted to the Department of Civil and Environmental Engineering in Partial Fulfillment of the Requirements for the Degree of Master of Engineering in Civil and Environmental Engineering
at the
Massachusetts Institute of Technology June 1999
C 1999 Nora A. Humphrey. All rights reserved. The author hereby grants to MIT permission to reproduce
and to distribute publicly paper and electronic copies of this thesis document in whole or in part.
Signature of A uthor... . ... ....
Department of Civil and Environmental rngineering May 7, 1999
C ertified b y ... ...
Jerome Connor Pr fessor of Civil and Environmental Engineering
SIThesis Supervisor
A ccep ted b y ... ...
Andrew J. Whittle Chairman, Departmental Committee on Graduate Studies
Analysis of Hurricane Wind Load Safety Factors
by
Nora A. Humphrey
Submitted to the Department of Civil and Environmental Engineering on May 7, 1999 in Partial Fulfillment of the
requirements for the Degree of Master of Engineering in Civil and Environmental Engineering
ABSTRACT
An analysis was performed on currently available wind speed data to determine the hurricane importance factor which results in a 1.3 safety factor for a mean recurrence interval of 2000 years. The current value specified in ASCE 7-95 is 1.05. This, however, results in a 1.3 safety factor in hurricane prone regions for a mean recurrence interval of 500 years. The mean recurrence interval corresponding to a 1.3 safety factor in extra-tropical regions is 2000 years. The current hurricane importance factor does not provide equal levels of safety in hurricane prone regions and extra-tropical regions.
This report recommends a modification to the current hurricane importance factor to 1.14. This value was obtained by averaging the hurricane importance factors for a 1.3 safety factor and a 2000 year mean recurrence interval for the mileposts along the East Coast of the United States. Increasing the hurricane importance factor brings the safety factor for hurricane prone regions closer to that for extra-tropical regions.
Thesis Supervisor: Jerome Connor
Acknowledgements
The author would like to recognize the work done by N. Alan Heckert, Emil Simiu, and Timothy Whalen at the National Institiute of Standards and Technology. Without their data files, available online, this project would not have been feasible.
Table of Contents List of Figures...--...--- . 5 List of Tables... ...---.... 6 1.0 Introduction... .- - - - -... 7 2.0 Motivation... 8 3.0 Background... ... . 12
3.1 Development of W ind Load Criteria... 12
3.2 Probability D istributions... 15
4.0 Current Research... 17
4.1 Short vs. Long Mean Recurrence Intervals... 17
4.2 Hurricane Prone vs. Extra-tropical Regions... 17
4.3 Analysis... 17 5.0 Results...---... . --... 21 5.1 Data Acquision... ... .. 21 5.2 Analysis... 21 6.0 Future Work... 25 7.0 Conclusion... 27 Appendix A... -... 28
Data and Program File Acquisition Appendix B... . ... 30
Milepost Data Analysis Appendix C... ... 40
List of Figures
Figure 1.1... 7 Hurricane Structure
Figure 2.1... 10
Population Change in Atlantic Coastal Counties (1960-1990)
Figure 2.2... 11 Population Change in Gulf of Mexico Coastal Counties (1960-1990)
Figure 3.1... 13
United States Weather Stations
Figure 3.2... 14
ASCE 7-95 Basic Wind Speed Map
Figure 4.1... 18
East Coast Milepost Map
Figure 5.1... 22 Hurricane Importance Factor (Averaging All Values)
Figure 5.2... 23
Hurricane Importance Factor (Averaging Over Range, 25 to 43 m/s)
Figure 5.3... 24 Hurricane Importanct Factor (Milepost 1450)
List of Tables
Table 2.1... 9
Population Growth of East Coast States
Table 3.1... 15
1.0 Introduction
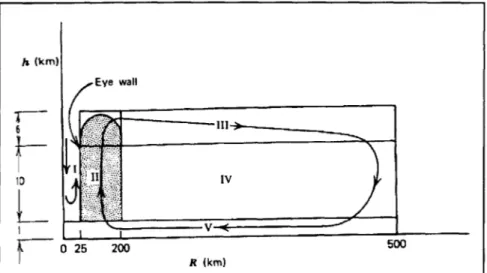
Hurricanes, or tropical cyclones, are formed when warm moist air at the ocean's surface rises and condenses, creating a low pressure area. Air from the surrounding high pressure areas moves to fill the void. The circular tails, characteristic of hurricanes, are formed by coriolis acceleration. Therefore, hurricanes generally form between the five and twenty latitude circles' where the temperature and coriolis acceleration provide the driving force.
The structure of a typical hurricane is shown in Figure 1.1. Region I is the eye, a circular area of calm, dry winds at the center of the hurricane. Region II is the area of vertical air
movement, where the moist warm air rises to create clouds. This is the region with the most intense rainfall and heat output. Region III is the outflow layer. The air then settles through region IV, until it reaches region V where it moves toward the eye wall.
h (km) Eye wall 6 V 0 25 200 500 R (kin)
Figure 1.1 Hurricane Structure2
While air velocities reach near zero at the eye center, hurricane winds reach surface velocities of 70 m/s2. This, along with the storm surge and heavy rainfall, contributes to the
destructive effects of a hurricane.
'Simiu, Emil. Wind Effects on Structures: An Introduction to Wind Engineering. 2nd Ed.
(New York: John Wiley & Sons, 1986) 20.
2.0 Motivation
Hurricane damage costs millions each year to repair. From 1980-1989, insurance companies spent over $7 billion on hurricane damage. This is approximately one third of the total amount, $23 billion, on wind-related catastrophic events in the United States during that time3. When Hurricane Hugo struck the Virgin Islands, Puerto Rico, and South Carolina in 1989,
it caused over $4 billion in insured losses4. On top of this, $95 million was spent in the month following the hurricane in South Carolina alone for the repair or replacement of roads, bridges, water control facilities, and public buildings5.
Hurricanes have killed an average of 47 people in the United States each year since 1940, and previous years show higher numbers6. Despite this, coastal populations are increasing. In the ten years prior to Hurricane Hugo(1980-1989), there was a 64 percent increase in insured property along the east coast of the United States. The structural value of these residential and commercial properties was $1.86 trillion7.
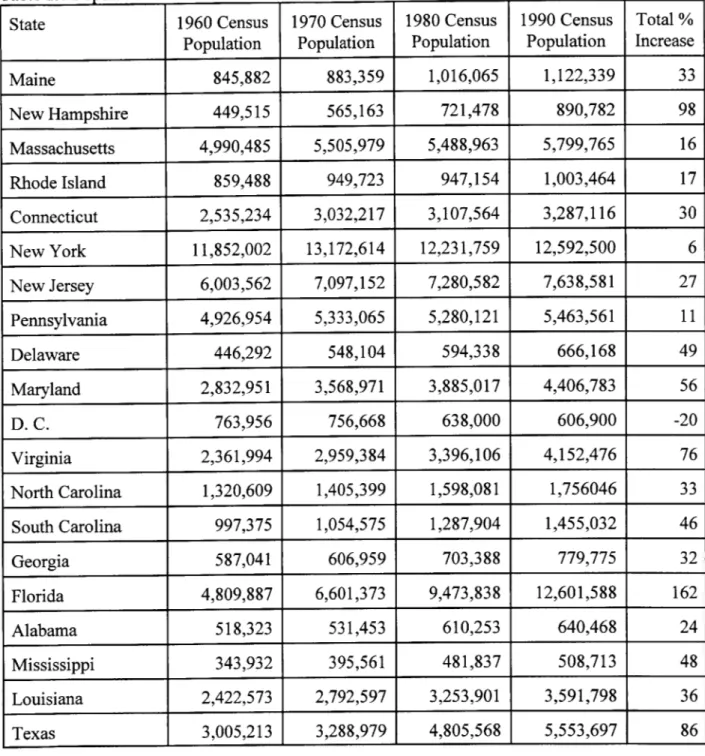
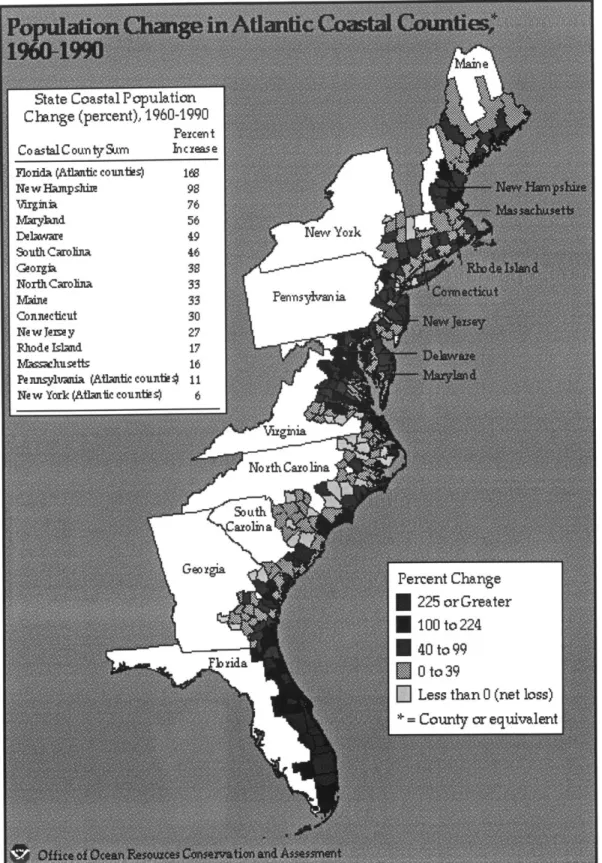
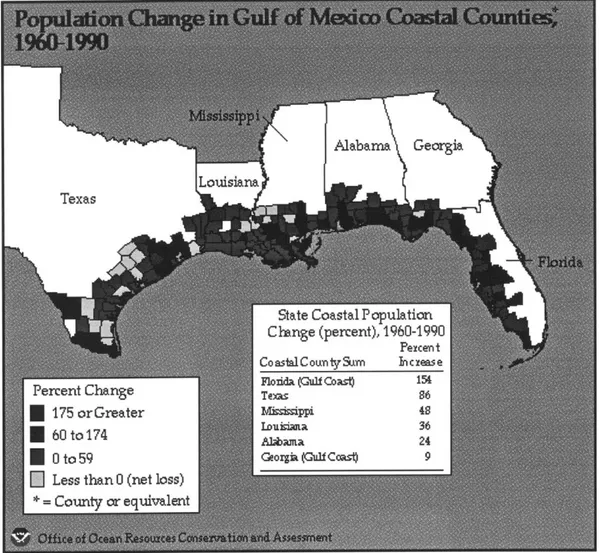
Every east coast state has increased in population since 1960. Only the District of Columbia has lost population during this time. Table 2.1 shows the results of each decade's census. Florida, the area with the highest design wind speeds, has the highest percentage change in population. Texas, another area frequented by hurricanes, has grown in population by over eighty percent. Figure 2.1 shows the percent population increase in each county along the east coast of the United States. Figure 2.2 shows same information for the gulf coast.
3National Academy of Sciences, Panel on the Assessment of Wind Engineering Issues in
the United States, Wind and the Built Environment: U.S. Needs in Wind Engineering and Hazard Mitigation (Washington, D.C.: National Academy Press, 1993) 11.
4National Academy of Sciences, 1.
5National Academy of Sciences, 10.
6National Lightning Safety Institute, www.lightningsafety.com/nlsi_lls/stat2.html.
Table 2.1 Population Growth of East Coast States
State 1960 Census 1970 Census 1980 Census 1990 Census Total % Population Population Population Population Increase
Maine 845,882 883,359 1,016,065 1,122,339 33 New Hampshire 449,515 565,163 721,478 890,782 98 Massachusetts 4,990,485 5,505,979 5,488,963 5,799,765 16 Rhode Island 859,488 949,723 947,154 1,003,464 17 Connecticut 2,535,234 3,032,217 3,107,564 3,287,116 30 New York 11,852,002 13,172,614 12,231,759 12,592,500 6 New Jersey 6,003,562 7,097,152 7,280,582 7,638,581 27 Pennsylvania 4,926,954 5,333,065 5,280,121 5,463,561 11 Delaware 446,292 548,104 594,338 666,168 49 Maryland 2,832,951 3,568,971 3,885,017 4,406,783 56 D.C. 763,956 756,668 638,000 606,900 -20 Virginia 2,361,994 2,959,384 3,396,106 4,152,476 76 North Carolina 1,320,609 1,405,399 1,598,081 1,756046 33 South Carolina 997,375 1,054,575 1,287,904 1,455,032 46 Georgia 587,041 606,959 703,388 779,775 32 Florida 4,809,887 6,601,373 9,473,838 12,601,588 162 Alabama 518,323 531,453 610,253 640,468 24 Mississippi 343,932 395,561 481,837 508,713 48 Louisiana 2,422,573 2,792,597 3,253,901 3,591,798 36 Texas 3,005,213 3,288,979 4,805,568 5,553,697 86
Figure 2.2 Population Change in Gulf of Mexico Coastal Counties (1960-1990)
As coastal populations continue to increase, structures must be built which suffer less damage during severe hurricanes. Many of the insurance payments are for building that lose their roofs to the wind and then their interiors to the heavy rainfall. By improving the safety of
3.0 Background
3.1 Development of Wind Load Criteria
A long history exists of load factors in structural design. Historically, all of the loads
were added together and then a single safety factor was applied. By 1972, some separation had occurred: ACI 318-63 1.5D+1.8L (eq. 3.1) 1.25[D+L+(W or E)] 0.9D+1.1(W+E) ACI 318-71 1.4D+1.8L (eq. 3.2) 0.75(1.4D+1.7L+1.7WT 5 0 ys,) 0.9D+1.3WT=50 yrs
In 1980, the results of a study by the United States Department of Commerce and the National Bureau of Standards were published. The study included numerous materials and load
combinations. Equations were generated for ultimate limit states using a reference period of 50 years. Based on the results, the study recommended load factors which could be applied to all types of structural materials:
1.4D 1.2D+1.6L 1.2D+1.6S+(0.5L or 0.8W) (eq. 3.3) 1.2D+1.3W+0.5L 1.2D+1.5E+(0.5L or 0.2S) 0.9D+(1.3W or 1.5E)
8Ellingwood, B. et al. U.S. Department of Commerce / National Bureau of Standards,
Development of a Probability Based Load Criterion for American National Standard A58: Building Code Requirements for Minimum Design Loads in Buildings and Other Structures (Washington: U.S. Government Printing Office, 1980).
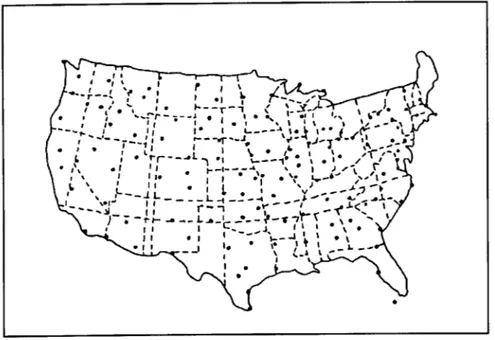
The 1980 wind results were based on almost 100 years of wind data gathered from 129 different wind stations across the country (Figure 3.1). Since there are very few stations along the east coast, curves were completed using a Monte Carlo simulation. The result was the
current basic wind speed map.
Figure 3.1 United States Weather Stations
The Basic Wind Speed Map (Figure 3.2) shows wind speeds of from 54 to 67 m/s along the east coast. These are lower than the typical hurricane windspeed of 70 m/s. To compensate for this, and because the probability distributions for extreme windspeeds in hurricane prone and extra-tropical regions are different, a hurricane importance factor of 1.05 was specified in the
1993 edition of the code. In hurricane prone regions, this is applied at the oceanline and
decreases linearly until a distance of 100 miles inland where it reaches 1.009. Multiplying by the maximum basic windspeed results in a hurricane wind speed of 70.35 m/s, scarcely larger than the wind speed in a typical hurricane, at the coast.
9Marshall, Richard D. and Kishor C. Mehta, Guide to the Use of the Wind Load Provisions of ASCE 7-95 (Reston: ASCE Press, 1998) 88.
90(40) 100(45) 110(49) 120(54) 130(58) 130(58)
140(63) Special Wind Region
.F Population Center Location V mph (m/s) 50(67) 140(63) Hawaii 105 (47) Puerto Rico 125 (56) Guam 170 (76) Virgin Islands 125 (56) American Samoa 125 (56) 150(67)'
Figure 3.2 ASCE 7-95 Basic Windspeed Map
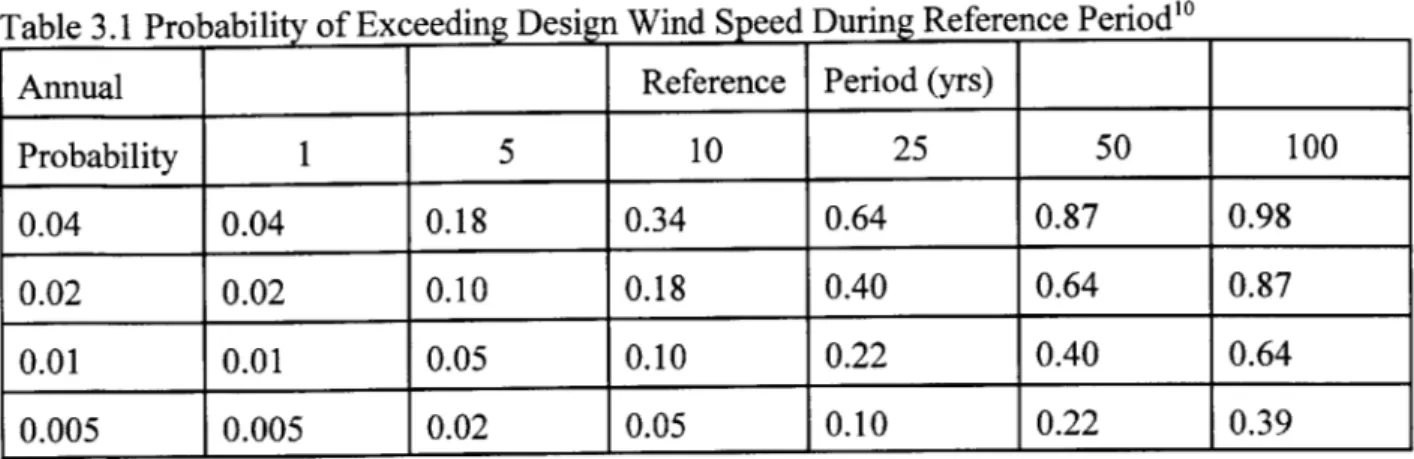
Also, the probability of exceeding the 50 year wind exceeds 0.50 in the 50 year lifespan of a building (Table 3.1). This is true across the country, not only in hurricane prone regions. But, for hurricane prone regions the probability of exceeding the 50 year wind, 70.35 m/s, is higher than 0.02 in any given year since a full blown hurricane reaches this value.
Table 3.1 Probability of Exceeding Design Wind Speed During Reference Period'
Annual Reference Period (yrs)
Probability 1 5 10 25 50 100 0.04 0.04 0.18 0.34 0.64 0.87 0.98 0.02 0.02 0.10 0.18 0.40 0.64 0.87 0.01 0.01 0.05 0.10 0.22 0.40 0.64 0.005 0.005 0.02 0.05 0.10 0.22 0.39 3.2 Probability Distributions
Numerous different probability distributions have been used to model wind speeds. Winds are historically assumed to be described probabilistically by extreme largest value
distributions". In order of increasing tail length, these distributions are the reverse Weibull, the Gumbel, and the Frdchet distributions. The reverse Weibull is the only distribution in this group which has a limited upper tail.
The 1972 building code assumed that extreme winds in extratropical regions are
"described by a Frechet distribution with tail length parameter y=9"2. An attempt was made by Simiu et al., in 1978, to fit a Gumbel model to the data because it has a shorter upper tail". The results were better, but led to unrealistically high probability estimates. Both the Frdchet and Gumbel distributions estimate credible wind speeds with mean return periods under 50 years, but
0American Society of Engineers, Minimum Design Loads for Buildings and Other
Structures: ASCE 7-95 (New York: American Society of Civil Engineers, 1996) 154.
"Simiu, Emil, Estimation of Extreme Wind Speeds, (Gaithersburg: Building and Fire Research Laboratory / National Institute of Standards and Technology) 113.
12Gross, John, Alan Heckert, James Lechner, and Emil Simiu, Novel Extreme Value
Estimation Procedures: Application to Extreme Wind Data, (Netherlands: Kluwer Academic Publishers, 1994) 140.
"Heckert, N. A. and E. Simiu, "Extreme Wind Distribution Tails: A "Peaks Over Threshold" Approach, Journal of Structural Engineering, May 1996, 593.
grow increasingly unreliable as the mean return period increases14. Winds have finite peak velocities, and this was not reflected in the probability distributions. Hence, recently wind speeds have been fitted to reverse Weibull distributions which have finite upper tails.
Studies are now underway to represent wind load factors statistically, rather than continuing the use of the current factors which are based on the limited 1980 laboratory results and engineering assumptions. From the 1980 study, the wind load factor is:
(= (VRuN 50)2 (eq 3.4)
VRu is the mean return period of the ultimate load. Depending on the geographic location of the wind speed measurements, this factor ranges from 1.24 to 1.6815. The average is 1.42, greater than the value of 1.3 specified in ASCE 7-95. These results are based on a Gumbell distribution, which according to results of a study by Gross et al., in 1995, overestimates extreme winds corresponding to long mean return periods16. Their results, though limited by the small sample size of the data, suggest that the reverse Weibull distribution models extreme winds better than the Gumbell distribution. Their assumption that "the extreme wind distributions are reverse Weibull, with shape parameter y 5 ([Generalized Pareto Distribution (GPD)] tail length parameter c=-0.2) and site-dependent location and scale parameters" 7, yields wind load factors with an average value of z 1.4. This is slightly less than the results generated by the Gumbell distribution and more closely approximate Ellingwood's 1980 test results.
It is important from both an economic and life-safety perspective to choose a wind load factor such that the probability of the nominal ultimate load occurring is low. While this is mentioned in each version of the ASCE code, construction methods and materials have changed. Heckert and Simiu's 1996 report validated the current wind load factor for non-hurricane winds.
14Gross, J. L., N. A. Heckert, J. A. Lechner, and E. Simiu, "A Study of Optimal Extreme
Wind Estimation Procedures", Proceedings: 9th International Conference on Wind Engineering,
Vol 1, (New Delhi, 1995) 69.
'5Gross et al. (1995) 72.
16Gross et al. (1995) 73.
4.0 Current Research
4.1 Short vs. Long Mean Recurrence Intervals
As discussed previously, the current wind load factor was established based on a 50 year mean recurrence interval (MRI). Recently, analysis has shown that it is sufficient in extra-tropical regions for nominal MRIs up to 100,000 years but only 500 years in hurricane prone regions. Structural designs are governed by the larger MRI values, rather than the 50 year MRI
which the current code is based on'". This may explain the large losses sustained in hurricane events.
Nominal MRIs do not include directional effects, while MRIs do. Most analysis to date has been done with nominal MRIs, which are lower than MRIs by a factor of 3-15. In hurricane prone regions, structural loads for a 50 year MRI are smaller than loads where the nominal MRI equals the MRI. However, Heckert and Simiu's 1998 results show that this is not necessarily true for large MRIs. Since these are the loads that govern design, current wind loads standards may be only marginally conservative.
4.2 Hurricane Prone vs. Extra-tropical Regions
According to a study by Heckert, Simiu, and Whalen in 1998, MRIs in extra-tropical regions are satisfactory, but MRIs in hurricane prone regions are one to two orders of magnitude shorter19. This results from Ellingwood's 1980 assumption that extra-tropical and hurricane wind load safety factors can be based on the same statistics. As a result, structures in hurricane prone regions are at higher risk for damage than structures in extra-tropical regions.
4.3 Analysis
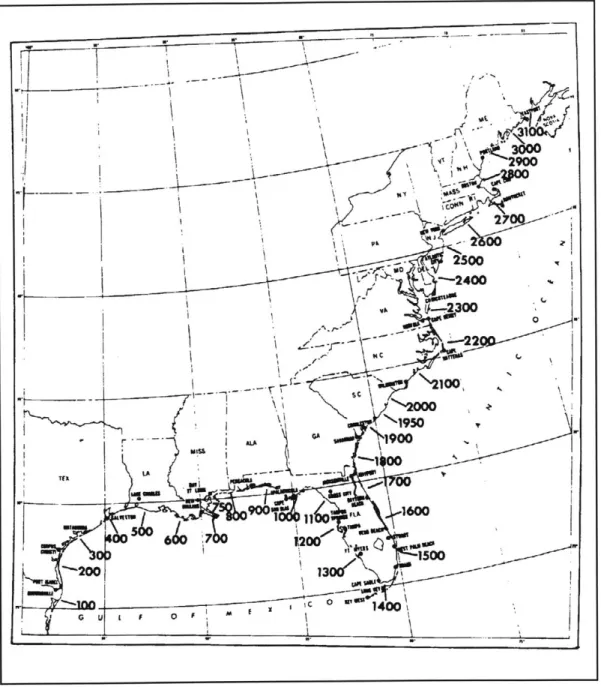
The east coast of the United States is approximately 3100 miles long. Data exists for 999 simulated storms at each milepost from 150-2850 (Figure 4.1). This data can be accessed online through the National Institute for Standards and Technology as described in Appendix A.
18Heckert, N. A. and Emil Simiu, "Ultimate Wind Loads and Direction Effects in
Non-Hurricane and Non-Hurricane-Prone Regions", Environmetrics (vol. 9, 1998) 443.
19Heckert, N. Alan, Emil Simiu, and Timothy Whalen, "Mean Recurrence Intervals of
Ultimate Wind Loads", 17th International Conference on Offshore Mechanics and Arctic
Figure 4.1 East Coast Milepost Map
The windspeed data includes information on the peak windspeed in 16 different
directions and overall for 999 storms simulated in 1980 using a Monte Carlo simulation. Files exist for the mileposts along the east coast and for cities throughout the United States. This data was used in the development of the ASCE 7-83 and ASCE 7-93 Standard Wind Speed maps.
The first line of each data file is the milepost identifier. This is followed by the estimated annual rate of occurrence of hurricanes at this milepost (URATE) and the number of simulated storms, 999 for each milepost20. After this introductory information is the data. Each data line contains 16 values which represent the maximum one-minute hurricane speeds, in knots, at 10 m above the ground over open terrain at the coastline. The values are for each direction from NNE to N. The next number is the maximum wind speed in any direction, and the final number is the storm identification number.
NIST has been studying whether the "peaks over threshold" method can be used for the
estimation of extreme wind loads. In 1994, Gross et al. studied three methods for estimating the loads: Pickands, Conditional Mean Exceedance (CME), and de Haanl. Their results eliminated the Pickands method and recommend the de Haan method over the CME method.
NIST Technical Note 1416 concludes that wind load factors in hurricane prone regions
should be larger than the current [1.3 * (1.05)2] factor 22. This study compared the reverse
Weibull distribution to other data sets compiled using probability distributions with infinite upper tails. The reverse Weibull data set varied the least from 1.3, the value currently required in codes23. The ration of 2000 year speeds to 50 year speeds ranged from 1.3 to 1.5 for the reverse Weibull distribution and from 1.7 to 2.25 for the other distributions. All of this supports the theory that the current hurricane wind load provisions are inadequate.
The study was continued to determine what the wind load provisions should be. The wind load factor, in hurricane-prone regions, is:
LR = [XR / (F*X50)]2 (eq. 4.1) F is specified as 1.05.
20README file, accessible as described in Appendix A.
2 1Gross, J. L., N. A. Heckert, J. A. Lechner, and E. Simiu, "Extreme Winds Estimation by
'Peaks Over Threshold' and Epochal Methods", Structures Congress XII, (vol. 2, 1994) 1475.
2 2Heckert, N. A., E. Simiu, and T. Whalen, Estimates of Hurricane Wind Speeds by the
'Peaks Over Threshold' Method (NIST Technical Note 1416) iii. 2
Simulated wind speeds display great variability above 43 m/s and below 25 m/s because of the small sample sizes. Whalen plotted the threshold windspeed vs. the load factor for 44 U.S. cities in extra-tropical regions and the 55 mileposts in hurricane prone regions along the east coast2 . For the mileposts, L500 is close to or higher than the standard design value of 1.3. In
contrast, the city data shows that L5 00 is significantly lower than 1.3, with L20 0 0 approaching that
value.
This supports the conclusion that structural safety in hurricane prone regions is less than in extra-tropical regions. As mentioned previously, the data was simulated based on a small number of real storms monitored at the wind stations throughout the country. However, this set of data was used to create the current ASCE Standard, so these results are comparable.
The report concludes that the load factor, 1.3, in extra-tropical regions "corresponds to nominal ultimate wind loads judged to have sufficiently long mean recurrence intervals"2 . However, in hurricane prone regions this factor is much lower, even when the 1.052 hurricane importance factor is included. The factors are so low in hurricane prone regions that they correspond to a ten percent probability of exceeding the nominal ultimate wind load during the
50 year lifetime of a structure. In contrast, results for extra-tropical regions show a three percent
probability during the 50 year lifetime of a structure.
2 4Whalen, Timothy, Probabilistic Estimates of Design Load Factors for Wind-Sensitive
Structures Using the "Peaks Over Threshold" Approach (NIST Technical Note 1418) 4.
25NIST
5.0
Results
5.1 Data Acquisition
The wind speed data used in the previous reports is accessible through the National Institute for Standards and Technology's website, as described in Appendix A. Because the
safety factor for extra-tropical regions was deemed adequate, it was only necessary to download the data files and analysis program for hurricane prone regions. This consisted of 55 data files, two FORTRAN77 programs, and a readme file. The site is maintained by Emil Simiu.
The format for the data files was described earlier. The two analysis programs are "hurrdhn.f' and "hurrldf.f"26. The latter, "hurrdldf.f' calculates the wind load safety factor for four mean recurrence intervals: 50, 2,000, 10,000, and 100,000 years. The mean recurrence interval for the current 1.3 safety factor is 2,000 years in extra-tropical regions. The program was therefore modified to analyze 50, 100, 500, and 2,000 mean recurrence intervals. The resulting output was the factor of safety:
FS = F2 * LF (eq. 5.1)
In the above equation, FS is the factor of safety, F is the hurricane importance factor, and LF is the load factor. The current values for F, LF, and FS are 1.05, 1.3, and 1.43325 respectively.
100 years represents a one percent chance of the event occurring in a given year. A storm with a 500 year mean recurrence interval has a 0.20% chance of occurring in a given year; a storm with
a 2000 mean recurrence interval has a 0.05% chance of occurring. 500 years corresponds to approximately a 1.3 safety factor in hurricane regions, given F=1.05.
5.2 Analysis
Once the safety factors had been obtained, they were entered into a spreadsheet to
calculate the two possibilities. One, the hurricane importance factor (F) given that the load factor (LF) equaled 1.3 and, two, LF given F = 1.05. This represents the two currently considered
methods for imporving safety in hurricane prone regions: increasing F and increasing LF for these areas. However, because the code already contains the hurricane importance factor, F, and
26Written by James Filliben, Statistical Engineering Laboratory / National Bureau of
the factor of safety is simply a function of these two values, there is little reason to modify LF for these areas. Therefore, this report is concerned with modifing the hurricane importance factor, F. Fixing LF at 1.3 resulted in an average F value and standard deviation for each of the 55
mileposts. The overall average and standard deviation for F was also calculated. These values are included for each mean recurrence interval as Appencix C.
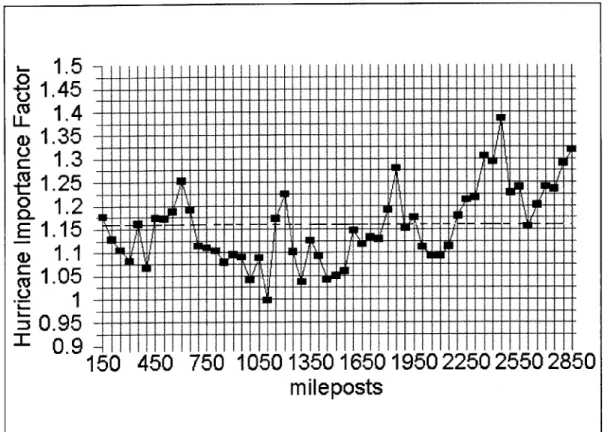
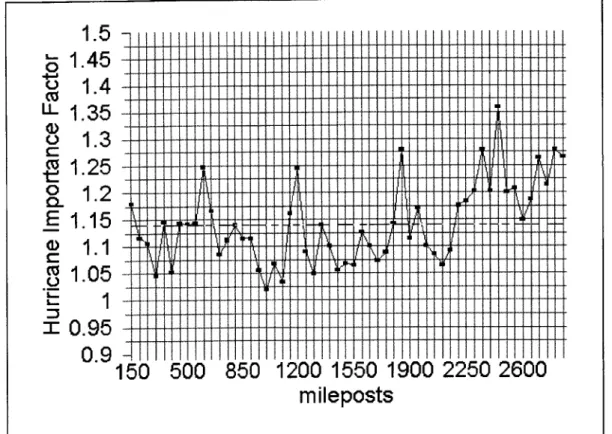
Averaging all of the data resulted in a hurricane importance factor of 1.16 with a standard deviation of 0.10 for a mean recurrence interval of 2000 years and a safety factor of 1.03. Figure
5.1 shows the overall average for each milepost. Even the low end of this range, 1.06, is higher
than the current hurricane importance factor of 1.05.
Figure 5.1 Hurricane Importance Factor (Averaging All Values)
However, results below 25 m/s and above 43 m/s have significant variability because of the small sample size. Therefore, the next step was to limit the analysis to between 25 and 43
m/s. These results are shown in Figure 5.2. When the results were limited to a range with enough data for statistical reliability, the hurricane importance factor for a 2000 year mean
I-0 +0-0 0
0
C-E
1.5
1.45
IL1.4
_ T U1.351.3
1.25
1.2
E1.15
U)1.1
C1.05
0. 95
0.9
050
1350 1650 1950 2250 2550 2850
mile posts
L I I lk I I 1 .7.1I I
AMIN I lip Iq I -- k 09 1 16 1 7-4- -J'Z 7 1 1111 1 W k I N N. IF k 10 11r,450
750
1
recurrence interval came to 1.14 with a standard deviation of 0.08. The low end of the range was again 1.06, greater than the current value.
Figure 5.2 Hurricane Importance Factor (Averaging Over Range, 25 to 43 m/s)
The results for one milepost, 1450, near Miami are shown in Figure 5.3. This area has been hard hit by hurricanes recently and shows representative data. The line representing the 2000 year mean recurrence interval is above the current 1.05 hurricane factor but below the recommended 1.14 hurricane importance factor.
Graphs for all other mileposts are presented in Appendix B. Ninety-three percent of the mileposts require hurricane importance factors above 1.14 for all threshold wind speeds to have a
1.3 factor of safety. Only eighteen percent of the mileposts have their L2000 line entirely below
1.14. Twelve of the graphs show all values above 1.14 for all threshold wind speeds. Tese
graphs represent far north mileposts. It leads to some questioning of the simulation data. Though, there are weather stations on or very near the coast in this area.
Milepost 1450
S1 5 0Lo
1.5
-U_
1.45
MRI = 100
S1.4
~1.35co
1.3
MRI = 500
t1.25
0 1.2
E
1.15
MRI
=
2000
-1.1
S1.05
---- ---
----1 .00.95
current F
0.9
25
29.5
34
38.5
43 recommended F
Threshold Wind Speed (m/s)
Figure 5.3 Hurricane Importance Factor (Milepost 1450)
From these results, this report recommends a value of 1.14 for the hurricane importance factor. This will increase the safety in hurricane regions toward the level currently available in extra-tropical regions. However, more analysis should be done to determine a factor that is a better statistical representation of the data than just an average value.
6.0 Future Work
"There are many significant deficiencies in the wind load design provisions of current U.S. codes and standards. They include:
1. extreme wind speeds and corresponding load factors
derived from outmoded estimation methods 2. exposure coefficients that cannot deal with complex
wind exposures (the normal case)
3. gross simplifications of extreme pressures and loads that
ignore the directional effects of wind
4. no distinction between design for safety and design for serviceablity
Besides the reliable estimation of design loads, there is an urgent need for improved methods by which to assess wind speeds, and thus the wind forces, in complex wind exposures following extreme events such as hurricanes. Only then is it possible to
evaluate with reasonable confidence the performance of structures subjected to wind loads approaching or exceeding the design limit
,,27
states.
The Building and Fire Research Laboratory is continuing to research wind safety factors. This includes work on probability distributions and wind directionality. Currently, United States codes for wind design are based on the assumption that wind is the primary load on the building and directionality effects are insignificant. However, ignoring directionality effects have not been found to be conservative for structural engineering2.
2 7Simiu, Emil, Next Generation Design Standard for Wind Loads (Gaithersburg:
Building and Fire Research Laboatory / National Institute of Standards and Technology, 1996) 1.
2 8Heckert, N.A. and E. Simiu, "Wind Direction and Hurricane-Induced Ultimate Wind
Loads", Proceedings of the 2"d European and African Conference on Wind Engineering, (Genova, 1997) 1825.
As described earlier, nominal MRI's in extra-tropical regions are between 10,000 and
100,000 years, while in hurricane prone regions they are on the order of 500 years. Taking
directionality effects into account, hurricane region MRI's are larger by a factor of between 3 and
15; 8 on average29. This results in MRI's of a few thousand years, still significantly lower than
extratropical regions. These results support the view that wind load provisions for hurricane prone regions are in need of review.
7.0 Conclusion
By increasing the hurricane importance factor to 1.14, the safety in hurricane prone
regions will be increased. Whether this increase will bring the safety level in hurricane prone regions to that in extra-tropical regions is still uncertain. However, any increase in the hurricane importance factor will increase the structural safety, resulting in fewer failures and possibly saving lives.
There are three ways to increase the wind safety factor: site specific codes, increasing the load factor (from 1.3), and increasing the hurricane importance factor (from 1.05). Site specific condes could involve increases in either of the other values. Since the factor of safety is a function of the load factor and hurricane importance factor, only one of these values needs to be increased to increase the safety factor. Because the hurricane importance factor is added in hurricane prone regions, this report analysed increasing that value while allowing the load factor to remain at 1.3 nationwide.
This paper looked at the average hurricane importance factor for a mean recurrance interval of 2000 years, only analysing the data that falls within the reliable wind speed range for the simulated data, 25 to 43 m/s. This resulted in the recommended hurricane importance factor
of 1.14, with a standard deviation of 0.8. Further statistical analysis should be performed to determine which value, between 1.06 and 1.22, should be adopted by the code. This value should attempt to equate the safety level in hurricane prone regions to extra-tropical regions.
Load factors are continuing to evolve as research is done to relate loads to structural safety. The recommendation in this report is only a step in this evolution. More wind data acquisition stations must be established to collect data in hurricane prone regions so that the region can be better modeled.
Appendix A
Instructions for accessing the data and program files (original form) FTP ftp.nist.gov >cd pub/bfrl/emil >cd hurricane/datasets >prompt off >dir >mget * >cd .. >cd programs >dir >mget * >cd ..
>get README README >quit
(data)
(to list all files) (copies all files)
Appendix B
Milepost Data AnalysisMilepost 150
1.4 1.4 c 1.3 1.25 E 1.15 1.1 1.05 ---O 1 0.95 0.9 25 29.5 34 38.5 Threshold Wind Speed43 (m/s) MRI = 100 MRI = 500 MRI = 2000 current F recommended F
Milepost 200
o1-4 1553 1.3 1.25 8.O 1. 2 E 1.151.1 e 15 .2 0.95 0.9 I 25 29.5 34 38.5 43 Threshold Wind Speed (m/s)MRI = 100 MRI = 500 MRI = 2000 current F recommended F
Milepost 250
0 o 1.5 1.4 c 1.3 IT 1.25 CO 1. 2 E 1.15 1.1 01.05--- 1 .s 0.95 0.9 25 29.5 34 38.5 43 Threshold Wind Speed (m/s)MRI = 100 MRI = 500 MRI = 2000 current F recommended F
Milepost 300
1.5 LL 1.45 t1.251.3 1.-01.5 E 1.15 -1.1 0)1.05 o 0.95 0.9 ' 25 29.5 34 38.5 43 Threshold Wind Speed (m/s)MRI = 100 MRI = 500 MRI = 2000 current F recommended F
Milepost 350
1.5 1.45 1.4 1.35 1.3 1.25 1. 1.15 1.05 -- ---1 0.95 0.9 25 29.5 34 38.5 43Threshold Wind Speed (m/s)
MRI = 100 MRI = 500 MRI = 2000 current F recommended F U-0D 0 C 0O
Milepost 400
o 1.55 Li. 45 MVRI =100 o 1.4 o 1.35 .o MRI = 500 1.25 CO 1.2 E1.15 MRI= 2000 __1.1 01.05.-1 S0.95 current F 0.Q9 25 29.5 34 38.5 43 recommended FMilepost 450
o1 35 U 1.3 1.25 1.2 1.15 1.1 .0.95 0.9 L 25 29.5 34 38.5 43Threshold Wind Speed (m/s)
MRI = 100 MRI = 500 MRI = 2000 current F recommended F o 1.5 I 1.45 t 1.25 1.2 E 1.15 - 1.1 0 1.05 .S 0.95 0.9 I
Milepost 500
MRI = 100 MRI = 500 MRI = 2000 current F recommended F 25 29.5 34 38.5 43Threshold Wind Speed (m/s)
Milepost 550
MRI = 100 MRI = 500 MRI = 2000 current F recommended F 5 29.5 34 38.5 43Threshold Wind Speed (m/s)
Milepost 600
0 I U 0 CL 1.5 1.45 1.4 1.35 1.3 1.25 1.2 1.15 1.1 1 .0 5 -- ---1 0.95 0.9 25 29.5 34 38.5 43 Threshold Wind Speed (m/s)Milepost 650
1.5 1.45 1.3 t o 1.21.25 E 1.15 1.1 1.05: C 0.95 0.9 25 29.5 34 38.5 43Threshold Wind Speed (m/s)
MRI = 100 MRI = 500 MRI = 2000 current F recommended F
Milepost 700
1.5 2 1.45 1.51.3 1.3a1.25
E 1.15 1.0 .8005 --£ 0.95 25 29.5 34 38.5 43 Threshold Wind Speed (m/s)MRI = 100 MRI = 500 MRI = 2000 current F recommended F o1 35 ,U LL1.451.3 o 1.5 1.3 1.25 E 1.,151.1 1 0.95 0.9 X 2 MRI = 100 MRI = 500 MRI = 2000 current F recommended F
Milepost 750
a 1.5 1. ~1.35 S1.3 t 1.25 01.2 1 0.950. 9 25 29.5 34 38.5 43 Threshold Wind Speed (m/s)MRI = 100 MRI = 500 MRI = 2000 current F recommended F
Milepost 800
LLd) C t 0 E .E C) I 25 29.5 34 38.5 43 Threshold Wind Speed (m/s) 1.5 1.45 1.4 1.35 1.3 1.25 1.2 1.15 1.1 1.05 0.95 0.9 MRI = 100 MRI = 500 MRI = 2000 current F recommended FMilepost 850
1.25 LL1.45a
1.2 2 1.35 1.1 !1.05 CL 11 L) 0.95 0.9 25 29.5 34 38.5 43 Threshold Wind Speed (m/s)MRI = 100 MRI = 500 MRI = 2000 current F recommended F
Milepost 950
1.5 L0 1.45 1.4 t 1.25 a 1.2 2 1.15 1.1 (D 1.05 -- - ---.2 0.95 ~0.9 25 29.5 34 38.5 43Threshold Wind Speed (m/s)
MRI = 100 MRI = 500 MRI = 2000 current F recommended F
Milepost 900
U 1.5 LL1.45 MRI = 100 w 1.4 1.35 1.3 MRI = 500 t1.25aC
1.2 1-15 MRI = 2000 - 1 1.05 --. 0--.95 current F 0.9 a: 25 29.5 34 38.5 43 recommended F Threshold Wind Speed (m/s)Milepost 1000
L1.45 MRI = 100 S14 1.3 MRI = 500 t 1.25aO
1.2 L 1-15 MRI = 2000 - 1.1 1.05 -O 0.5 current F 0.9 I 25 29.5 34 38.5 43 recommended F Threshold Wind Speed (m/s)---Milepost 1250
o1.5 O1.45 MRI= 100 D 11.4 1.3 MRI = 500 t1.25 LO 1.2 S1.15 ceRI2000 1.1 0D1.05 -.0.95 current F 0.9 X 25 29.5 34 38.5 43 recommended FThreshold Wind Speed (m/s)
1.5 LL 1.45 15 1.3 t 1.25 E 1.151.1 05 ~u 1 0.9 I 0 46 IL CO 0 0 a C
Milepost 1100
Milepost 1050
1.5 T 1.45 MRI = 100 *1.4 S1 35 c 1.3 MRI = 500 t 1.25 a 1.2 E 1.15 - MRI = 2000 1.05 --- --.695 current F 0.9 25 29.5 34 38.5 43 recommended F Threshold Wind Speed (m/s),25 29.5 34 38.5 43 Threshold Wind Speed (m/s)
Milepost 1200
1.45- MRI = 100 1.4 1.35 1.3 MRI = 500 1.25 1.2 1.15 1.1 MRI = 2000 1.05 --- --0 g current F 0.9 -25 29.5 34 38.5 43 recommended F Threshold Wind Speed (m/s)MRI = 100 MRI = 500 MRI = 2000 current F recommended F
Milepost 1150
~1.45 MRI =100 1.35 LO1.35 M VRI = 500 1.2a1.25
E 1.15 IMRI = 2000 - 1.1 0D10b5---C .20.95 current F 0.9 : * 25 29.5 34 38.5 43 recommended F Threshold Wind Speed (m/s)Milepost 1300
S1.45 MRI= 100 8 1.4 -1.3 MRI = 500 t 1.25a.
1. 2 MRI= 2000 -1.1 01.05--- --- ---.2 0.95' current F 0.9 I 25 29.5 34 38.5 43 recommended FMilepost 1350
t 1.25 0 1.2 : 1.35 t1.25 E 1.15 G1 0.95 0.9 25 29.5 34 38.5 43 Threshold Wind Speed (m/s)MRI = 100 MRI = 500 MRI = 2000 current F recommended F
Milepost 1600
0 1.5 U- 1.45 1.3 t 1.25 o 1.2 E 1.15 1.15 C .2 0.95 0.9 I 25 29.5 34 38.5 43Threshold Wind Speed (m/s)
MRI = 100 MRI = 500 MRI = 2000 current F recommended F
Milepost 1550
'U 1.5 L1.45 6 1.3 t 1.25 a 1.2 E 1.15 - 1.1 0 9 25 29.5 34 38.5 43 Threshold Wind Speed (m/s)Milepost 1650
1.51 U- 1.45 S1.3 1.25 0 1.2 E 1.15 -1.1 (D 1 05 1-d . 0.95 0.9 I 25 29.5 34 38.5 43Threshold Wind Speed (m/s)
MRI = 100 MRI = 500 MRI = 2000 current F recommended F MRI = 100 MRI = 500 MRI = 2000 current F recommended F
Milepost 1400
1.5 u0 1.45 MRI = 100 o1.45-'1. MRI = 500 1.25 LC 1.2 11 I = 2000 CD1.05 -S0.95 current F 0.9 25 29.5 34 38.5 43 recommended F Threshold Wind Speed (m/s)Milepost 1500
L)1.5 O1.45 MRI = 100 S1.4 1.3 IMRI = 500 t 1.25 aL 1.2 E 1. -i5 -MRI = 2000 - 1.1 1 d) 1.05 --- ---1 0.95 current F 0.9 a 25 29.5 34 38.5 43 recommended F Threshold Wind Speed (m/s)Milepost 1700
1.45 p 1.25 a 1.2 E 1.15 -1.1 1.05 ---cs 1 .0.95 0.9 25 29.5 34 38.5 43 Threshold Wind Speed (m/s) IMRI = 100 MRI = 500 MRI = 2000 current F recommended F
Milepost 1750
C. 1.45 5 1.3 t 1.25 a 1.2 E 1.15 - 1.1 L) 1 1-1 . 0.95 0-9 I 25 29.5 34 38.5 43 Threshold Wind Speed (m/s)MRI = 100 MRI = 500 MRI = 2000 current F recommended F
Milepost 1800
1.5 1.45 1.4 1.35 1.3 1.25 1.2 1.15 1.1 0.95 0.9 . 25 29.5 34 38.5 43 Threshold Wind Speed (m/s)MRI = 100 MRI = 500 MRI = 2000 current F recommended F
Milepost 1850
1.5 t 1.25 a 1.2 E 1.15 -1.1 1-.05 S1 --- --- -- ---0.9 ' 25 29.5 34 38.5 43Threshold Wind Speed (m/s)
MRI = 100 MRI = 500 MRI = 2000 current F recommended F
Milepost 1900
0 1.5 -1.35 1.3 MRI = 500 t 1.25 o 1.2 E11.5 *RI = 2000 1. 1 ----9 0.current F E0.9 ' 25 29.5 34 38.5 43 recommended FThreshold Wind Speed (m/s)
0 e t 0 CL E C . I
Milepost 1950
1.5-O1.45 MRI = 100 0 1.4 o1.35 5 1.3 MRI = 500 t 1.25 0 1.2 - I = 2000 1.1 (D 1.05---0 O current F 0.9: I 25 29.5 34 38.5 43 recommended FMilepost 2000
t 1.25a1.2
c 1.3 --t 1.25 CO 1.2 E 1.15 -1.1 C1.05- - -.90.95 0.9 3 25 29.5 34 38.5 43 Threshold Wind Speed (m/s)MRI = 100 MRI = 500 MRI = 2000 current F recommended F 1.5 0 1.45 C 1.3 1.3 t1.25 o 1.2 E 1.15 1.1 - -1 0.95 0.9 I 25 29.5 Threshold 34 38.5 43 Wind Speed (m/s) MRI = 100 MRI = 500 MRI = 2000 current F recommended F 1.5 1.45 1.4 1.35 1.3 1.25 1.2 1.15 1.1 1.05 . 0.95 0.9
Milepost 2150
LL a) 0 0 C] C: 25 29.5 34 38.5 43 Threshold Wind Speed (m/s)Milepost 2250
u 1.45 1.4 1.3 1.25aC
1.2 E 1.,15 -1.1 0 1.05 .2 0.95 0.9 I 25 29.5 34 38.5 43Threshold Wind Speed (m/s)
MRI = 100 MRI = 500 MRI = 2000 current F recommended F MRI = 100 MRI = 500 MRI = 2000 current F recommended F
Milepost 2050
c 1.4 MRI = 100 L) 1.4 5 1.3 MRI = 500 t 1.25 0 1.2 15 MRI = 2000 -1.1 ~1.05--- --.00.95 current F 0.9 I 25 29.5 34 38.5 43 recommended F Threshold Wind Speed (m/s)Milepost 2100
.~~ 01.45 MRI= 100 S1.3 MRI = 500 t 1.25 o 1.2 E1. MRI = 2000 1.1 1.05 7--- ---9 current F 0.9 25 29.5 34 38.5 43 recommended F Threshold Wind Speed (m/s)Milepost 2350
Milepost 2300
1.5 -T21.4 MRI = 100 1.25a
1.2 E 1.15 IMRI =2000 -1.1 01.05 --- ---0.95 current F 0. 9__ X 25 29.5 34 38.5 43 recommended F Threshold Wind Speed (m/s)MRI = 100 MRI = 500 MRI = 2000 current F recommended F
Milepost 2400
o 1.435 " 1.3 t 1.25 o 1.2 1.1 0105 0C 1 S 1.05 ---. 0.95 0.9 25 29.5 34 38.5 43 Threshold Wind Speed (m/s)MRI = 100 MRI = 500 MRI = 2000 current F recommended F
Milepost 2450
LL 0 a-E A? 1.5 1.45 1.4 1.35 1.3 1.25 1.2 1.15 1.1 1-05 1. ---- -- --- - --- -0.95 0.9 25 29.5 34 38.5 43 Threshold Wind Speed (m/s)Milepost 2500
o1.5 w1.45 MRI = 100 11.4. 1.35 o 1.3 MRI = 500 t o 1.21.25 MRI = 2000 1.1M 01.05 --- --- .. .20.95 . . current F 0.9 25 29.5 34 38.5 43 recommended FThreshold Wind Speed (m/s)
1 5 1S5 C' 1.3 1 25
aC
1.2 E 1.15 0 1.05 --- ---- ---0O 1 .S 0.950.9 X 25 29.5 34 38.5 43 Threshold Wind Speed (m/s)MRI = 100 MRI = 500 MRI = 2000 current F recommended F
Milepost 2550
L 1.5 01.45 MRI = 100 1-t o 1.3 MRI = 500 V1.25aC
1.2 . 1 5RI= 2000 1.05 --- ---0.95 current F . 0.9 25 29.5 34 38.5 43 recommended FMilepost 2600
1.5 1.45 1.4 1.35 1.3 1.25 1.2 1.15 1.1 1.05 0.95 0.9 25 29.5 34 38.5 43 Threshold Wind Speed (m/s)MRI = 100 MRI = 500 MRI = 2000 current F recommended F
Milepost 2800
o1.5 O1.45 MRI = 100 1.4 1.35 1.3 MRI = 500 t1.25 o- 1.2 E1.15 I = 2000 1.1 1.05 --- -- -- -- --- --- --0.9 current F 0.9 _ _ 25 29.5 34 38.5 43 recommended FThreshold Wind Speed (m/s)
Milepost 2850
LL 0 CL E 0) C (O .U -25 29.5 34 38.5 43Threshold Wind Speed (m/s)
1.5 1.45 1.4 1.35 1.3 1.25 11 1.05 0.95 0.9 0 LL U-0 C) C
Milepost 2650
L 1.45 MRI = 100 1 MRI = 500 -21.25 0 1.2 SRI= 2000 -1.1 4)1.05 ---0.95 current F 0.9 Z: 25 29.5 34 38.5 43 recommended F Threshold Wind Speed (m/s)Milepost 2700
*t1.5 O1.45 MRI = 100 1.4 1.3 MRI = 500 tf 1.25 o 1.2 E1.15 .- MRI = 2000 1.1 1.05 ---C 12 0.95 current F 0.9 a 25 29.5 34 38.5 43 recommended FThreshold Wind Speed (m/s)
Milepost 2750
L1.45 MRI = 100 14 MRI = 500 E 1.1 - - MRI = 2000 01.5 *D 1-05 -- --- --- --- --.90.95 current F 0.9 25 29.5 34 38.5 43 recommended F Threshold Wind Speed (m/s)MRI = 100
MRI = 500
MRI = 2000 current F
Appendix C
]lMean Recurrance Interval = 100 yrs -Mean Recurrance Interval = 500 yrs IMean Recurrance Interval = 2000 yrs
IL-I[ All Values In Range (2-3ms
Mile|ost Average STI DEV Average b I lEV Average LTIDgDEV Average _S_______
150 0.96 0.02 1.10 0.02 1.18 0.03 1.18 0.03 200 0.96 0.01 1.07 0.02 1.13 0.04 1.12 0.02 250 0.95 0.01 1.05 0.02 1.11 0.02 1.11 0.02 300 0.94 0.01 1.04 0.04 1.09 0.07 1.05 0.02 350 0.96 0.02 1.09 0.03 1.16 0.04 1.15 0.00 400 0.93 0.01 1.02 0.02 1.07 0.03 1.05 0.02 450 0.95 0.01 1.08 0.05 1.17 0.09 1.14 0.07 500 0.95 0.01 1.08 0.05 1.17 0.09 1.14 0.07 550 0.96 0.01 1.10 0.04 1.19 0.07 1.14 0.04 600 0.97 0.02 1.14 0.03 1.25 0.04 1.25 0.04 650 0.96 0.01 1.10 0.03 1.19 0.05 1.17 0.04 700 0.94 0.01 1.05 0.03 1.11 0.05 1.08 0.03 750 0.94 0.01 1.05 0.02 1.11 0.04 1.12 0.03 800 0.93 0.01 1.04 0.04 1.10 0.07 1.14 0.06 850 0.93 0.01 1.02 0.03 1.08 0.05 1.12 0.02 900 0.94 0.01 1.04 0.02 1.10 0.04 1.12 0.02 950 0.94 0.01 1.04 0.03 1.09 0.06 1.06 0.03 1000 0.93 0.01 1.00 0.03 1.04 0.05 1.02 0.03 1050 0.93 0.01 1.03 0.04 1.09 0.06 1.07 0.05 1100 0.92 0.01 0.97 0.03 1.00 0.04 1.03 0.02 1150 0.95 0.01 1.08 0.03 1.17 0.05 1.16 0.03 1200 0.96 0.01 1.11 0.02 1.22 0.04 1.24 0.03 1250 0.94 0.01 1.04 0.02 1.10 0.03 1.09 0.03 1300 0.92 0.01 1.00 0.03 1.04 0.05 1.05 0.05 1350 0.94 0.01 1.06 0.03 1.13 0.06 1.14 0.06 1400 0.94 0.01 1.04 0.02 1.09 0.04 1.10 0.04 1450 0.92 0.01 1.00 0.03 1.04 0.06 1.06 0.06 1500 0.92 0.01 1.00 0.03 1.05 0.05 1.07 0.03 1550 0.93 0.01 1.01 0.03 1.06 0.05 1.07 0.05 1600 0.92 0.01 1.08 0.04 1.15 0.08 1.13 0.03 1650 0.94 0.01 1.05 0.04 1.12 0.06 1.10 0.04 1700 0.94 0.02 1.06 0.09 1.13 0.14 1.07 0.06 1750 0.94 0.01 1.06 0.05 1.13 0.09 1.09 0.05 1800 0.95 0.01 1.10 0.06 1.19 0.11 1.14 0.06 1850 0.98 0.03 1.16 0.02 1.28 0.04 1.28 0.03 1900 0.95 0.01 1.07 0.04 1.15 0.07 1.11 0.05 1950 0.95 0.03 1.09 0.01 1.17 0.02 1.17 0.02 2000 0.94 0.01 1.05 0.03 1.11 0.05 1.10 0.04 2050 0.93 0.01 1.03 0.03 1.09 0.06 1.08 0.06 2100 0.93 0.01 1.03 0.03 1.09 0.06 1.07 0.04 2150, 0.94 0.01 1.04 0.03 1.11 0.06 1.09 0.05 2200 0.95 0.01 1.08 0.03 1.18 0.06 1.18 0.06 2250 0.95 0.01 1.10 0.03 1.21 0.07 1.18 0.06 2300 0.96 0.01 1.11 0.02 1.22 0.04 1.20 0.03 2350 0.97 0.01 1.16 0.05 1.30 0.10 1.28 0.02 2400 0.97 0.01 1.16 0.07 1.29 0.14 1.20 0.04 2450 0.99 0.01 1.21 0.03 1.39 0.06 1.36 0.02 2500 0.97 0.01 1.13 0.04 1.23 0.07 1.20 0.02 2550 0.99 0.06 1.15 0.10 1.24 0.10 1.21 0.03 2600 0.96 0.01 1.09 0.03 1.15 0.05 1.15 0.04 2650 0.97 0.02 1.12 0.04 1.20 0.04 1.19 0.03 2700 0.97 0.01 1.14 0.02 1.24 0.05 1.26 0.02 2750 0.98 0.01 1.14 0.03 1.23 0.05 1.21 0.03 2800 0.98 0.01 1.17 0.02 1.29 0.04 1.28 0.03 2850 0.99 0.02 1.19 0.04 1.32 0.08 1.27 0.03 1 0.9 1 0.031.0810.071 1.16 0.10 1.14 0.081