AN ANALYSIS OF HONG KONG REITS: CURRENT AND FUTURE OPPORTUNITIES FOR INVESTORS
By King Man Chow Bachelor of Commerce University of British Columbia, 2005
SUBMITTED TO THE MIT SLOAN SCHOOL OF MANAGEMENT IN PARTIAL FULFILLMENT OF THE REQUIREMENTS FOR THE DEGREE OF
MASTER OF SCIENCE IN MANAGEMENT STUDIES AT THE
MASSACHUSETTS INSTITUTE OF TECHNOLOGY JUNE 2011
@2011 King Man Chow. All Rights Reserved. The author hereby grants to MIT permission to reproduce
and to distribute publicly paper and electronic copies of this thesis document in whole or in part
in any medium now known or hereafter created.
MASSACHUSE TITUTE OF TEW ILr
JUN 15 2011
LIBRARIES
ARCHIVES
Signature of Author:MIT Sloan School of Management May 6, 2011
Certified By: _
David Geltner
Professor of Real Estate Finance, Department of Urban Studies & Planning
Thesis Supervisor
Accepted By:
Michael A. Cusumano SMR Distinguished Professor of Management Program Director, M.S. in Management Studies Program MIT Sloan School of Management
An Analysis of Hong Kong REITs: Current and Future Opportunities for Investors
ByKing Man Chow
Submitted to the MIT Sloan School of Management on May 6, 2011 in partial fulfillment of the requirements for the degree of Master of
Science in Management Studies
ABSTRACT
Real estate investment trust (REIT) is a valuable investment alternative for investors in many markets. Being home to a handful of world-class property developers, Hong Kong, the Asia financial hub, seemed to have met all the criteria to grow a REIT market rapidly. Yet, since the enactment of the Hong Kong REIT Code in 2003, the H-REIT (acronym for Hong Kong REIT) market saw only eight H-REITs being launched, lagging the growth of other REIT markets in the region. This thesis paper seeks to uncover the present investment values in H-REITs and determine what likely would shape the future of the market hence the potential value it could bring to investors, through examining the local real estate capital markets, the regulations, and the supply and demand dynamics, and conducting comparative analysis with stocks of local property companies.
The study finds that the H-REITs are significantly less risky than local property stocks and offer dividend yields that in most cases are greater than the earning yields of those stocks. H-REIT offers real estate exposure, yet provides diversification effect to a portfolio of local property stocks given its low correlations with these stocks. Hurdles to market growth persist as abundance of liquidity, low yields offered by prime properties, poor reception of yield enhancement mechanisms in REITs, agency problems and questionable corporate governance of the H-REITs all contributed to suppressing both the supply and demand for local asset-backed H-REITs. Moreover, the small size of the city seems to indicate that the H-REIT market was destined to depend on cross-border deals. Thanks to the close-tie to China, Yuan-denominated cross-border REITs backed by Mainland China assets appear to be the future of the H-REIT market. While this type of deal clears some of the hurdles to grow the market, it still remains in the hands of the sponsors to add transparencies in H-REIT management structure to gain the much needed trust from investors to build a functioning market.
Thesis Supervisor: David Geltner
Table of Contents
Chapter 1. Hong Kong Real Estate Capital Market ... 7
1. 1 Overview of HK Real Estate M arket ... 7
1 .I .1 Econom y O verview ... 7
1. 1.2 Overview of the Geography of Hong Kong ... ... 8
1. 1.3 Overview of Hong Kong Office Market ... 9
1.1.4 Overview of Hong Kong Retail Market...12
1.1.5 M ajor P layers ... 13
1.2 Overview of Real Estate Investment Alternatives in Hong Kong . ... 14
1.2.1 Stocks of Real Estate Companies... ... ... ... 15
1.2.2 Bonds of Real Estate Companies ... 15
1.2.3 R eal E state Funds ... 16
1.2.4 Securitization Products ... ... ... 17
1.2 .5 R E IT s ... . 2 1 Chapter 2. Structure and Policy of H-REITs...25
2.1 Legislative Framework of H-REITs... 25
2.2 General Structure of H-REITs... 26
2.3 Major Difference Between H-REITs and US-REITs...27
2.4 Major Difference Between H-REITs and other major Asia REITs ... 27
Chapter 3. Analysis of H-REITs ... 30
3.1 Individual REIT Analysis ... 30
3.2 Cross-Analysis ... 37
3.2.1 Sum m ary Statistics... 37
3.2.2 Yield Enhancements M echanisms ... 38
3.3 C om parative A nalysis... 4 1 3.3.1 R eturn and R isk Statistics ... . ... 42
3.3.2 Return Correlations...50
3.3.3 D ividend Y ields ... 55
3.3.4 Price-to-Book ... 57
3.3.5 Price-to-Forw ard-N A V ... .. ... 59
Chapter 4. The Future of the H-REIT Market and Its Opportunities
for Investors... 64
4.1 The Future of the H-REIT Market ... 64
4.2 Future Opportunities for Investors ... ... .... 70
4 .3 Su m m ary ... . 71
Chapter 5. Conclusion ... 72
Chapter 1. Hong Kong Real Estate Capital Market
1.1 Overview of HK Real Estate Market
1.1.1 Economy Overview
Hong Kong, a special administrative region of the People's Republic of China, is widely considered to be the financial hub of Asia and the gateway to China. As of 2009, Hong Kong's gross domestic product (GDP) per capita of US$42,716 was the fourth highest among those of Asian countries, behind only Australia, Japan and Singapore'. Hong Kong is largely a service economy with the service sector accounts for 92.6% of its GDP in 20092.
Table 1.1: Hong Kong's Year 2009 GDP Breakdown by Economic Activity
Economic Activity
2009 (% of Total GDP)
Services
92.6
Import/export, wholesale and retail trades
23.6
Import and export trade 19.7
Wholesale and retail trades
3.9
Accommodation and food services
3.1
Transportation, storage, postal and courier services
6.4
Transportation and storage
6.1
Postal and courier services
0.3
Information and communications 3.0
Financing and insurance
15.2
Real estate, professional and business services
11.2
Real estate 5.6
Professional and business services
5.6
Public administration, social and personal services 18.0
Ownership of premises 12.1
Other
4.2
Construction
3.2
GDP at basic
prices
100.0
Source: HK Census and Statistics Department
Hong Kong's economy has shown great resilience after the financial crisis, largely due to its close tie with China, the world's fastest growing economy. The city's major stock index Hang Seng Index has nearly doubled in the two years since it bottomed out in March 2009. However, Hong Kong Dollar (HKD) has been weak relative to other major currencies and the interest rate has been kept at a low level in the past
1 Economist Intelligence Unit. "Country Report: Hong Kong." Economist Intelligence Unit (March 2011).
two years, since the exchange rate peg between the Hong Kong Dollar (HKD) and US Dollar3 forces Hong Kong to follow the weak currency and loose monetary policy adopt by the US government. This has resulted in a large capital inflow and greatly stirred concern of inflation and asset bubbles, as shown in Figure 1.1 and Figure 1.2.
Figure 1.1: HK Foreign Reserves and Banking System Figure 1.2: HK Real GDP Growth, CPI and HIBOR
Net Foreign Assets
10
300 A Banking System Net Foreign Assets 8
Official Foreign Reserves
6
250
150-4
00
4 4 a 2-+- HK Real GP Growth YoY% -@-HK CPI m-* HBOR 3-month
Source: Morgan Stanley Research Source: Bloomberg
One recurring theme regarding Hong Kong's economy in recent years is its increasing dependency on China. Given its sound legislative system, fully convertible currency, and status of the world's freest economy4, Hong Kong has become the hot bed of initial public offering (IPO). Hong Kong saw a total of
US$57
billion raised from IPO in 2010, leading the world in terms of dollars raised from IPO issuance for the second year in a row5. The city was accounted for almost a quarter of the global IPO fund-raised proceeds6, driven by a high volume of IPO listing of Chinese companies on the Hong Kong Stock Exchange.1.1.2 Overview of the Geography of Hong Kong
Strategically located in the southeastern tip of China, as shown in Figure 1.3, Hong Kong has taken advantage of its deep natural harbor to turn itself into an important logistic hub in the region. With a land area of 1,104 square kilometers and a population of
just
over 7 million, Hong Kong is widely considered3
The peg was set so that the exchange rate of HK Dollars only fluctuate in the range of 7.75 to 7.85 HK Dollar toone US Dollar.
4 Master, Farah. "Hong Kong ranks world's
freest
economyfor
17th year." Reuters (January 12, 2011)* Stein, Peter. "Hong Kong Seeks IPO Three-Peal in 2011." The Wall Street Journal (January 2, 2011)
6 rs & Y oung L LP. "2010 global
IPO
fund
raising to exceed historic peak in 2007." Ernst & Young L LP(December 8, 2010)
-to be one of the most densely populated areas in the world7
. The city is comprised of three main territories, namely Hong Kong Island, Kowloon, and New Territories, as shown in Figure 1.4. Since the city's "terrain is hilly to mountainous with steep slopes", only less than 25% of the city's land is developed. The urban development of the city is primarily located in Kowloon, along northern coast of the Hong Kong Island, and scattered throughout New Territories9.
Figure 1.3: Map of China Figure 1.4: Map of Hong Kong
Source: Enviro-maps.com Source: Hong Kong Tourism Board
1.1.3 Overview of Hong Kong Office Market
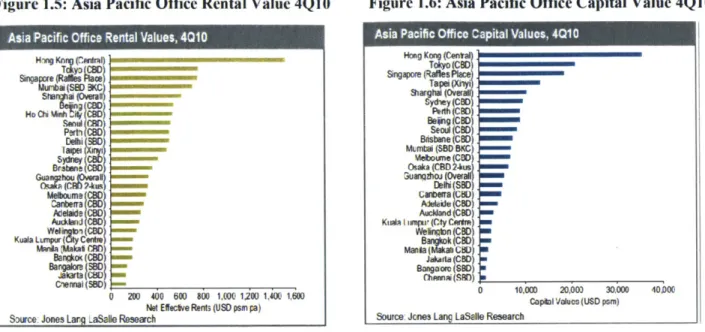
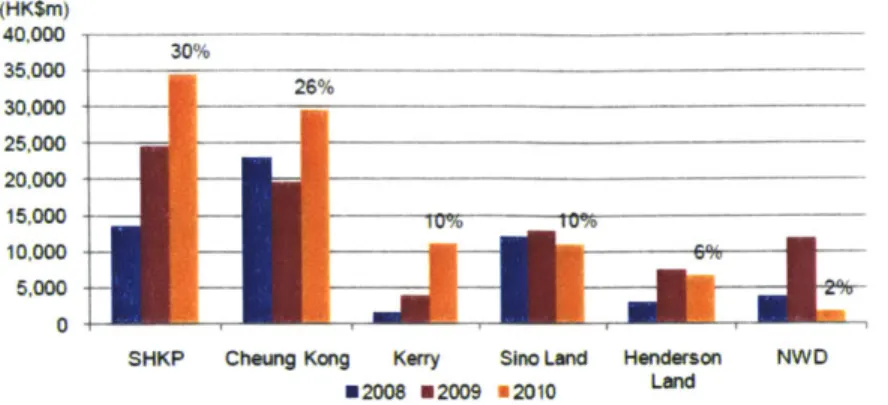
At an occupancy cost of US$184.21 per square feet per annum year as of September 30, 2010, office space in Hong Kong's Central CBD (central business district) was the second most expensive in the world, behind only London's West End (US$193.69), and tops the chart as the biggest riser with a 34.2% year-on-year growth". In Asia, office area in Hong Kong leads the pack in terms of both rental value and capital value as of fourth-quarter of 2010, as shown in Figure 1.5 and Figure 1.6.
7 Economist Intelligence Unit. "Country Report: Hong Kong. " Economist Intelligence Unit (March 2011). 8 Wikipedia.
9
0 CB Richard Ellis, Inc.. "Hong Kong (CBD) Records the World's Fastest Year-Over-Year Occupancy Cost Rise
and Ranks as World's Second Most Expensive Office Market." CB Richard Ellis, Inc. (November 15, 2010) 9
Figure 1.5: Asia Pacific Office Rental Value 4Q10 Asia Pacific Office Rental Values, 4010
Wigj Kn2im Steum1ai pverah Ho Oi Math ..i (90 Delhi (B lapl Brbae (080 Auclad 080 Wewkvb,lC90
Kuela aPW (City Cant,, Wida Makaf CM Ban~kos (C0 Ba Sal BD(5 Be=a IN; C'isnal (550) 0 200 400 600 8W 100 1200 1,400 1.600
Net Effctive Rents (USD psm pa)
S:>urce: Jones Larg Lasale Research
Figure 1.6: Asia Pacific Office Capital Value 4Q10
Asia Pacific Office Capital Values, 4Q10
HngKo ent Singap~e oesPac Sydey (COD) Pedh (8D) JCBD Seoi (C80) Brisbane (080)D Mumtot (85D BKC Osana C ) Kua (OD) Malakfe (CBD) Auckid (CBD)
KWA I iampr*(Cty Cauft Wetmbn (CK,) Bam~k(CBD). JakartacD C MN U -10000 a-m,,p
Hong Kong has a grade-A office stock of 75.46 million square feet and an overall vacancy rate of 4.85% at the end of September 2010", as shown in Table 1.2. Approximately three-quarters of Hong Kong's grade-A office space is located on Hong Kong Island, where 44% of the office space is occupied by the finance and banking sector, 23% is occupied by professional services centers, and 17% by the insurance sector". Whereas in Kowloon, the home of a quarter of the city's grade-A office space, 66% of the office space was occupied by wholesale, retail and import/export trades, 13% by manufacturing, and 12% by transportation, storage, postal and courier services. Major office districts of the city are shown in Figure 1.7.
"DTZ Research. "DTZ Property Times Hong Kong Q3 2010." DTZ (October 13, 2011).
" CB Richard Ellis Research. "MarketView: Hong Kong Office." CB Richard Ellis, Inc. (Third Quarter 2010)
10
40000 0 10,000 20,003 30,000
Capal Values (USD psn)
Table 1.2: Office Stocks of Hong Kong at 3Q2010 Total stoc 1 c(Milion wlooratio(9Q District sq ft) Sheurg Vr/Central/Admiralty 2R58 435 KONnchai/Caseway Bay 1579 5.28 Island East _1Q47 354
xVg Kong Islad Total 5_8
Tsimshatsui 9.27 572
s W Kowoon East 11.35 6.3
AlAI mOW Kowloon Totd 2a62
Hong Kong Island546
=Kwun
Tong Line Tsuen Wan line - Island Line Source: DTZ Research - Airport Express Tseung Kwan 0 LineNote: Line refers to subway line of MTRC
Source: CBRE
In light of the strong economic recovery and businesses' attempt to expand their presences in the Greater China region (that includes Hong Kong, Mainland China and Taiwan), vacant office space in Hong Kong has been falling steadily since the financial crisis and is expected to remain scarce by many3. However,
there may be a change in that distribution as there is an increasing number of financial institutions and professional firms moving from the traditional central CBD area over to Kowloon for less expensive space. Banks like Deutsche Bank, Credit Suisse and Morgan Stanley have recently moved into the
International Commerce Centre in West Kowloon14
, an emerging office site that is near Tsim Sha Tsui. Figure 1.8: New Office Supply, Net Absorption and Availability Ratio
(2000-201 1F) 8 16 7 14 6 12 5 10 3 6 22
.4
-1Ld
0l
2Wn 2001 20 20W 25 2 200r 20MeS Source: DTZ Research" Sito, Peggy. "Office rent-rise view challenged." South China Morning Post (January 19, 2010) " Website of Sun Hung Kai International Commerce Centre
1.1.4 Overview of Hong Kong Retail Market
Many consider Hong Kong to be a shopper's paradise thanks to its low tariffs and the presence of a wide variety of world-class brands. Hong Kong's retail sales amounted to HK$34.9 billion in 2010, an 18.5% year-on-year jump", hence played an important role behind the city's economic growth. The central shopping district of Hong Kong, Causeway Bay, charged a rent of US$1,664 per square foot per annum, which placed the district to be a close second behind New York City's Fifth Avenue (US$1,850) in the run for the most expensive retail area in the world as of September 201016.
Figure 9: Major Shopping Districts in Hong Kong
Now= Task&"
Source: CBRE
Many believe that the sharp jump in retail sales and retail rents post-financial crisis, as shown in Figure 1.10, are driven by the "twin-turbo engine": i) the resilient local consumption; and ii) the solid tourist inflow '. Private consumption growth, helped by economic prosperity, is an obvious driving force behind the strong retail consumption hence the rents. More importantly, shoppers across the borders have been contributing significantly, particularly the Mainland China shoppers. Given the proximity and the city's close tie to China, the proportion of Chinese visitors in the total number of visitors have been consistently growing, as shown in Figure 1.11. In the first ten months of 2010, Mainland China visitors account for 64% of the total number of visitors, a 29.4% jump comparing to the same period last year8. Tourist spending is estimated to be accounted for approximately 40% of the total retail sales in Hong Kong19, and many believe that the upside on visitor flow and retail consumption is strong given the city's increasingly
" Hong Kong Census and Statistics Department.
16 Packard, Simon. "Rents on Best Streets in Tokyo, Seoul Rise as Retail Heads to Asia-Pacific." Bloomberg
(September 21, 2010)
* Jones Lang Lasalle, "Encouraging market conditions prevail in 2010 with strong capital values growth recorded
across property sectors."Jones Lang Lasalle. (December 7, 2010)
18 Core Pacific -Yamaichi, "2011 Investment Strategy - Hong Kong retail sector." Core Pacific - Yamaichi.
(December 2010).
19 Samsung Securities, "Hong Kong Property: This time it's diferent. Oh really?" Samsung Securities. (January 24, 2011)
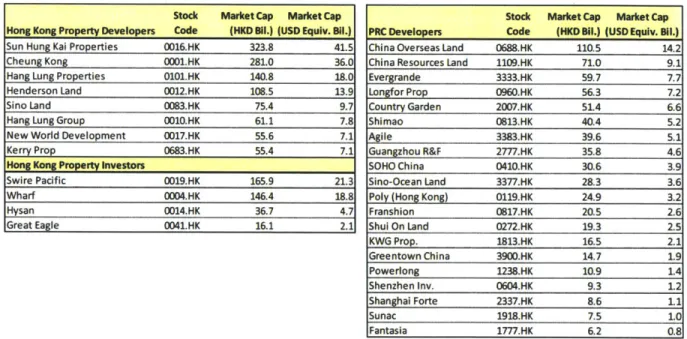
Figure 1.12: Market Share of Hong Kong Developers by Contract Sales of Residential Units (HK$m) 40.000 30% 35,000 30,000 25,000 20,000 15.000 ---- 10 10.000 ML 5,000 0
SHKP Cheung Kong Kerry Sino Land Henderson NWD 02008 22009 82010 Land
Source: Centaline, Samsung Securities
The investment community typically classifies Hong Kong property companies into two categories: property developers and property investors (or landlords). These property developers usually generate most of their income from sale of residential units. On the other hand, property investors, or some called landlords, generate a greater portion of their profit from asset management, and leasing activities for their portfolio of properties.
A list of major properties developers and investors are shown below.
Table 1.3: A List of Major Publically-listed Property Companies in Hong Kong
Hong Kong Property Developers Stock Code Hong Kong Property Investors Stock Code
Sun Hung Kai Properties 0016.HK Swire Pacific 0019.HK
Cheung Kong 0001.HK Wharf 0004.HK
Hang Lung Properties 0101.HK Hysan 0014.HK
Henderson Land 0012.HK Hongkong Land* HKLD.Sl
Sino Land 0083.HK Great Eagle 0041.HK
Hang Lung Group 0010.HK
New World Development 0017.HK
Kerry Prop 0683.HK
*Hongkong Land is listed on the Singapore Exchange.
1.2 Overview of Real Estate Investment Alternatives in Hong Kong
In this subsection, the Hong Kong real estate capital market is examined from an investor's perspectives through a discussion of the various financial products in Hong Kong that offers Hong Kong/China real estate exposure.
strong tie with China and the more relaxed policies towards allowing more China tourists crossing the border.
Figure 1.10: Retail Rents and Retail Sales Value
Growth (Year-on-year % Change) Figure 1.11: Visitors Arrivals by Origin over the FirstEight Months, 2006-2010
25.000,000
20,000,000
5,000,000
1995 1997 1999 2001 2003 2005 2007 2009
Retail rents Retail sales value
Source: Census and Statistics Department, Knight Frank Note: Three-month moving average of yoy growth.
Chinese Short Haul Long Haul NOO oVlIS1ors
0
2008 2007 2008 2009
Source: HKTB, Savills Research & Consultancy
1.1.5 Major Players
Properties companies together make up a large component of Hong Kong's economy. With the help of the "aged, colonial land tenure system in Hong Kong"20, properties development in Hong Kong is largely dominated by a handful of developers who manage to possess land bank and huge pile of capital, as shown in Figure 1.12. Hence, many consider the property market in Hong Kong to be an oligopoly market2 .
20 Lewis, Rebecca. "Issuesfor Responsible Investors: Hong Kong Real Estate." Responsible Research. (November
2010)
2' CLSA Asia Pacific Markets. "Retrovision: HK's property lessonsfor China." CLSA Asia Pacific Markets
(October 2009)
1.2.1 Stocks of Real Estate Companies
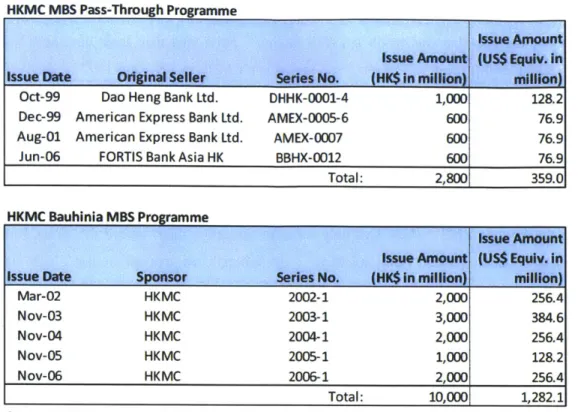
In Hong Kong, investors can easily obtain real estate exposure through holding the stocks of real estate companies (that include property developers or property investors) that have their operations in Hong Kong and/or Mainland China, as the Hong Kong Stock Exchange houses over a dozen of Hong Kong-based real estate companies and more than 20 Mainland China developers. The Hong Kong-Kong-based companies comprise of both developers and investors, and some of them have exposure to both Hong Kong's and China's development and/or investment market; on the other hand, the majority of the Mainland-based companies are residential developers that focus on solely the China market. Fund raising through IPO issuance in Hong Kong has been popular among Chinese companies, including the developers, as the capital market of Hong Kong is regarded by these companies as the gateway to foreign capital, which is especially important when the local funding in China is tightened.
Table 1.4: List of Major Property Companies Listed in Hong Kong Stock Market Cap Market Cap
Hong Kong Property Developers Code (HKD 811.) (USD Equiv. B11.)
Sun Hung Kai Properties 0016.HK 323.8 41.5
Cheung Kong 0001.HK 281.0 36.0
Hang Lung Properties 0101.HK 140.8 18.0
Henderson Land 0012.HK 108.5 13.9
Sino Land 0083.HK 75.4 9.7
Hang Lung Group 0010.HK 61.1 7.8
New World Development 0017.HK 55.6 7.1
Kerry Prop 0683.HK 55.4 7.1
Hong Kong Property Investors
Swire Pacific 0019.HK 165.9 21.3
Wharf 0004.HK 146.4 18.8
Hysan 0014.HK 36.7 4.7
Great Eagle 0041.HK 16.1 2.1
Note: Market cap figures are as of Feb 14, 2011. Source: Bloomberg.
1.2.2 Bonds of Real Estate Companies
Since Hong Kong property companies have solid balance sheets and low gearing ratios, as shown in Table 1.5, they are not in need of raising cash, hence the bond issuing activities for these companies in recent years have not been active. Mainland developers, on the other hand, are much more aggressive on raising funds through selling debts in Hong Kong. Mainland developers have reportedly raised about a
Stock Market Cap Market Cap PRC Developers Code (HKD Bil.) (USD Equiv. Bi1.)
China Overseas Land 0688.HK 110.5 14.2 China Resources Land 1109.HK 71.0 9.1
Evergrande 3333.HK 59.7 7.7 Longfor Prop 0960.HK 56.3 7.2 Country Garden 2007.HK 51.4 6.6 Shimao 0813.HK 40.4 5.2 Agile 3383.HK 39.6 5.1 Guangzhou R&F 2777.HK 35.8 4.6 SOHO China 0410.HK 30.6 3.9 Sino-Ocean Land 3377.HK 28.3 3.6
Poly (Hong Kong) 0119.HK 24.9 3.2
Franshion 0817.HK 20.5 2.6 Shul On Land 0272.HK 19.3 2.5 KWG Prop. 1813.HK 16.5 2.1 Greentown China 3900.HK 14.7 1.9 Powerlong 1238.HK 10.9 1.4 Shenzhen Inv. 0604.HK 9.3 1.2 Shanghai Forte 2337.HK 8.6 1.1 Sunac 1918.HK 7.5 1.0 Fantasia 1777.HK 6.2 0.8
total of HK$76.5 billion (or US$9.8 billion) from the Hong Kong capital market in 201022; the US Dollar bond issuance of these companies amounted to US$6.45 billion, according to DBS2 . The rush to raise capital in Hong Kong is largely due to the credit tightening policies of Chinese government, limiting the availability of bank loan to these companies24. These US Dollars bonds are generally high-yield issuance with yields reaching as high as 13.5%25 and are usually available to only institutional investors or high-net-worth individuals.
Table 1.5: Debt and Gearing of selected Hong Kong Property Companies (As of Jan 2011)
As at last FY Sho Hang
result SHKP CK Henderson innd Kery NWD Lung Wharf Hysan HCL Champion M1idland
net
Not gearing 15.2% 9.5% 19,2% 21.5% 18.2% 24% cash 17.5% 5.1% 18.8% n/a n/a
Cash on hand
(HK$m) 7,859 11,423 10,495 4,495 6,656 23.600 11,535 18,412 433 9,563 1,406 1.477
Recurrent income
(HK$m) 13,245 8,995 7,106 2,409 1,418 1.720 4,546 7,319 1,707 5.210 2035 n/a
Source: Samsung Securities
1.2.3 Real Estate Funds
Currently, there is no listed-fund on the Hong Kong Stock Exchange. Hong Kong investors can gain real estate exposure through the holding of real estate securities mutual funds, which typically invest in companies in the real estate and real estate-related industries. Most of these funds that invest in Asia (ex-Japan) have a regional mandate to invest in real estate companies across Asia or Greater China.
Investors can also gain real estate exposure through investing in real estate private equity funds. While there believes to be no Hong Kong-focused real estate private equity fund available to investors, which is not too surprising considering the size of the city, there are regional funds that focus on Greater China or country funds that focus solely on China. These funds typically have an opportunistic investment style and invest heavily in development projects in the region.
Private equity has increasingly become a popular financing mean for developers in China and real estate private equity funds with China exposure is now an attractive investment alternative for global investors. The first China-focused real estate private equity fund was closed in 2002, after which the fund raising
22 People's Daily. "Property developers rush for high-yield bond offerings in HK." People's Daily (January 11,
2011)
23 DBS Group Research. "China Property Monthly." DBS Group (January 11, 2011)
24 People's Daily. "Properly developers rush for high-yield bond offerings in HK." People's Daily (January 11,
2011)
activity rapidly heated up and 12 funds raised a total of US$5.4 billion alone in 2008. As at September 2010, there are I funds that focus specifically on China, which amounts to an aggregate commitment of US$4.6 billion26
. In 2010, it is estimated that the total amount of foreign capital in China's real estate industry exceeded RMB 150 billion (approximately US$22.9 billion), as there has been an increasing number of partnerships being formed between Mainland China developers and investment funds that include sovereign wealth funds, namely Government of Singapore Investment Corporation (GIC), and
global private equity players, such as Blackstone, UBS Global Asset Management and GTC Real Estate27
28. While most of these private equity funds are denominated in US Dollars, DTZ, the leading global real estate consultant, predicted that over 80% of these foreign fund management companies that currently have presence in China will set up Chinese Yuan-based funds in the future.
1.2.4 Securitization Products (RMBS/CMBS)
With a well-developed legal framework and a common law system that is largely based upon English law, Hong Kong did not need to introduce specific legislation to facilitate securitization and is considered to be
t4 ,29
one of the most securitization-friendly jurisdictions in the Asia-Pacific region"
RMBS
The first mortgage-securitization deal in Hong Kong was originated by Bank of America (Asia) and was issued in 1994, the year when three other RMBS deals were closed in Hong Kong, with originators include Citibank, Standard Chartered and Cheung Kong, the first real estate developer to enter the MBS arena. However, these four private deals were not perceived to be successful as many thought that "they were not priced appropriately and that potential investors had not been properly educated"30. The four more RMBS deals that were later issued in 1997 were much better received; these four deals were believed to be fully subscribed by domestic and foreign investors31. However, the lack of liquidity and secondary trading prohibited the market to blossom and no RMBS deals were issued in Hong Kong until the emergence of Hong Kong Mortgage Corporation's MBS program.
26 Moylan, Andrew. "China-Focused Private Equity Real Estate Fundraising." Preqin(September 3, 2010)
27 China Breifing. "Foreign Participation Surges in China's Property Development." China Breifing (March 29,
2011)
28 Cruise, Sinead. "UBS/Gemdale JV eyes debut Chinese property buys." Reuters (April 7, 2010) 29 Mallesons Stephen Jaques. "Securitisation in Hong Kong." Global White Page (2008)
'0Lamoreaux, Pamela. "Comparison of Mortgage-Bakced securitization Systems in US, Hong Kong and Korea."
International MBS Seminar (December 20, 2000) 31 Ibid.
Hong Kong Mortgage Corporation
In March 1997, the Hong Kong Mortgage Corporation (HKMC) was established with the missions to enhance the stability of the banking sector by offering a reliable source of liquidity, to promote wider home ownership, and to facilitate the growth and development of the debt securities and MBS markets in
Hong Kong32. Wholly-owned by the Hong Kong government, the HKMC modeled itself after the Fannie
Mae33, a residential mortgage agency in US, and launched a mortgage insurance program in March 1997
with a maximum loan-to-value ratio of 85%. In October 1999, HKMC initiated the Guaranteed Mortgage-Backed Pass-Through Programme, under which HKMC purchased residential mortgages from originating banks, and securitized them into the form of MBS. In the securitization process, HKMC sold the residential mortgages to an SPE, whose notes would then be sold to the investors, who may include the originating banks. There are two key features in this program: i) HKMC guarantees the timely payment of principal and interest of the MBS, and that all cash received by the SPE will be passed-through to the investors; and ii) originating banks could also be one of the investors. Given the latter feature, originating banks had the option of holding the MBS notes to continue receiving a stream of cash flows, or selling the notes to investors for a lump sum of cash. This feature of the program therefore brought itself the name "back-to-back" securitization program in the local banking community.
The year 2001 marked two key milestones for HKMC as it standardized the mortgage origination documents and initiated its second program, the US$3 billion Bauhinia Mortgage-Backed Securitisation Programme that enabled HKMC to arrange issues in multiple currencies to meet the demands of various investors. The success of this program's first two MBS issues, which raised HK$2 billion in March 2002 and HK$3 billion in November 2003 respectively, led HKMC to issue the third MBS deal under the program in November 2004, where the issuance of the HK$2 billion MBS allows participation of both
institutional and retail investors, the first of its kind in Asia at that time.
32 Website of Hong Kong Mortgage Corporation
3 Cheung, Susie, "A Presentation at Asian Bond Market Forum. " The Hong Kong Mortgage Corporation Ltd.
Table 1.6: List of MBS issued by the HKMC
HKMC MBS Pass-Through Programme
Issue Amount Issue Amount (US$ Equiv. In Issue Date Original Seller Series No. (HK$ in million) million)
Oct-99 Dao Heng Bank Ltd. DHHK-0001-4 1,000 128.2
Dec-99 American Express Bank Ltd. AMEX-0005-6 600 76.9
Aug-01 American Express Bank Ltd. AMEX-0007 600 76.9
Jun-06 FORTIS Bank Asia HK BBHX-0012 600 76.9
Total: 2,800 359.0
HKMC Bauhinia MBS Programme
issue Amount Issue Amount (US$ Equiv. In Issue Date Sponsor Series No. (HK$ In mililon) million)
Mar-02 HKMC 2002-1 2,000 256.4 Nov-03 HKMC 2003-1 3,000 384.6 Nov-04 HKMC 2004-1 2,000 256.4 Nov-05 HKMC 2005-1 1,000 128.2 Nov-06 HKMC 2006-1 2,000 256.4 Total: 10,000 1,282.1 Source: H KMC
Despite the past successes of HKMC and its efforts in pushing the development of the MBS market, limited activities in MBS issuance and trading were seen in Hong Kong. In fact, HKMC has not issued any deal since its HK$2 billion issue in November 200634, partially due to the financial crisis that started in mid-2008, which dried up tremendous amount of liquidity and demand for securitization product. More importantly, however, the stagnancy of the market lies somewhat on the supply side. The low RMBS activities in Hong Kong are believed to be due to the follow reasons:
* Other types of conventional funding are readily available at cheap rates";
* Banks have strong liquidity hence have no desire to remove high-quality mortgages from their balance sheets36
;
* Low mortgage rates provided by the banks to customers due to price competition caused the mortgages to be unattractive for an MBS issuance.
1 Pang, Peter. "Hong Kong Mortgage Corporation mortgage-backed securities issues." BIS Review. (2006)
3 Chen, Jef frey. "Structured Finance and Securitisation 2010: Country Q&A -Hong Kong." Mondaq Business
Briefing (April 1, 2010)
36
Lamoreaux, Pamela. "Comparison of Mortgage-Bakced securitization Systems in US, Hong Kong and Korea." International MBS Seminar (December 20, 2000)
CMBS
The first CMBS issuance in Hong Kong took place in September 1995 when Eton Properties launched a single asset securitization deal that was worth HK$959 million37. Soon after that, local developer Sino began to take advantage of this mean of financing and issued two CMBS in 1996 and 1997 respectively. The short-lived boom of the CMBS market came in the period of 1999-2000, when a total of five CMBS deals were recorded in the period, thanks to developer's lack of funding options at that time31. Among the five deals, the Wharf HK$4.49 billion CMBS deal was notably the largest securitization deal in Asia at that time. These deals reportedly attracted both foreign and domestic buyers, as they offered a mean to obtain Hong Kong property exposure other than stocks. However, the CMBS market then fell silent until July 2005, when the Fortune REIT (which was only listed in Singapore then) tapped the Hong Kong
CMBS market for the Triumph HK$2.39 billion CMBS39. The Triumph deal marked the last CMBS deal
done in Hong Kong to-date and highlighted that an active REIT market can be an engine of growth to the CMBS market, a market that Hong Kong is long to have". The main factors contributed to the stagnant Hong Kong CMBS market are believed to be the abundant liquidity and the inexpensive funding sources available for Hong Kong developers.
Table 1.7: List of CMBS issued in Hong Kong
Size Size (in US$ (in HK$ EquLY.
Date Dev~telopr)poso Properties illions) -millions)
Sep-95 Eton Properties 174 luxury apartments in Queen's Garden, 959 123
Central
Nov-96 Sino & the Ng family 425 apartments and 779 carparks in Pacific 1,045 134 Palisades, North Point
5 commercial buildings comprising 2m
Mar-97 Sino&the Ngfamily sq.ft. of offices & 0.Sm sq.ft. of retail 2,340 300 space
7 commercial buildings comprising 1.7m
Feb-99 Wharf sq.ft. of offices and 0.9m sq.ft. of retail 4,485 575
space
21 commercial, residential and industrial
Jun-99 Sino properties comprising 2.445m sq.ft. & 2,356 302
3,385 carparks
Dec-99 Chinese Estate Windsor House, Causeway Bay 1,821 233
Sep-00 Paliburg Kowloon City Plaza, Kowloonn City and 1,400 179 Paliburg Plaza, Causeway Bay
Jul-05 Fortune REIT 11 retail malls owned by Fortune REIT 2,390 306
Source: Asia Financial (Research) and Asset Securitization Report.
" Yip, Jim. "Commercial Mortgage-Backed Securities (CMBS) -An Alternative Debit Financing Instrument for Developers." Asia Financial (Research) Ltd. (2001)
" Ibid.
39 Davies, Rob, "Fortune REITprices step-up coupon Hong Kong CMBS." Asset Securitization Report. (July 25, 2005)
4 0 Gada, Kalpesh. "Asian CMBS Market Review: Real Estate Securitization in India and Factors Favoring CMBS."
1.2.5 REITs
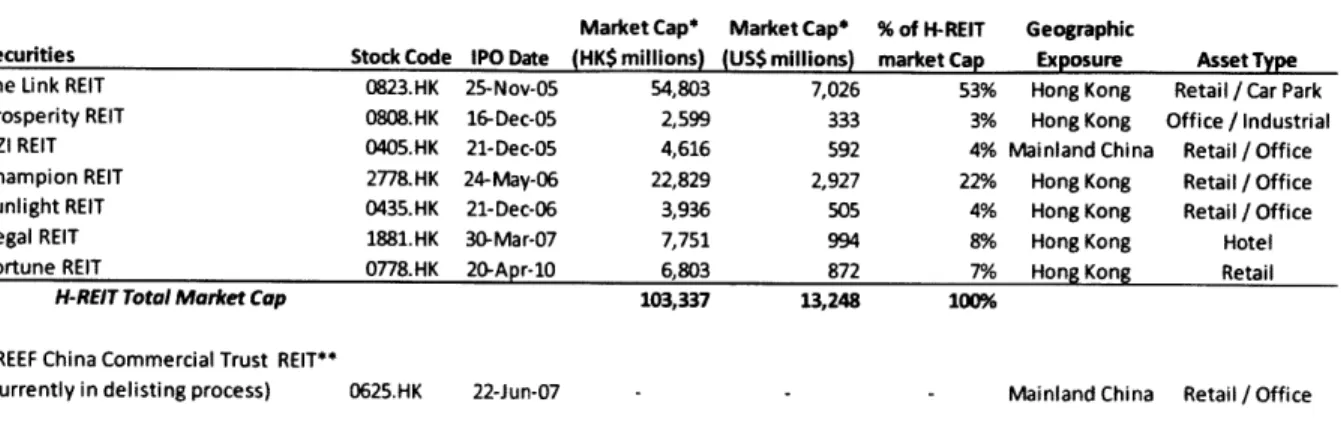
A total of 8 REITs had been listed on the Hong Kong Stock Exchange (one is under-going de-listing process) since the first H-REIT (the acronym for Hong Kong REIT) came to the market in 2005 after the REIT Code was enacted in Hong Kong in 2003. Comparing to other markets, the H-REIT market is rather a slow growing one and sees only one REIT, The Link, dominating the market cap of the asset class. Table 1.8: List of H-REITs as of February 2011
Market Cap* Market Cap* % of H-REIT Geographic
Securities Stock Code IPO Date (HK$ millions) (US$ millions) market Cap Exposure Asset Type
The Link REIT 0823.HK 25-Nov-05 54,803 7,026 53% Hong Kong Retail / Car Park Prosperity REIT 0808.HK 16-Dec-05 2,599 333 3% Hong Kong Office / Industrial
GZI REIT 0405.HK 21-Dec-05 4,616 592 4% Mainland China Retail / Office
Champion REIT 2778.HK 24-May-06 22,829 2,927 22% Hong Kong Retail / Office
Sunlight REIT 0435.HK 21-Dec-06 3,936 505 4% Hong Kong Retail / Office
Regal REIT 1881.HK 30-Mar-07 7,751 994 8% Hong Kong Hotel
Fortune REIT 0778.HK 20-Apr-10 6,803 872 7% Hong Kong Retail
H-REIT Total Market Cap 103,337 13,248 100%
RREEF China Commercial Trust REIT**
(currently in delisting process) 0625.HK 22-Jun-07 - Mainland China Retail / Office *Market cap as of Feb 14, 2011.
** Proceeds resulted from asset sales has been redistributed to investors in April 2010; currently in delisting process.
Before the birth of The Link REIT, Hong Kong developer Cheung Kong had already issued the Fortune REIT, which held a portfolio of suburban shopping malls in Hong Kong, on the Singapore Exchange in 2003, before listing it by introduction on Hong Kong Stock Exchange in April 20104 . The listing of Fortune REIT in Singapore was perhaps one of the driving forces for the Hong Kong government to push for the REITs market.
Valued at HK$22 billion (US$2.8 billion) at the point of IPO, the first H-REIT The Link was sponsored by the Hong Kong Housing Authority, securitizing the 151 shopping centers, and 79,000 parking spaces that were owned and managed by the government agency. It was a major push for the government to jumpstart the H-REIT market. The Link has a "turnaround story" that offers value generation potential through privatizing the properties (from the government's hand) and professionally managing these assets to increase their yields. The Link REIT was successfully launched in 2005 and was the biggest REIT IPO in the world for that year. Within two months after the successful launch of The Link and its resulting positive reception, two more H-REITs were listed. After that, the H-REIT market has not been overly active as there were just four new REITs in 2006 and 2007, followed by a three year drought until the 41 In other words, the Fortune REIT is now dual-listed on both Singapore Exchange and Hong Kong Stock
listing by introduction of Fortune REIT. The H-RElTs have not been actively acquiring properties; for the properties that they have acquired, more often than not the properties are sold by the sponsors of the REITs. In the following, some of the characteristics of H-REITs are discussed.
Cross-border deals
The revision of the REIT Code in 2005 lift the geographic limitation of assets held in REITs helped to bring cross-border deals into the H-REIT scene. The GZI REIT and the RREEF China Commercial Trust REIT were launched in December 2005 and June 2007 respectively. At a time when many believed that China was the next hottest property market, the GZI REIT was considered a golden, if not the only, way to gain a more direct, relative to investing in stocks of developers, China rental exposure via the listed-securities market. GZI's IPO saw oversubscriptions of 81 times and 495 times respectively for its institutional and retail portions42. However, cross-border deals with China assets also present the region-specific risks like the fraudulent case encountered by the RREEF CCT REIT, which led to a downward revaluation of the asset's value.
Financial Engineering
It is worth noting that a number of H-REITs had employed some form of financial engineering to sweeten the terms in order to gain more traction from investors. A couple of commonly used yield enhancement mechanisms are interest rate swap with "step-up" structure and dividend waiver.
Interest rate swap with a "step-up " structure: One of the more commonly seen yield enhancement tools
is the use of a "step-up" interest rate swap arrangement, which was used by Prosperity REIT, Champion REIT and Sunlight REIT4'. Under the terms of agreement, a REIT, with floating rate liabilities, entered into the swap with dealers on the day of IPO, where the REIT would periodically receive floating rate payments and pay fixed rate "step-up" payments, whose fixed (predetermined) interest rates started at a low, below market level and gradually rose during the life of the swap. In order to enjoy the low interest rates in the early part of the life of the swap, the REIT had to make an upfront payment, which was partially funded by the IPO proceeds. The rationale behind entering into a "step-up" swap was that the lower financing cost in the first few years would boost yields for the REIT during that period, and the rise in financing cost (in other words rise in fixed interest rate), due to the "step-up" structure of the swap, should be covered by the rise in rental income. In effect, however, IPO subscribers were funding part of
42 Whiting, Dominic (2006) Playing the REITs Game: Asia's New Real Estate Investment Trusts, John Wiley &
Sons (Asia) Pte. Ltd., Singapore.
that distribution themselves, in the form of paying for the "step-up" swap. Nevertheless, these IPOs were met with sizable demand, as investors hoped to make a quick profit on the jump in share price immediately after IPOs.
Distribution Waiver: In an attempt to enhance yields, the sponsors (or the property companies that spun
off the properties to the REIT), who tended to hold a significant ownership in the listed REIT, would enter into such a waiver to waive their entitlement to any dividend payments for the first few years (for example, Champion REIT's waiver on distribution to its sponsor Great Eagle expired three years after its IPO). The distribution dilution effect, triggered by the waiver's expiry, would hopefully be minimized by, yet again, the rise in rental income.
Other forms of yield enhancement employed include rental guarantee (for the first few years) by the sponsors and payments to the asset management companies in units instead of cash.
Some industry practitioners believe that the financial engineering is one of the reasons that discourage investments into H-REITs. It has also led some investors to believe that only the less desired buildings would be spun-off by the developers, as it was evident that most buildings in the existing H-REITs were not considered trophy assets.
Substantial Ownership by Sponsors
H-REITs, like many REITs in Asia, are also characterized by a significant ownership by sponsors". In addition, the sponsors also have substantial ownership stakes in the REIT manager and asset manager; under this "interconnected structure", related party transactions are common and the potential for conflict of interests are substantial45. With the exception of The Link, which is sponsored by a government agency, the H-REITs still have majority of their units held by sponsors, as shown in Table 1.9.
4Pica, Angela. "Asia-Pacific REITs: Building Trust through Better REIT Governance." CFA Institute (February
2011)
4- Pica, Angela. "Asia-Pacific REITs: Building Trust through Better REIT Governance." CFA Institute (February
Table 1.9: Sponsors' ownerships in H-REITs
Sponsor's ownership
H-REITs Sponsor At IPO Most Recent Record2
Link
HKHA3Prosperity Cheung Kong 22.00% 20.79%
GZI Yue Xiu Property 31.30% 37.10%
Champion Great Eagle 43.20% 51.40%
Sunlight Henderson Land 22.70% 33.1%4
Regal Regal International 67.80% 74.12%
Fortune Cheung Kong 31.6%s 31.60%
Source: Offering prospectuses. 'Assuming full-alotment option exercised.
2 Most recent record acccording to latest annual reports or filings.
3 The Hong Kong Housing Authority is a government entity.
4 The amount is owned by Mr. Lee Shau Kee, the chairman of Henderson Land the sponsor.
Chapter 2. Structure and Policy of H-REITs
2.1 Legislative Framework of H-REITs
The Hong Kong REIT Code was enacted in 2003 and all REIT-related regulation is under the governance of Securities and Future Commission (SFC), the securities regulatory body of Hong Kong. All H-REITs have to follow the unit trust structure and be listed in the Hong Kong Stock Exchange (which is also known as the Main Board). There is no formal minimum capital requirement in the REIT Code, but the REIT must meet the requirements lay out in the listing rules.
Listing Requirement
* The expected market capitalization of a new applicant at the time of listing must be at least
HK$200 million;
e 25% of the units must be held in the public's hands (ie. public float).
Investment Restrictions
" Invest only in real estate that generate recurrent rental income;
e No geographic restrictions (the geographic restriction limit for REITs to hold only Hong Kong-based assets was lifted in 2005);
* Property developments and investments in uncompleted projects should not exceed 10% of the REIT's net asset value;
* Leverage is capped at 45% of gross asset value (revised upward from 35% in 2005); * Holding period of not less than two years unless otherwise approved by its unitholders;
* Must have majority (more than 50%) ownership and control in each property in its portfolio at all
46
time
Payout Requirements
e Must distribute at least 90% of annual net income after tax, while trustee can exclude certain revaluation gains and capital profits.
46 An exception is allowed only if it is proven to be in the best interests of unitholders or a legal opinion stating that
the H-REIT will have a good and marketable legal and beneficial ownership in the property. 25
Tax Considerations
* REIT Level:
j. Hong Kong properties held through SPVs are subject to property tax of 15%, or profits tax of 16.5% from the 2008/09 year of assessment;
ii. Dividend income from SPVs is tax exempt;
iii. No capital gain tax;
iv. No Hong Kong tax on income from foreign properties.
* Domestic and Foreign Shareholders' Level: For both corporate and individuals shareholders
i. Dividends, capital gains47, return of capital distributions, and income from foreign investments are not subject to Hong Kong tax.
2.2 General Structure of H-REITs
The H-REIlTs follow quite a simple and traditional structure as shown in Figure 2.1. H-REITs can be internally-managed or externally-managed. An internally-managed REIT, namely the first H-REIT The Link, is a trust that owns the underlying assets as well as the manager; on the other hand, an externally-managed REIT, a structure that all other H-REITs adopt, is regarded to be a more traditional structure that has an external manager to handle all the management matters8. Most H-REITs would own the properties through wholly-owned special purpose vehicles (SPVs), which are labeled as the "holding companies and property companies" in Figure 2.1; these SPVs were incorporated for the sole purpose of holding these underlying assets**.
Most H-REITs, with the exception of The Link, were sponsored by listed real estate companies in Hong Kong, meaning these companies spun off their properties into REITs and raised cash in return. Although these sponsors no longer directly own the properties underlying the REITs, they still hold a substantial amount of units in these REITs. Moreover, they are heavily involved in the daily management of the REITs and the properties, as the sponsors (or owners of the sponsors) tend to own a majority stake in the REIT manager and the property manager.
" unless on revenue account and arise from trade, profession or business carried on in Hong Kong.
48 Pica, Angela. "Asia-Pacific REITs: Building Trust through Better REIT Governance." CFA Institute (February
2011)
Figure 2.1: Typical Structure of H-REIT
Source: Fox-Pitt, Kelton
2.3 Major Differences Between H-REITs and US-REITs
Structure
Unlike H-REITs, which have to be registered as a unit trust structure, US-REITs can be structured as corporations, trusts, or associations. Moreover, US-REITs can be privately- or publicly- held, whereas H-REITs are mandatory to be listed on stock exchange.
Investment Restrictions
US-REITs are allowed for more flexibility on investments than the H-REITs are. One of the major differences is that US-REITs have no limit on the amount to be invested in development projects for its own portfolio, whereas H-REITs have a 10% limits on its net asset value (NAV). Moreover, US-REITs can invest in mortgages on real estate property, allowing the emergence of equity, mortgage, and hybrid specializations in REITs. In addition, US REITs have no leverage limit and no holding period restriction5 0
, whereas H-REITs are subject to a 45% of gross asset value (GAV) leverage limit and a two-year holding period. All of the above essentially allow investors to have more choices in US-REITs along the risk and the asset class spectrums.
50 However, only sales of properties with over two-year ownerships by US REITs would comply with the safe harbor rule and be eligible for tax benefits.
Dividend Payout
A 90% threshold is adopted by both US-REITs and H-REITs, though this rule is applied to the taxable income (other than capital gains) for US-REITs and after-tax income for H-REITs.
Conversion into REIT status
Hong Kong has no specific transition regulations for corporations converting into REITs. US companies can file a special tax return in the year that it wishes to convert.
Tax considerations
For US-REITs, the dividend distributed to investors are not taxed at the REIT (or corporate) level; instead, the dividend payments (as well as distributions of capital gain and of return of capital) are taxed at the investors' level. On the other hand, corporate tax is applied to the H-REITs' taxable income, but dividend payment (or any kind of distributions) at the investor's level is not taxed. Some may therefore conclude that the REIT status provides tax exemption at both countries though at different levels; however, one must also note that dividend payments from any public stock investments are not taxed at the investor's level in Hong Kong, hence investors are not any better off in investing in units of H-REITs or stocks of public companies. Since H-REITs do not enjoy any tax breaks, unlike the US REITs, there also is no apparent tax incentive for developers to spin-off their assets into REITs or convert themselves into REITs5 1.
2.4 Major Differences between H-REITs and other major Asian REITs5 2
Hong Kong is considered a late-comer in the development of REIT market in Asia, as Japan, Singapore, and South Korea introduced their respective REIT legislations in the 2000-2002 period and saw the first REIT issuances in their respective markets shortly after that. In comparison to other major REIT markets in Asia, Hong Kong appears to have a stricter regulation. First, all H-REITs have to be listed on the stock exchange, while this is optional for REITs in Japan and South Korea. Moreover, Hong Kong has a lower leverage limit than other, as well as an investment restriction of only investing in real estate, whereas in other major Asia market, REITs only have to invest a minimum of 70-75% in real estate or real estate related assets. A summary of the comparison of H-REITs to other Asian REITS can be found at the Table 2.2.
51 Whiting, Dominic (2006) Playing the REITs Game: Asia's New Real Estate Investment Trusts, John Wiley &
Sons (Asia) Pte. Ltd., Singapore.
52 KPMG International. "Taxation of Real Estate Investment Trusts: An overview of the REIT regimes in Europe,
'1
I
q ~
II~ ~
*~ll
Iif
il 21IcH-U
'tL' l9.i
z
Iis~
til
?-qI~jif
U[[1
p
~~4tIjI
I
[
I ~U
1i~
I'p
I
i.
jSLi
Chapter 3. Analysis of H-REITs
3.1 Individual REIT Analysis
The Link RElT (823.11K)
IPO
Date: 25-Nov-05 Market Ca: HK$54,803m (US$7,026m)Asset Manager: The Link Management Ltd.
Sponsor: Hong Kong Housing Authority (HKHA)
Geographic Exposure: Hong Kong
Strategy: Main strategy is to drive revenue from stablised shopping centres and
deliver incremental revenue from completed asset enhancement
initiatives. Management team looks to extract growth and value
potential from existing portfolio.
Asset type: Retail / Car park
Credit Rating: A/A2
Portfolio: It has a portfolio of 180 properties comprising 149 integrated retail and
car park facilities, two standalone retail facilities and 29 standalone car
park facilities. The portfolio had internal floor area (IFA) of approximately 11 million square feet of retail space and approximately 80,000 car park spaces.
Distribution of Property
Value by Types
Car Park
Property value amounted to HK$53.8b as of March 2010. Tnn ' Prnesitia hV V1nL*
Iz Lok
Distribution of Retail IFA
by Districts
Total Retail IFA amounts to appx. 11mil. sq ft as of March
I I I -|RetailIKowloon * As at 3 Mar2010.
IPO Price
10.30
As of 31Mar11 -Share Price 24.35 52-week high 25.40 52-week low 18.62 Dividend Yield 14.19%Source: Company data and Bloomberg.
1 204,3141 9401 101.58 1 6.35% I 1,503.0 1 2.8% 1
Prosperity REIT (8 8.1HK)
IPO Date 16-Dec-05
Market Cap: HK$2,599m (US$333m)
Asset Manager: ARA Asset Manager (An wholly-owned subsidiary of Cheung Kong)
Sponsor: Cheung Kong (Holdings)
Country Exposure: Hong Kong
Asset type: Office / Industrial
Strategy: The management team aims to benefit unit-holders through proactive asset
management and multi-dimensional growth strategies, such as asset enhancement and tenant mix fine-tuning.
Portfolio: The portfolio contains a total of 7 properties: 3 Grade-A office buildings,
3 industrial/office buildings, 1 industrial buildings. With a total gross rentable area of about 1.22 million sq. feet, these properties have a valuation of HK$5,529 million as of June 30, 2010.
Distribution of Property
Value by Types
Gr. A Office 65% Industrial / Office ,32% Industrial 3% Property value as of June 30, 2010.Ton 3 Pronerties by Valne*
Distribution of Property
Value by Districts
Kowloon West HK Island East 21% Kowloor East 68% Valuation as of June 30, 2010.Uh Metropois Tower I Office I Kowloon East 1 271,418 98 69.3 1 2,055.0 37.2%
Prosperity Millennia Plaza
I
Office HK Island East 217,955 -43 1 37.3 1,182.0 21.4%Prosperity Place IndustriaVOffice Kowloon East 240,000 60 29.5 711.0 12.9%
* As at 30Jun2010. ** As at 31Dec2009. IPO Price 2.16 Share Price 1.92 52-week high 2.00 52-week low 1.35 Dividend Yield 5.72%
GZI REIT 405.11K
IPO Date 21-Dec-05
Market Cap: HK$4,61 6m (US$592m)
Asset Manager: GZI REIT Asset Management
Sponsor: Guangzhou Investment Company (GZI)
City Exposure: Guangzhou city, Mainland China
Asset type: Retail / Office
Strategy: The Manager adopted specific assts strategy for each of the five properties
so as to optimize the competitiveness of the properties and achieve constant growth of the asset portfolio revenue. The manager also adopts active and prudent investment and financial principles.
Portfolio: Two Grade-A offices, a wholesale shopping center, a retail shopping
center, and a commercial complex. The total portfolio amounted to RMB 5.22b. The aggregate area of ownership was approximately 223,614.3 sq. meters; total rentable area was approximately 211,031.1 sq. meters.
Distribution of Property Value
by Types
-Wholesale Shopping l 56% Commercial Complex 12% Retail_ Shopping 12% -. Gr. A OfficeTc Property value as of June 30, 2010.
White Horse Building
Shop Center Yuexiu District 50,128 243.6 2,943.0 56% Fortune Plaza Office Tianhe District 41,355 49.4 608.5 12%
City Development Plaza Office Tianhe District 42,397 45.6 431.0 80/0
* As at 30Jun2010.
** As at 3 1Dec2009. Estimates based upon the split of operating income.
IPO Price 3.08
Share Price 4.06
52-week high 4.39
52-week low 3.14
Dividend Yield 6.13%
Source: Company data and Bloomberg.
Distribution of Property Value
by Districts
Tianhe Dist. 31%
Property value as of June 30, 2010.
IYuexiu Dist. 69%
Champion REIT (278.11K)
IPO
Date 24-May-06Market Cap: HK$22,829m (US$2,927m)
Asset Manager: Eagle Asset Management (CP) Ltd.
(a wholly-owned subsidiary of Great Eagle Holdings)
Sponsor: Great Eagle Holdings Ltd.
City Exposure: Hong Kong
Asset type: Office / Retail
Strategy: The manager looks to add value through asset management strategies, such
as rental income maximization, occupancy and tenancy renewal management and tenant base optimization. The manager actively considers yield accretion acquisition opportunities and had acquired the Langham Place in 2008 from the Great Eagle.
Portfolio: Contains 2.85 million sq. feet of prime office and retail floor area by way
of two properties: Citibank Plaza and Langham Place. Total valuation amounted to HK$45,302m as of June 30, 2010.
Distribution of Property Value
by Types
Gr. A Office
Misc.
J
1% Property value as of June 30, 2010.Fon 3 Pronertiev in Vae*
Distribution of Property Value
by Districts
Kowloon Retail 21% \-Car Park 1% t HK Island CBD 66% Property value as of June 30, 2010.LCwanK Flaza Lce lafIsa Cu 1.36 M 6 0 1,314.5 29,923.0 66%
Langham Place Mixedue Kowloon West 1.29 m 250 566.2 15,378.0 34
* As at 30Jun2010. ** As at 31Dec2009. IPO Price 5.10 Share Price 4.51 52-week high 5.01 52-week low 3.40 Dividend Yield 5.28%
Sunight RIEIT (435.UK)
IPO Date 21 -Dec-06
Market Cap: HK$ 3,936 m (US$505m)
Asset Manager: Henderson Sunlight Asset Management Ltd
(a wholly-owned subsidiary of Henderson Land Development Company)
Sponsor: Henderson Land Development Company Ltd.
City Exposure: Hong Kong
Asset type: Office / Retail
Strategy The Manager devotes effort in asset enhancement, tenant acquisition and
capital management to add value for unit-holders. The team also considers acquisition opportunities.
Portfolio: With 1.29m sq. feet in gross rentable area with an appraised value of
HK$10.72b as at June 30, 2010, the portfolio contains 12 office and 8
retail properties.
Distribution of Property Value
by Types
Gr. A Office 27% Gr. B Office 23% .Retail -Urban 3% Retail - Ne0 Town 47%Property value as of June 30, 2010.
Distribution of Property Value
by Districts
Ne Territc 47 HK Island 46% Kowl on 7%Property value as of June 30, 2010.
Sheong SAr Cee Retail New Territories 122,339 297 89.3 4.40% 2,536.0 24%
Metro City Phase I Property Retai New Territores 188,889 457 71.8 4.50% 1,928.0 18%
* As at 30Jun2010. IPO Price 2.60 AI of31Mar11 Share Price 2.46 52-week high 2.64 52-week low 1.87 Dividend Yield 6.51%
Source: Company data and Bloomberg.
w ories
%0
Regal REIT (1881.HK)
IPO Date 30-Mar-07
Market Cap: HK$ 7,751m (US$994m)
Asset Manager: Regal Portfolio Management Ltd.
(a wholly-owned subsidiary of Regal Hotels International Holdings)
Sponsor: Regal Hotels International Holdings Ltd.
City Exposure: Hong Kong
Asset type: Hotel
Strategy The Manager's primary objectives are to provide stable, growing
distributions and long-term capital growth for the unitholders through active ownership of hotels and strategic investments in hotels, serviced apartments or commercial properties (including office properties).
Portfolio: With a total GFA of 2.34m sq. feet, the portfolio is comprised of 6 hotels
that combined to have a value of HK$14.29b as of December 31, 2009.
Distribution of Property Value
by Types
Distribution of Property Value
by Districts
New Territories 41% HK Island J 26%Property value as of December 31, 2009.
ToD 3 Properties by Value*
Kowloon Property value as of December 31,2009. 33%
Regal Aiport Hotel Hotel New Territories 774,880 8.00% 3,20.0 25%
Regal Kowloon Hotel Hotel Kowloon 341,714 5.70% 3470.0 24%
Regal H Hotel Hotel HK Island 269,988 6.00%/o 3,160.0 22%
*As at 31Dec2009.
IPO
Price 2.68 Share Price 2.49 52-week high 2.49 52-week low 1.67 Dividend Yield 6.87%Source: Company data and Bloomberg.