The Annotation Station: An open source technology for data visualization and annotation of large biomedical databases
by
Omar T. Abdala
Submitted to the Department of Electrical Engineering and Computer Science in Partial Fulfillment of the Requirements for the Degrees of
Bachelor of Science in Electrical [Computer] Science and Engineering and Master of Engineering in Electrical Engineering and Computer Science
at the Massachusetts Institute of Technology
MASSACHUSETTS INSTiTUTE
February 4, 2005 OF TECHNOLOGY
Copyright 2005 Omar T. Abdala. All rights reserved.
JUL
18
2005
LIBRARIES
The author hereby grants to M.I.T. permission to reproduce and distribute publicly paper and electronic copies of this thesis
and to grant others the right to0p so.
Author
Department of Electrical Engineering and Computer Science February 4, 2005
Certified by
Prof. Roger Mark Thesis Supervisor
Accepted by
Prof. Arthur C. Smith Chairman, Department Committee on Graduate
1 IN TR O D U CTIO N ... 4
1.1 CHALLENGES AND OPPORTUNITIES IN THE ICU ... 4
1.2 THE ENVISIONED SOLUTION - AN ADVANCED MONITORING SYSTEM ... 6
1.3 TOOLS TOW ARD THE SOLUTION ... 7
1.4 THE N EED FOR A N EW ANNOTATED DATABASE ... 8
1.5 THE ANNOTATION CHALLENGE ... 1. 1 2 DA TA D ESCRIPTIO N ... 13
2.1 SUMMARY OF COLLECTION... 13
2.2 D ATA TYPES ... 13
2.2.1 Text D ata... 13
2.2.1.1 Clinical progress notes... 13
2.2.1.2 Discharge Summaries and Other Text Based Laboratory Reports ... 14
2.2.1.3 A larm s... 15
2.2.2 Unevenly Sampled Numeric Data... 15
2.2.2.1 Chartevents (Nurse V erified V alues)... 15
2.2.2.2 M edication drip rates ... 17
2.2.2.3 1/O Fluids ... 18
2.2.2.4 Census data ... 19
2.2.3 Evenly Sampled Numeric D ata ... 19
2.2.3.1 Param eter Data... 19
2.2.3.2 W aveform s... 20
2.3 DATA FORMAT... 20
2.3.1 Breakup ofD ata... 20
2.3.2 Chartevents Locations ... 24 3 DA TA LO A D IN G ... 25 3.1 READCEFILE ... 25 3.2 LOADING PROCEDURE ... 25 3.2.1 Patient Load... 26 3.2.2 Update Time... 26 3.2.3 W aveform Load... 27
3.3 FUTURE DATA FORMAT ... 28
4 D ESIG N CO N SIDERA TIO N S... 30
4.1 U SER INTERFACE DESIGN PRINCIPLES ... 30
4.2 ANNOTATION REQUIREMENTS ... 33
5 ANNOTATION STRUCTURE AND METHODOLOGY... 36
5.1 ANNOTATION ELEMENTS ... 36
5.1.1 The State Annotation... 36
5.1.2 The Flag Annotation ... 37
5.1.3 The Problem Annotation ... 37
5.1.4 Putting the Annotations Together ... 38
5.2 RECORDING ANNOTATIONS ... 39
5.3 DOCUMENT TYPE DEFINITION DESCRIPTION ... 40
6 USE OF THE ANNOTATION STATION ... 43
6.1 VIEWING - DATA PRESENTATION IN THE ANNOTATION STATION ... 43
6.2 INFORMATION VIEWER ... 43 6.3 SIGNAL PANEL ... 47 6.4 W AVEFORMS ... 49 6.5 ANNOTATIONS ... 50 6.5.1 Flag Annotations... 51 6.5.2 Problem Annotations ... 52 6.5.3 State Annotations ... 52
6.5.4 Annotations Tree viewer ... 55
6.5.5 Deleting an annotation or link... 55
7 DOCUMENTATION OF JAVA INTERFACES... 56
7 .1 A W .JA V A ... 5 6 7.2 JLABELW ITHANNOTATION.JAVA... 59 7.3 INTERNALANNOTATION.JAVA ... 59 7.4 ANNOTATIONSPOPUPBOX.JAVA... 60 7.5 ADDEVIDENCEACTIONLISTENER.JAVA... 61 7.6 TIMELINE.JAVA ... 61 7.7 SIGNALPANEL.JAVA... 63 7.8 SIGNALPROPERTIES.JAVA ... 64 7.9 SIGNALDATA.JAVA ... 66 7.9.1 TrendData.java ... 69 7.9.2 ParamData java... 70 7.9.3 WaveData java... 71
8 DISCUSSIONS AND CONCLUSIONS... 72
9 APPENDIX A: DOCUMENT TYPE DEFINITION OF ANNOTATION...74
10 APPENDIX B: ITEM IDS BREAKUP FILE... 76
11 APPENDIX C: MEANINGS OF STATE ASSESSMENTS ... 80
11.1 OVERALL STATE ... 80
11.2 STATE TRAJECTORY ... 80
11.3 CARDIAC FUNCTION / VASCULAR DISTENDING VOLUME / PERIPHERAL RESISTANCE ... 80
1
Introduction
Over the past 20 years, there has been a large ongoing effort in the Laboratory for Computational Physiology (LCP) to collect and annotate large databases of physiologic signals in order to facilitate an open initiative to develop algorithms to automate a variety of clinical tasks [1]. The success of this approach motivated the collection of a temporal database of signals typically collected in the intensive care unit (ICU) from the Beth Israel Deaconess Medical Center (BIDMC), known as the Multi-parameter Intelligent Monitoring for Intensive Care (MIMIC) database [11]. Although certain basic clinical information was recorded about the patients in this database, much of the information available from the ICU, such as nursing notes, were not recorded. Approximately 5 years ago, the LCP began an initiative to collect a massive temporal database consisting of almost all the information available in the BIDMC ICU [3] known as MIMIC II. This database not only consists of the beside monitor waveforms collected in the original MIMIC database, but also most of the sources of information available to the clinical staff, ranging from medication drip rates and fluid balances, to subjective evaluation scales and discharge and clinical progress notes detailing patient interventions, reactions, clinical visits and past medical history.
The complexity of this database presents many challenges, but also many opportunities for the application of technology to improve patient care. In particular, previous review and annotation schemes are inappropriate for this type of data. A system for efficiently presenting this information in a coherent manner to an expert reviewer is required. Furthermore, an updated annotation structure for providing machine-readable descriptors of the clinical evaluation through time must be developed. This thesis details a system that attempts to provide a framework to facilitate the annotation process. The implemented solution is an Annotation Station used for clinical data review and annotation recording.
1.1 Challenges and opportunities in the ICU
Current trends in ICU demographics include, aging populations [13], a reduction in the clinical staff to patient ratio [19], increased reliance on technology [14] and an increase in the volume of data recorded for each patient [15]. All of these factors lead to an increasing stress on modem ICUs.
Within the ICU, a tremendous amount of data is collected, displayed and stored [14]. The variety and volume of this data can present a burden to clinicians in the form of information overload. Clinicians are expected to be aware of and react to all the available
information. Unfortunately, it is difficult for a person to maintain the necessary vigilance and concentration on this continuous data stream and to recognize and react to important changes in patient state. Furthermore, the high number of multiple simultaneous signals that must be assimilated and correlated in order to provide a correct assessment of the patient's state are presented in a variety of formats, including written notes, machine drip rates or threshold settings, audible clues (such as alarms or verbal exchanges) and graphical formats (such as charts or waveform morphologies). To aid this situation, many alarm algorithms have been developed to indicate critical events in each of the streams of data. However, these algorithms generally produce a tremendous number of false alarms
[16] (in order to reduce the probability of missing a real alarm) and little inter-signal
correlation is performed to alleviate these problems. Not only do these false alarms cause resources to be inappropriately directed, and the clinical staff to become desensitized to the importance of the alarm, but also the unnecessary increase in noise and activity can lead to deterioration in the efficacy of the care administered to the patient [12]. In order to alleviate this situation a new approach to presenting and synthesizing this data is required.
While the tremendous amount of data collected in the ICU presents many challenges, it also presents many unique opportunities. Collecting and annotating a rich database of
ICU data, including alarms will provide an infrastructure on which more intelligent
algorithms can be tested. The current feasibility of collecting and analyzing such data can be attributed to the advent of low cost computing power, massive data storage capabilities and high-speed networks. The cost of data storage has dropped drastically over the last five years (and continues to do so) and this makes it possible to maintain a huge database of patient records containing tens of thousands of patient stays. Moving this data between systems for analysis and review is far less cumbersome than it would have been several years ago with recent advances of terabyte Firewire drives and gigabit Ethernet. Large increases in disk access speed, RAM size and CPU speeds means that large sections and multiple channels of data can be rapidly processed and allow efficient algorithm development. For example, a typical desktop computer with 1Gb of RAM provides the facility to load an entire patient record into memory (for display or processing) and therefore rapidly review or operate on the entire stay at once. With the current rate of increase in memory capacities, the simultaneous processing of multiple patient records is now a possibility.
The MIMIC II database currently contains over 3000 complete patient records and 1 terabyte of data, and will continue to grow to a projected 10000 records [4]. In order to develop a set of robust algorithms that assist clinical decision making in the ICU, expert annotations detailing the clinical evaluation and decision process must be made. However, neither a platform to efficiently review the sum of all ICU data, nor a current
1.2 The Envisioned Solution - An Advanced Monitoring System
In order to alleviate the problems detailed above, an Advanced Monitoring System
(AMS) has been proposed [4]. The AMS is a framework within which all data available
in the ICU is considered jointly and intelligent decisions are made about how to alarm and whether or not to alarm. The main goal of the AMS is to use the multiple streams of data available in the ICU to assess the current state and predict the future state of the patient. The way the AMS can do this is to perform multi-dimensional analysis, which will result in improved signal quality metrics, hypothesis generation, physiological state tracking, and alarms.
One of the most important issues connected to Intelligent Patient Monitoring (IPM) is that of hypothesis generation, where an algorithm automatically determines the state of the patient and reports it to the clinicians. As a result, this automatic determination may reduce the time necessary for a clinician to perform an assessment and come to a conclusion concerning the state of a patient. Not only would this reduction in time result in a condition being treated earlier and more effectively, but also it would free resources and increase the level of care and attention to other patients. Algorithms for hypothesis generation may also detect complex and subtle combinatorial trends that are either impossible for a human to detect or are too taxing for them to invest the effort to do so. For example, it could be found that a weighted combination of changes in heart rate, blood pressure, oxygen saturation, respiration, hematocrit, and urine output is significant for some condition although subsets of these signals exhibiting the same changes may be normal. It is unreasonable to expect a clinician to be able to assess all these parameters simultaneously. Such a multidimensional space of parameters would most probably have a nonlinear and complex decision boundary between healthy and unhealthy patients which itself may be best described in terms of probabilities. Determining these boundaries requires the analysis of a large database and implementation of an alarm system may not be amenable to human interpretable thresholds. However, the more computationally intensive an alarm trigger is and the less intuitive the reason for an indication of abnormality, the less a direct hypothesis for the problem can be derived. A unintuitive, yet effective alarm is nonetheless useful.
Another simpler possible modality of IPM is that of acuity scoring, where the time evolution of how acute or critical a patient's state has become is recorded. This is important in a clinical setting because it allows the identification of high-risk patients to be identified to improve efficiency and save time. The prioritization of patients needs to be automated so as not to occupy valuable ICU clinician time. An acuity score should take into account the health of several systems in the body and combine them so that overall risk can be quickly assessed. If this risk can be assessed, clinicians will be able to focus their attention on more critically ill patients and make the necessary interventions at the appropriate times thereby improving patient care.
One seemingly simple modality of IPM is the task of determining which of the patient data is abnormal and of note in determining the state of the patient. This would be extremely useful to clinicians since this type of algorithm could automatically bring relevant data to their attention in an effective and accurate manner.
If the concept of an acuity score is extended to include prediction, then the process can be automated to produce early warning scores (EWS). [17] An EWS score attempts not only to answer the question of what state a patient is in at a given moment in time, but also to predict the state of the patient at a later time from the data at previous times. This prediction can provide clinicians with early alerts to deteriorations in patient state, which will allow them to intervene sooner and, ideally, to avoid the predicted deterioration.
1.3 Tools Toward The Solution
In order to develop a functional AMS, a framework must be constructed that allows the clinician to answer the following questions:
1) What is the current state of the patient given the current and past data?
2) What is the prospective diagnosis at a future time given the current and past data?
3) What are potential treatment options and which of these do the AMS recommend
given the current and past data?
Different branches of Computer Science and Electrical Engineering attempt to answer these questions in different manners. Three general approaches have been considered when developing the plan for the AMS.
One way of answering the above questions is to apply a statistical model to a large corpus of patients. The answers to the posed questions are then found through looking at past patients where the answers to these questions are known. Firstly, a conditional distribution is derived over the possible answers to the questions given the available data. Then an appropriate estimate is selected depending on the desired properties of the estimate. There are many forms that this approach can take which are collectively referred to as Machine Learning. One important example of a machine learning problem relevant to patient state determination is that of classification problems.
A second way of answering these questions is to mathematically model the underlying processes that cause the observable data. For example, a cardiovascular model has been developed at the Laboratory for Computational Physiology [18]. Using such a model, parameters can be estimated with observable data to provide clues as to the underlying physiology that produce the observed patterns in these data sections.
The third method of answering these questions involves text-based knowledge extraction. Instead of limiting oneself to the numerical data available to the AMS, text knowledge extraction can be performed on the corpus of notes that are routinely written as part of a patient's documentation. These resources are rich in contextual information concerning the patient's history and previous events. The results of this type of knowledge gathering can aid any other technique by making the context it discovers available.
1.4 The Need for a New Annotated Database
In the past, in a limited context, there has been success in arrhythmia analysis and the use of artificial intelligence (Al) techniques in analyzing the ECG waveform [1]. Mark et. al. [20] demonstrated this approach by developing appropriate graphical user interfaces (GUI) and algorithms and having clinically trained experts annotate each beat on a set of ECGs of patients suffering from a variety of conditions. By open-sourcing these databases [2] the biomedical signal processing community has developed and improved algorithms that perform arrhythmia analysis. It is hoped that the community that has developed from the Physionet resource can be leveraged in order to collectively solve some of the problems of IPM. There are several reasons why IPM is much more difficult than arrhythmia analysis. Firstly, the arrhythmia problem is naturally synchronized by the onset and shape of beats. In the case of the ICU problem, it is unclear how to divide the patient stay into time units, or even what time scale over which it is appropriate to view the data. In the arrhythmia problem, there are a limited number of distinguishable complications and effects. For example, the ECG can be tachycardic, there could be fibrillation, or there could be ST changes [21]. The number of potential complications for an ICU patient is enormous in part because of the complex interaction of the multiple organ systems in the human body. In fact, the entire NIH Universal Medical Language System (UMLS) [7] database structure is an effort to be able in part to simply express some of these ICU complications in a regular and formulaic way. The massive number of codes in the UMLS is [10] a result of the fact that complications can involve several organ systems, each of which in itself has a tremendous number of complications that can occur. Aside from the annotation process, the data itself is far more tractable in the ECG arrhythmia problem where one signal source is present, which can be parameterized by a finite and small number of features related to intra-beat times and amplitudes. In the ICU problem, many different types of data must be dealt with, which are not all as easily
parameterized and identified as in the case of the ECG.
Despite the challenges involved, a couple of attempts have been made at the LCP to collect the type of database necessary to support multi-dimensional IPM. Initially, between 1994 and 1997, Mark et. al. [11] collected data from the BIDMC ICU and carefully selected 100 patients who were deemed to be representative of the ICU population. They then publicly posted these records on physionet [2] for dissemination in the research community. This database proved to be highly important in developing and validating algorithms related to heart arrhythmias and hemodynamic alarms based on
ECG and ABP [22]. Following the success of this database, Mark et. al. [4] began the
ongoing effort named MIMIC II which took advantage of new technological capabilities in high speed networking and massive data storage to record a richer set of data for a dramatically larger set of patients over their entire ICU stays. MIMIC II now includes data for over 3000 patient records. The limits of MIMIC I, which consists of only 100 patient records each of length 24 or 48 hours, are striking. Each of these records consists of at most a set of waveforms and measurements as well as some clinical information in an Access database. The most important and critical difference between MIMIC I and MIMIC II is that there are no annotations concerning a patient's state on MIMIC I data. Therefore, it cannot be used as is for a testbed to validate algorithms without significant extra work invested in it. The goal of MIMIC II is to produce a database with a set of data almost as rich as is available in the ICU (with notes, medications, lab values, trend plots, waveforms) that is annotated to the extent that representative subpopulations can be selected out of the larger database and separated into categories that lend themselves to be used as a testbed to validate multi-parameter algorithms.
There are several similar data collection efforts also ongoing in the medical research community. For example, the SIMON database [5] at the Vanderbilt University Medical Center (VUMC) collects almost as much information as is in the MIMIC II database except waveforms. In fact, the monitors in use for the collection of the SIMON database are the same Philips CareVue monitors that are used at the BIDMC for the collection of MIMIC II. The IMPROVE [6] data collection project assembled a significant amount of waveform and trend data from the Kuopio University Hospital in Finland. However, MIMIC II provides significant additional information beyond these data collection systems, which facilitates the clinician to assess the state of a patient. In particular waveforms, parameter data, clinical progress notes, lab tests, medications, and fluids data are available in MIMIC II as will be described in Section 2.
Of the previous attempts at creating annotated databases, SIMON comes closest to, but
falls short of, the type of database that would support this form of annotation. At the
VUMC, clinicians respond to alarms and indicate whether they are true or false and
physiologically relevant or not. These clinicians also have the option of including free text notes that describe the information they have entered. SIMON would be sufficient for work in reducing the plethora of false alarms existent in the ICU, but this type of annotation scheme will not support the hypothesis generation and clinical reasoning to be gained from the AMS. Firstly, without coded identifiers, it will be impossible to construct any type of labeled test and training set for this purpose. Secondly, without a good approximation of the onset and offset of a condition, there is no basis against which to
evaluate the performance of a prediction algorithm. If an intelligent algorithm is to predict the onset of some condition, that onset must first be clearly known. Thirdly, without the links to the data streams, relevant portions of data cannot be identified. Fourthly, causal links between patient states are critical in determining the evolution of the disease in a patient. Fifthly, quantitative evaluations of the patient state give us a target against which to evaluate our algorithms for estimating patient state. Therefore, the MIMIC II effort and its annotation scheme are completely indispensable in facilitating the advancement of Intelligent Patient Monitoring.
As the MIMIC II database stands now, it is a large and growing set of patient records with a rich array of data recorded. This will prove useful in clinical studies where a researcher can retrospectively examine the effects of various treatments and medications on patients with different histories and conditions and can hypothesize on how to create better treatments, how to better identify which patients are good candidates for particular treatments, or how to better prepare patients for these treatments.
As the listing of tools that are leveraged for development of the AMS demonstrates, a test bed is needed to guide development and validation of the results of probabilistic models of disease progression and deterministic models of physiological systems. It is important to note that framing the problem properly is of critical importance in clinical decision making. Once a set of features to use for prediction and physiological state evaluation are clearly identified in quantifiable terms and records have been annotated with a clear label for presence or absence of a condition or event to predict, many tools from artificial intelligence can be used to analyze this data. Such annotations can be used to break down the patients into subpopulations by disease category, and well-known classification techniques can then distinguish patients of one type from patients of another type. It is clear, though, that in order to do this, we need to construct a massive, annotated ICU patient database. A standard result from learning theory, dubbed the "curse of dimensionality" states that the amount of training data required by any algorithm grows exponentially as one increases the number of parameters to consider. Since the AMS must produce multi parameter alarms, we know that the amount of labeled data we need is immense. This is further emphasized by the fact that studies will typically be done on subpopulations within the ICU. For example, if one wants to find and model the effect of levophed on a patient who was previously septic, there are probably only a limited number of patients who fulfill these criteria. Therefore, we want an annotated database large enough that at least for some subpopulation groups, there is enough data to provide the statistical power necessary to pursue the work of the AMS. The key to IPM and the successful development of an AMS is therefore its formulation as a standard machine learning or modeling problem and an annotated testbed is therefore critical.
1.5
The Annotation Challenge
Waveforms - Advanced Monitoring System
Trends s
Labs
~Ue
Notes User
Machine Physiological State
Interface
Assessment: Machine Learning Modeling I Text Knowledge Disocovery Alert I System
Human Expert
Waveforms --- Reasoning Trends . Ann Labs -Station
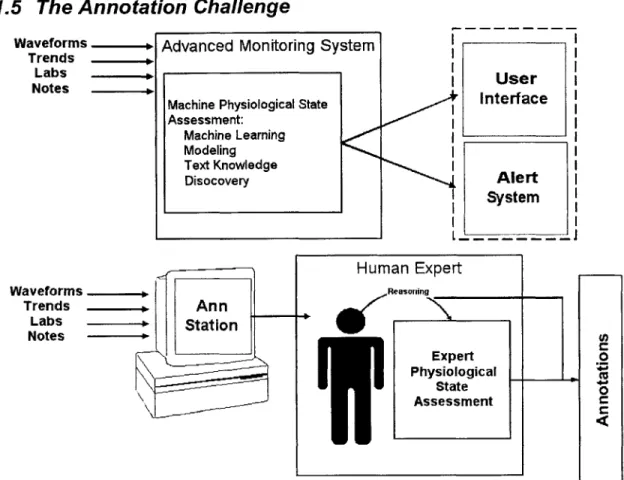
Notes -r Expert 0 \i Physiological State AssessmentFigure 1. The annotator must imitate the AMS in analyzing the data and developing a hypothesis. The AMS displays this data to the clinicians. The annotator records his analysis in annotations.
In order to produce an annotated testbed, expert human annotators must hand review the cases in the database, reason about the patients' states and record that reasoning in a human and machine readable format. Essentially, the humans are imitating the intelligent alarms we hope to produce. By presenting the annotators with the same data at the disposal of the AMS, and recording their assessments of the patient's state, we can evaluate our AMS against the thought process of these annotators. The tool developed to support human annotation is termed the "Annotation Station". See Figure 1 for a schematic representation of the role of the Annotation Station in the annotation process. The Annotation Station must perform several functions effectively and efficiently to enhance the annotators' understanding of each medical case and to allow them to efficiently record that understanding thus maximizing the quality of the produced annotations. The goals of this M. Eng. Project are therefore to design an Annotation Station that:
1) provides efficient access to the huge amount of Mimic II data that is distributed over vastly different storage formats.
2) fuses and enforce time synchronization over data that is collected asynchronously, suffers from missing data points and missing data channels.
3) provides a flexible GUI for reviewing and analyzing patients. It must enable
customized views for reviewing cases where different disease processes are active.
4) provides annotators the ability to organize and their reasoning and logical flow and record it in a human and machine-readable format.
The following 6 chapters detail the implementation of a software system to fulfill these goals. In chapter 2, a description of the format of the MIMIC II data is presented. In chapter 3, the method used to load the data into the Annotation Station is described. In chapter 4, an overview of the design considerations made when constructing the Annotation Station are discussed. In chapter 5, the annotation structure and methodology for annotating is presented. In chapter 6, a guide to using the Annotation Station interface is given. In chapter 7, documentation of the Annotation Station software classes is given. Finally, in chapter 8, a summary of the utility of this framework and future development strategies are presented.
2 Data Description
2.1 Summary of Collection
The transfer of the MIMIC II data from the BIDMC to MIT involves acessing two different data bases which use two different formats. One type of data is that stored in CareVue, an Oracel-based Philips system for recording clinical measurements (such as medications) [8], is archived within the hospital's Information Support Mart (ISM) [8]. This data is imported using SQL queries over a Virtual Private Network (VPN) connection between the Laboratory for Computational Physiology (LCP) at MIT and BIDMC. The trasferred data is stored at the LCP in a Pstgres databse. The other class of data are the waveforms recorded from the bedside monitors (such as ECG). These waveform files, which are not stored in the ISM, but are streamed to Philips server running windows, are periodically copied by hand onto firewire drives over a local network connection, and physically transported to the LCP. The files are subsequently copied off the files via a windows machine onto an NFS mounted server running Linux. The firewire disks are then archived off-site as a static backup.
2.2 Data Types
There is a wide variety of types, sources, and formats of data in MIMIC II. Below is a listing of the types of data that are relevant to the Annotation Station with an explanation of the source and format of each. The tables described in this section are required for use of the Annotation Station. To simplify reading this section all tablenames and fields will be displayed in bold.
2.2.1 Text Data
2.2.1.1 Clinical progress notes
noteevents
pid
charttime
notetext
Clinical progress notes are hand typed by a clinician and recorded into CareVue in the
noteevents table. The noteevents schema is shown in Figure 2. Each note is associated
with a unique pid, a timestamp indicating the time (charttime) at which the note is
recorded and an amount of free text(notetext). The clinician typically gives a summary
of important events in the patient's stay for the previous 8 hours, the length of a nurse's shift. Although there is some limited regularity to the frequency of the clinical progressnotes, they are still far from regularly sampled. Nurses can change shifts more or less
frequently, remarkably important and notable events can occur, or nurses can simply fail
to record a note at the appropriate time. All these factors can cause either an extra note tobe written, a note to be missed, or a note to be recorded at an unexpected time resulting in
irregularly sampled notes. The important elements of the noteevents table used by the Annotation Station are the patient id (pid) which identifies the patient to which a note refers, a charttime which indicates when a note was written, and notetext which is up to4000 characters of free text documenting significant events of the shift.
2.2.1.2 Discharge Summaries and Other Text Based Laboratory
Reports
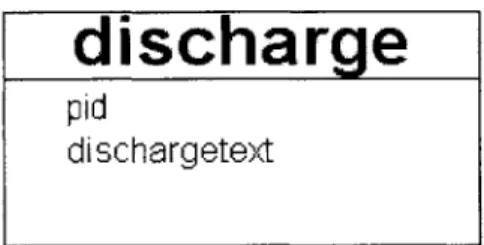
discharge
pid
dischargetext
Figure 3. The discharge table schema
In addition to clinical progress notes, there are several other types of text data. Each patient has a discharge summary written by the attending physician. There are also results to diagnostic tests such as X-rays, CT scans, and some text format lab tests. At the hospital, these are stored in a database other than CareVue. Automatic download of these
records is pending for administrative reasons, but a subset of these text records is
available to us through manual querying. The discharge summaries are stored in a
database table called discharge with the relevant portions of the schema shown in Figure
3. The important features of the discharge table are the patient identifier (pid) and the text
of the doctor's discharge note (dischargetext). There is no need for a timestamp on a
discharge summary because only one is created per patient stay. The dischargetext field
can contain up to 100000 characters of free text. The schema to be used for the text based
diagnostic test results such as X-rays and CT scans will resemble the noteevents table
described in Figure 2 with the addition of an itemid indicating the type of result (X-Ray,
CT). Therefore, the schema will be as is shown in Figure 4.
text-results
pid
charttime
itemid
text
Figure 4. The text-results table schema.
2.2.1.3 Alarms
alarms
pid
charttime
alarmid
severity
alarmtext
Figure 5. The alarms table schema.
The Philips monitors also record alarms fired during the patient stay. Each alarm fired creates a new row in the alarm table described in Figure 5. Each alarm row consists of a pid to identify the patient, a timestamp called charttime to localize when the alarm was fired, severity to indicate how important the alarm is, an alarmid to indicate the type of alarm, and alarmtext for additional human readable information. The severity is coded as an integer ranging from 0 to 3 with 3 indicating the most severe and 0 indicating the least severe alarm. The color codes red, yellow, green and blue are associated with the alarm severity classes 3, 2, 1 and 0 respectively. The alarmid is an identifier that references a Philips structure representing all possible alarms. This is not stored in the database, but is available. The alarmtext gives information about which data value crossed which threshold to produce this alarm. For example, if the alarm fired on an episode of tachycardia, the alarmtext might read "HR 115>100" to indicate that the measured heart rate was 115 which is above the threshold of 100 set to be indicative of tachycardia. The alarm rows are unevenly sampled as they are tied to clinical events in the patient stay.
2.2.2 Unevenly Sampled Numeric Data
chartevents
itemid
pid
charttime
value 1
value1num
value1uom
value2
value2num
value2uom
Figure 6. The chartevents table schema.
d_chartitems
itemid
label
Figure 7. The dchartitems table schema.
CareVue contains many types of information from the ICU stay of a patient. Chartevents is a monolithic table that includes verified measurements of many trended values including heart rate, arterial blood pressures, oxygen saturation, ventilator settings, lab results for blood chemistries, cardiac output, and many other measurements. Several thousand of these types are stored in a database table called chartevents. Each row in the table represents one data point of one type. Within chartevents, an itemid identifies the type of data in a row. The human readable label of the types demarcated by the itemids is given in the dchartitems table where each row ties an itemid with a textual label naming that signal. For example, the itemid 51 is tied to the label "Arterial BP". Other important fields in chartevents are an identifier for the patient (pid), the time of the recorded value (charttime), the value(s) themselves (valuel, value2), and the unit(s) of measurement (valueluom, value2uom). Chartevents can include up to two textual or numeric data values for each sample point (in the valuel and value2 fields). An example where both values are used is when blood pressure is reported. Valuel is used for the systolic value and value2 is used for the diastolic value. Sampling all values of one type for one patient results in construction of a "signal". For example, we can select all of the systolic blood pressures for a particular patient from the chartevents table and construct a systolic blood pressure time series, which is a signal. Depending on the type of data, the frequency of recording varies quite significantly. Some measurements such as heart rate
are recorded up to every
5
minutes over some periods, and some blood chemistry results
are recorded only once or a couple of times for each patient stay. In addition to the
difference between signals, within each type of signal, the rate at which values are
recorded changes. For example, it is typical for heart rate and blood pressures to be
recorded every hour and inserted into CareVue. But, at times where there are significant
events occurring in the patient stay, these values might be recorded much more often, up
to every
5
minutes. Therefore, these signals are quite irregularly sampled. For all values
in chartevents, nurses should verify the values before they are recorded into CareVue by
calibrating measurements such as heart rate or blood pressure, ensuring that the ventilator
values match the set ventilator settings, or checking that blood chemistries that come
back from the lab match the values inserted into CareVue.
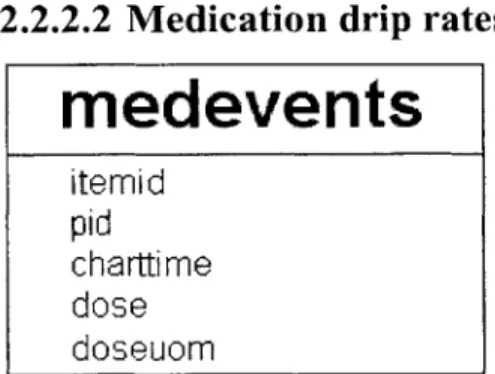
2.2.2.2 Medication drip rates
medevents
itemid
pid
charttime
dose
doseuom
Figure 8. The medevents table schema.
d meditems
itemid
label
Figure 9. The dmeditems table schema.
In addition to the chartevents, there are other types of irregularly sampled data in
MIMIC II. One is the medications data, which is recorded in the medevents table in
CareVue. This records IV medication rate changes. The structure is similar to
chartevents except that the value stored is called a dose. The dmeditems table indicates
which itemids correspond to which medications and give a textual label for each. The
medevents table has one row for each drip rate change. The rate that is recorded in
medevents is valid until the next time the medication has a rate recorded. These changes
occur at irregular times resulting in unevenly sampled signals.
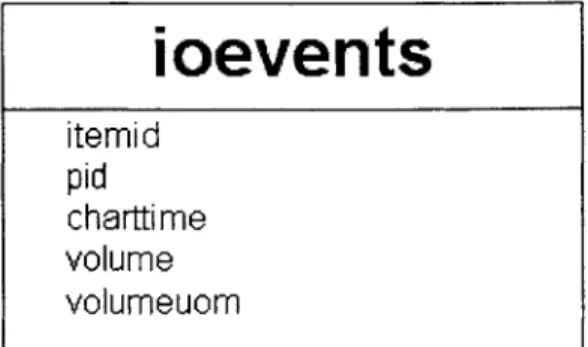
2.2.2.3
I/O Fluids
ioevents
itemid
pid
charttime
volume
volumeuom
Figure 10. The ioevents table schema.
totalbalevents
itemid
pid
charttime
perVolume
cumVolume
Figure 11. The totalbalevents table schema.
d_ioitems
itemid
label
Figure 12. The dioitems table schema.
Similarly, the ioevents table in CareVue records various IV fluids and how much volume
of each is infused into the patient. This table also resembles chartevents with the
exception of its use of fields called volume and volumeuom, which represent how much
volume of a particular fluid was given via IV since the previous row with the same
itemid. Many of these values are recorded hourly, by standard, but there are skipped
hours, where the total intake or discharge is reported at the end of some number of hours.
Also, these data do not arrive on a clock. So, while mostly they are spaced at an hour or
some multiple of an hour, this is not necessarily the case. The time spacing can differ
from an hour by several minutes. Therefore, these signals must also be represented with a data format accomodating unevenly sampled signals.The totalbalevents table stores information on the total amount of IV fluid taken in by a
patient and the total amount of urine discharged. It is very similar to the ioevents table
except that it has a perVolume field indicating the volume that has gone in or out since
the last measurement and a cumVolume indicating the running total in or out for the
entire day.
For both the ioevents table and the totalbalevents table, the itemid demarcates the data
type of each row in the respective table. The dioitems table indicates the text label for
each of these itemids.
2.2.2.4 Census data
censusevents
pid
intime
outti me
Figure 13. The censusevents table schema.
The censusevents table is used by the Annotation Station to determine the length of the
stay of a patient. As indicated by the names, the intime corresponds to patient admit time
and outtime corresponds to patient discharge time from the ICU. In the database, there
can be more than one row for each patient in censusevents. For example, if the patient
were transferred between departments during the stay at the hospital, there will be several
intimes and outtimes for the same patient. Therefore, for the purposes of annotating an
entire ICU stay, the earliest of all the intimes is taken as the marker of the beginning of
the patient stay and the latest of the outtimes is taken as the end.
2.2.3 Evenly Sampled Numeric Data
2.2.3.1 Parameter Data
MIMIC II also includes higher resolution unverified data that is not recorded in CareVue,
but is collected alongside it. There are two formats for this higher resolution data.
The first type of data is called "parameter" data, which are unverified parameters sampled
at a period of 1 minute such as heart rate, blood pressures, oxygen saturations, and
cardiac output. Each patient has one parameter file which includes 30 such parameters. The parameter files include a variable number of data chunks. Each chunk includes a timestamp, and 30 values, one for each of the 30 parameters at that time point. These values can be either an available value or a value representing missing data. This missing data value, "-888" by convention, is reserved to indicate that the value of that parameter is missing for that time point. Parameter data is mostly evenly sampled at one data chunk per minute, but there can be segments where one chunk follows the previous chunk by more or less than one minute.
2.2.3.2 Waveforms
The second type of data is waveform data, which is recorded at 125Hz. The total possible waveform data that can be recorded is: 3 leads of ECG, respiration, pulmonary artery pressure, central venous pressure, arterial blood pressure, pulse oximetry, and intra-cranial pressure. There is a maximum of 4 of these data streams recorded at once. This data is recorded in binary data files and text header files. Each line of the header file specifies a one minute chunk (7500 samples) written in the data file. These one-minute segments need not be consecutive, although they are continuous within themselves.
The waveform data is currently restricted to hold data values in one byte. This restriction means that a waveform can only take on 256 distinct values. The effect on the signal is a
highly quantized look and easy signal saturation. Threfore, because of the data format,
the waveforms become artifactual and saturated.
2.3 Data Format
All of the data in its original format suffers from lack of time synchronization and various
errors including byte-skipping misalignments. Primarily for adherence to our open source data standard, this data was all converted to WFDB. During the conversion, many of these errors were easily fixed. Therefore, the resulting parameters and waveforms in MIMIC II are better organized and easier to read than the original files that represent the same data in the hospital information system.
2.3.1 Breakup of Data
Querying the Postgres portion of the MIMIC II structure in the ISM format is cumbersome. There are a tremendous number of signals stored in each database table. Consequently, retrieval of one signal for one patient is extremely time consuming. To further complicate this problem, tables such as chartevents and totalbalevents include
many signals that are not relevant or useful to the Annotation Station. Figure 14 shows
the size of chartevents and totalbalevens when the database contained 1800 patients.
Chartevents alone contains 32 million rows, while the two tables combined contain 38
million rows. In the face of these huge monolithic tables, the queries for individual
signals take on the order of minutes to execute. The Annotation Station would not be able
to operate with this level of performance. More efficient access had to be made available.
The solution to this problem was to copy relevant rows from the monolithic tables to
smaller tables that could be more easily queried. Under Postgres, such a system is clearly
a major improvement. The average time to extract a signal dropped to several hundred
milliseconds.
ISM LayoutChartEvents
32M
38M
TotalBalEvents
6.3M
Annotation Station Layout
Signals(Arterial BP) Ventilator Cardiac Blood Gases
641 K IAM 256K 363 K
9M
Hematology Urine Biochemistry Totd 10
920K 65K 193K 2M
Figure 14. The breakup of chartevents and totalbalevents into more reasonably sized manageable tables. Chartevents contains 32M rows while Totalbalevents contains 6.3M rows in the ISM structure. In the Annotation Station Layout, the largest table to query has 2M rows and the total number of rows in all the relevant tables is 9M.
Some measurements are high rate and individually have a great number of rows in the
database. For these signals, there is one separate table for each in the breakup. These are
signals such as respiration, CVP, heart rate and blood pressures. These constitute one
type of table in the breakup and are identified by the following:
0 High-Rate Measurements (SIGNALS)
For signals that are less dense, some number of signals are grouped together and stored in one table. Below are 8 additional tables each corresponding to a category of measurements. " Cardiac (CARDIAC) " Hematology (HEMATOLOGY) * Renal (RENAL) " Biochemistry (BIOCHEM) * Ventilator (VENTILATOR) * Blood Gases (BLOODGASES)
" Urine (URINE) " Total I/O (TOTALIO)
The first seven of these select various signals of the specified types from the chartevents table. (ventilator settings, various cardiac measurements, blood gases, blood counts[RBC, WBC], urine tests, blood chemistries that indicate renal function, and other blood items categorized as biochemistry) respectively. The Total I/O table contains information from the totalbalevents table having to do with volume measurements of fluid in or out of the patient's body.
A program (ReadCEFile.java) was created to break down the database from the ISM
schema into the more compact Annotation Station Layout. The specific types of data included in each sub-table are dictated to this program through a second "breakup" file called itemids. The file has a regular grammar as described in the following:
BREAKUP-FILE = {SECTION}*
SECTION = "SECTION:"$section-name<CR>{LINE<CR>}+"END"<CR>
LINE ={$itemid" "}+{$signal-name}!{I$field-name}?
An example of a valid breakup file is given in Appendix B. The breakup file is composed of zero to 9 possible sections as listed above. For each section, there are one or more lines terminated by a carriage return. Each of these lines defines one signal, which can be
extracted, queried, plotted, and annotated on the Annotation Station. Unfortunately, in the
ISM structure, one type of data does not necessarily have one unique itemid. For
example, there are 8 different itemids that map to Sodium. This undesirable property is caused by a nurse changing the name of the signal in CareVue. The system consequently creates a new itemid for that new name. But for our purposes, this is in fact the same signal as the unchanged version, regardless of slight variations in the text label nurses apply. Therefore, when defining a signal in a line of the breakup file, the option must be given to map multiple itemids to one signal. One or more itemids are specified by placing a whitespace-separated list of them at the beginning of the line. This section is terminated
by a pipe character, "I". The text after this pipe is the name of the signal. Since, in the
SIGNALS section, each of these signals will have a table created in the database, the
name of the signal must be a valid database name (i.e. no spaces or unusual characters). Since a signal will be identified by its name in the breakup file, this name has to be unique within the breakup file. In other words, there may not be more than one signal in the same breakup file with the same name. After the signal name, the constructed line can optionally contain a second pipe and an identifier for the field in the database where the values of the signal reside. The default, if this final option is not specified, is the valuel
field. So, for example, to specify the diastolic blood pressure signal, we must specifically put an extra pipe and the name "value2" at the end of the line. For the TOTALIO signals, the cumvolume or pervolume also must be specified, since the default valuel field does not exist in totalbalevents.
All of these created tables will be repeatedly queried based on pid and itemid. The
common query will be to select all of the points that correspond to one patient and one signal (one or more itemids). Therefore, the program that breaks up the data creates indices in the database based on these two fields individually and jointly. This ensures that all queries that select rows based on the two fields are as fast as possible.
The program that is used to do the breakup of the monolithic ISM tables is called ReadCEfile.java To use it, one must have the java class ReadCEFile.class and a valid breakup file of the documented form.
java ReadCEFile $breakup-file $pg-server
The above command can be issued from the main AnnotationStation directory, the $breakup-file argument points the program to the breakup file on disk and the $pg-server argument points the program to the address of the postgres database server.
The breakup procedure is quite time consuming, taking on average 10 hours to complete. It only needs to be performed once at the time of database setup as long as the underlying data in chartevents and totalbalevents does not change. If data is added in these tables, the procedure must be repeated to make the new data available to the Annotation Station.
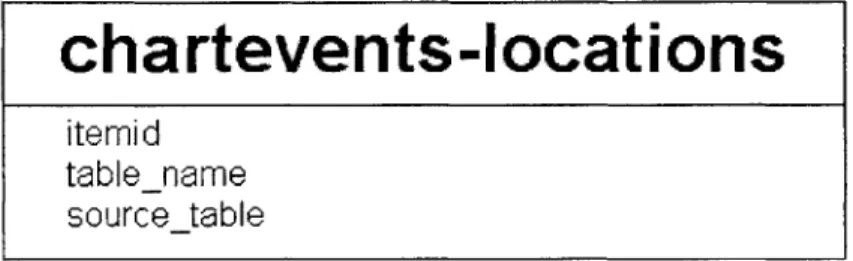
2.3.2 Chartevents Locations
As a side effect of the breakup of the chartevents and totalbalevents tables into smaller
tables, a metadata table is created to keep track of which signals have been copied to
which tables. The schema of the table is as follows:
chartevents-locations
itemid
tablename
sourcetable
Figure 15. The chartevents-locations schema.
The chartevents-locations table ties each itemid with two things. Firstly, the table it was
copied to (table-name). Secondly, the source table it was copied from (source-table).
3 Data Loading
3.1 ReadCEFile
The ReadCEFile interface, which is used to breakup MIMIC II, as discussed in Section
2.3.1, can also be used to read the broken down signals from the database. There are
several things that need to be done in order for this to happen. The same breakup file that was used to break down the database must be specified to the Annotation Station for correct data loading. Once the file is made available, the ReadCEFile class can be instantiated to form an object containing all of the needed data. The constructor for this
class has the following form:
public ReadCEFile(String file)
The file argument points the ReadCEFile class to the breakup file on disk. Once the ReadCEFile object is created, it can be used to populate a HashMap. The keys of this map are the signal names, exactly as indicated in the breakup file, and the values of the map are SignalData objects, which will be described at length in Section 7.9. Since SignalData is an abstract class and hence cannot be instantiated, the runtime type of these SignalData objects is TrendData, a subtype of SignalData. There are also other subtypes of SignalData as described in Section 7.9. The Java method used to populate this HashMap has the following signature:
public void populateSignalsMap(HashMap map, int pid)
This method takes an instantiated map to populate and the pid to identify the patient for which the user wants the signals extracted. There is no direct way, using the ReadCEFile interface to extract only one signal from the database. This is due to the fact that the Annotation Station loads all of the needed signals from the database upon loading a patient record. Therefore, the Annotation Station never needs to load signals on an individual basis.
3.2 Loading Procedure
There are several points in the operation of the Annotation Station where data loading occurs. The action that the Annotation Station takes in three of these circumstances will be described.
3.2.1 Patient Load
The patient load procedure is in the main Annotation Station class which drives the system, called AW.java, and has the signature:
public void loadPatient(String pid)
The first type of data that is loaded in the patient load procedure is the parameter data. The ReadParam class is used to do this. ReadParam reads the parameters file, of the format specified in Section 2.2.3.1, into a subclass of the SignalData class called ParamData. Since the parameter data is not very dense (1 sample per minute), loading all the parameter data for one patient is not extremely costly in terms of space considerations. On an average patient stay of 2 days, there are around 3000 minutes of data. So, to store a 4 byte floating-point value for each of these time points only corresponds to about 12 kilobytes of data for each channel of the parameter data. This is easy to fit in memory, fast to search through, and most importantly fast to display. It is for this reason we decided to load all of the patient's parameter data at the time of loading the patient's record.
The second operation that the loading procedure performs is that it copies the notes and alarms for the given patient from the voluminous tables where they reside to a temporary notes table and a temporary alarms table. This is so that queries on notes and alarms can be done more quickly while the annotation station is running.
The third operation is to prepare the medications and IV fluids to be extracted as signals with the rest of the numeric data from the database specified in the breakup file. The medevents table and the ioevents table are sparsely populated enough that it is reasonably efficient to extract the relevant rows at the time of patient loading. The Annotation Station queries the database for a list of the available signals from the medevents and ioevents tables. The itemids as well as the labels of the available signals are then added to the ReadCEFile object representing which itemids will be extracted out of the database as signals to be plotted on the Annotation Station. Once these are added, the list of signals in the ReadCEFile object is complete and the populateSignalsMap method can be run on the ReadCEFile object. The object then has a complete HashMap of all the numeric signals the Annotation Station will need from CareVue.
3.2.2 Update Time
As an annotator is reviewing a case, there is a time point that indicates where the annotator's attention is focused. There are several pieces of data that need to be updated when this operation occurs. The note being viewed gets updated to the nearest note to the
updated time. All the available numeric signals are updated to have the nearest previous value displayed. The signals that are plotted get zoomed around the new time. Also, the timelines all get zoomed to the same region that the signal plots get zoomed to. All of these data display objects will be described in detail in Section 6.
3.2.3 Waveform Load
Although waveform data and parameter data are both evenly sampled data, waveform loading differs from parameter loading. At 125Hz, the average amount of data over a patient stay for a single channel of waveform data would be around 80 Mb. While such an amount of data could be stored in memory, it would be unwieldy to try to fit all of it into the data structure that the Annotation Station's plotting module uses WaveData (described in Section 7.9.3). The strain on the processor would cause the screen refresh on the Annotation Station to grind to a halt. Therefore, there are two approaches that can be taken. The Annotation Station can leave waveforms on disk and retrieve pieces of them as needed to populate a WaveData object with the needed subsection. A second plausible approach would be to load all of the waveform data into memory at the time of loading the patient's record, but not to attempt to plot this entire data signal. When the data needs to be displayed, it can be copied into the WaveData structure used for plotting. The advantage to this approach would be that the data would be loaded from memory rather than from disk. While this would be a significant advantage for speed of waveform viewing in the Annotation Station, such an approach is unnecessary because waveform viewing is not the primary modality of the Annotation Station. Annotators will not perform detailed waveform review with the Annotation Station. The annotators will use the waveforms in quite a limited setting; the waveforms will be used to validate a condition noticed in the trend values, lab values, fluids, etc. Therefore, for simplicity, the first approach was selected. The annotator may zoom in on any point in time, and if he would like to view waveforms, he can load a window of 20 minutes of waveforms around the time of interest. This is around 100,000 points, which is a reasonable amount of data to plot without putting excessive stress on the Annotation Station screen refresh.
A summary of the types of data loaded into the Annotation Station, and where they reside
czzZZfl
Nurse's Notes Labs Fluids Ventilator Settings Verified Physiologic Parameters Postgres Database 1MIMIC11
LAP Annotation Station....
A...
A q__________________.El..
...
.... .. ... ... ....
V ...
Figure 16. The locations on the Annotation Station where various pieces of the MIMIC II database are loaded. The CareVue data resides in a Postgres database, while the waveforms and parameter data reside in flat files.
3.3 Future Data Format
WFDB is an open data format that includes a header file and a data file as well as an
optional annotations file. The header file describes offsets, gains, number of channels,
Page 28 of 82
P aram ete r D ata (11min averages) HR ABP PAP Sp02 C02 1CO Waveforms 25 Hz Samples) ECG ABP Resp CVP PAP ..... ......