https://doi.org/10.4224/40001907
Vous avez des questions? Nous pouvons vous aider. Pour communiquer directement avec un auteur, consultez
la première page de la revue dans laquelle son article a été publié afin de trouver ses coordonnées. Si vous n’arrivez pas à les repérer, communiquez avec nous à [email protected].
Questions? Contact the NRC Publications Archive team at
[email protected]. If you wish to email the authors directly, please see the first page of the publication for their contact information.
https://publications-cnrc.canada.ca/fra/droits
L’accès à ce site Web et l’utilisation de son contenu sont assujettis aux conditions présentées dans le site LISEZ CES CONDITIONS ATTENTIVEMENT AVANT D’UTILISER CE SITE WEB.
READ THESE TERMS AND CONDITIONS CAREFULLY BEFORE USING THIS WEBSITE.
https://nrc-publications.canada.ca/eng/copyright
NRC Publications Archive Record / Notice des Archives des publications du CNRC :
https://nrc-publications.canada.ca/eng/view/object/?id=28f1d264-a3c2-449b-bbc1-39747f58e632 https://publications-cnrc.canada.ca/fra/voir/objet/?id=28f1d264-a3c2-449b-bbc1-39747f58e632 For the publisher’s version, please access the DOI link below./ Pour consulter la version de l’éditeur, utilisez le lien DOI ci-dessous.
Access and use of this website and the material on it are subject to the Terms and Conditions set forth at Drone impact assessment on aircraft structure: windshield and leading edge testing and analysis
Dadouche, Azzedine; Greer, Allan; Galeote, Brian; Breithaupt, Timothy; Vidal, Charles; Gould, Ron
AEROSPACE REASEARCH CENTRE
N A T I O N A L R E S E A R C H C O U N C I L C A N A D A
Drone Impact Assessment on Aircraft
Structure: Windshield and Leading
Edge Testing and Analysis
Volume 2 of 2
Report No: CR-GTL-2020-0054 Date: March 2020
Authors :
Aerospace - GTL Aerospace – AMTC External
Azzedine Dadouche Allan Greer
Brian Galeote Timothy Breithaupt
Contents
1 INTRODUCTION ... 1
2 WINDSHIELD IMPACT TESTING ... 2
2.1 Windshield Test Setup ... 2
2.2 Windshield Test Data Analysis ... 6
2.3 Windshield Results Summary ... 15
3 WING LEADING EDGE IMPACT TESTING ... 17
3.1 Wing Test Setup ... 17
3.2 Wing Test Data Analysis ... 18
3.2.1 Low Speed with Deployed Slats ... 18
3.2.2 High Speed with Retracted Slats ... 37
3.3 Wing Results Summary ... 49
TABLE OF FIGURES
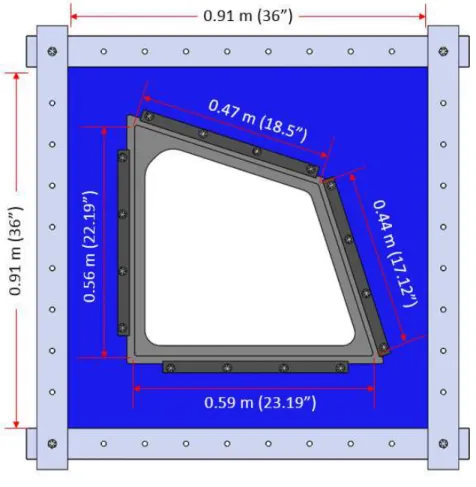
Figure 1: Windshield test frame ...2
Figure 2: Windshield frame assembly...3
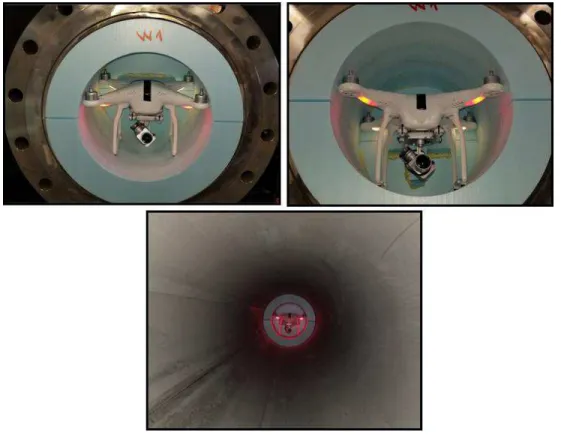
Figure 3: BAAT - Split sabot with drone installed in barrel ...4
Figure 4: Drone's camera attachment ...4
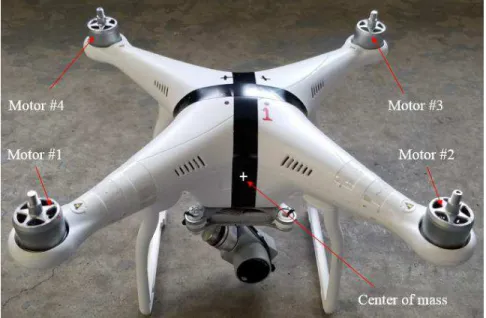
Figure 5: Drone center of mass and motor identification...5
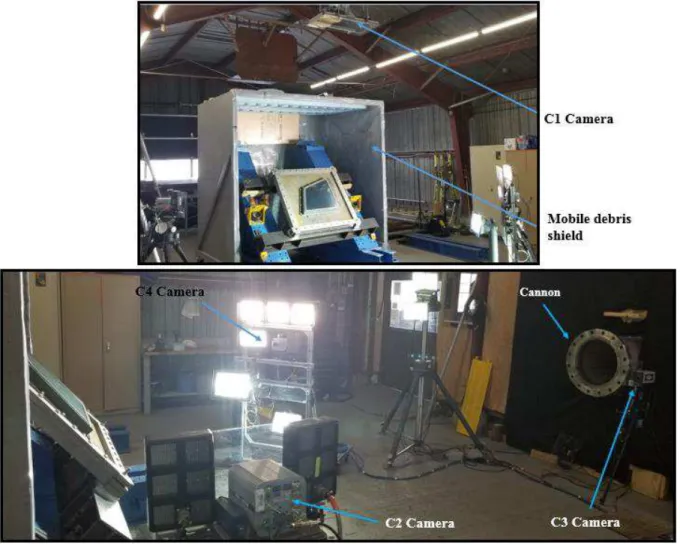
Figure 6: High speed cameras locations ...6
Figure 7: Cockpit windows: a) exterior view, b) interior view ...7
Figure 8: Sketch of a laminated windshield structure ...7
Figure 9: Test windshields (Outboard side) ...8
Figure 10: Overall test setup ...8
Figure 11: Drone in sabot with battery charge indicator (Test #1) ...9
Figure 12: Drone in sabot with battery charge indicator (Test #2) ...9
Figure 13: Drone/windshield impact at 140 knots (Test #1) ... 10
Figure 14: Drone/windshield impact at 250 knots (Test #2) ... 10
Figure 15: Cloud of glass fragments (Test #2) ... 11
Figure 16: Post-test pictures of the windshield (Test #1): a) Outboard surface, b) Inboard surface ... 12
Figure 17: Post-test pictures of the windshield (Test #2)... 12
Figure 18: Post-test pictures of drone (Test #1) ... 13
Figure 19: Post-test pictures of drone (Test #2) ... 13
Figure 20: Fracture pattern and material loss (circled) at 140 knots (Test #1) ... 14
Figure 21: Fracture pattern and material loss (circled) at 250 knots (Test #2) ... 14
Figure 22: Wing segments ... 17
Figure 23: Wings test stand ... 18
Figure 24: Impact locations with slat deployed ... 19
Figure 25: Wing middle segment (Upside-down) ... 19
Figure 26: Wing test setup for low speed condition ... 20
Figure 27: Wing setup for Tests #1 and #2 (140 knots) ... 20
Figure 28: Drone/sabot assembly (Wing, Test #1) ... 20
Figure 29: Drone/slat impact at 140 knots (Test #1) ... 22
Figure 30: Post-test pictures of the slat (Wing, Test #1) ... 23
Figure 31: Post-test pictures of the drone (Wing, Test #1) ... 23
Figure 32: Drone/slat impact at 140 knots (Test #2) ... 25
Figure 33: Post-test pictures of the slat (Wing, Test #2) ... 26
Figure 35: Slat retraction after Test #2 ... 27
Figure 36: Post-test pictures of the drone (Wing, Test #2) ... 27
Figure 37: Setup and target loaction for Tests #3 and #4... 28
Figure 38: Drone/sabot assembly for Test #3 ... 28
Figure 39: Impact point and leading edge curvature ... 29
Figure 40: Drone/slat impact at 140 knots (Test #3) ... 31
Figure 41: Post-test pictures of the slat (Wing, Test #3) ... 32
Figure 42: Post-test pictures of the drone (Wing, Test #3) ... 32
Figure 43: Test drone for Test #4 ... 33
Figure 44: Drone/slat impact at 140 knots (Test #4) ... 34
Figure 45: Battery ejection (Test #4, C4) ... 35
Figure 46: Drone status after impact (Test #4) ... 35
Figure 47: Post-test pictures of the slat damage (Wing, Test #4) ... 36
Figure 48: Wing tip segment and impact locations (Upside down) ... 37
Figure 49: Wing test setup for high speed condition ... 38
Figure 50: Close up views of the wing tip segment and anchoring system ... 38
Figure 51: Target locations for Tests #5 and #6 ... 39
Figure 52: Close up pictures of the slat from tip side (Retracted position) ... 39
Figure 53: Drone/sabot assembly for Test #5 (Discharged battery) ... 40
Figure 54: Drone/sabot assembly for Test #6 (Charged battery) ... 40
Figure 55: Drone/slat impact at 250 knots (Test #5) ... 41
Figure 56: Post-test pictures of slat (Test #5) ... 42
Figure 57: Post-test drone parts (Test #5) ... 43
Figure 58: Wing preparation for Test #6 ... 44
Figure 59: Drone/slat impact (Test #6) ... 45
Figure 60: Post-test pictures of the slat (Test #6) ... 47
Figure 61: Slat/track damage (Test #6) ... 47
Figure 62: Drone debris after impact (Test #6) ... 48
Table 1. Windshield Test conditions ...7
Table 2. Speed and drone impact angles ... 11
Table 3. Damage level categories (FAA-ASSURE) ... 16
Table 4. Low speed test conditions (Wing: middle) ... 19
Table 5. Speed and drone impact angles (Leading edge of slat, L1) ... 27
Table 6. Speed and drone impact angles (Slat upper side, L2) ... 36
Table 7. High speed test conditions (Wing: tip) ... 37
Table 8. Summary of impact test requirements (Wing) ... 49
Table 9. Summary of speed and drone orientation angles (Wing) ... 49
Table 10. Damage severity level (Wing impact) ... 50
1
INTRODUCTION
Over the last decade, aerial drones have been increasingly used by both professional and inexperienced users resulting in an increased risk of impact incidents throughout the world. Transport Canada has already implemented regulations dealing with the operation of drones, especially in sensitive areas such as airports where a safe distance must be observed. However, the risk of impacting an aircraft at low altitude remains from both malicious and careless operators. NRC- Aerospace Research Centre has been performing bird impact testing both on aircraft structures, windshields as well as on engines since the 1960s where a number of pneumatic guns with various sizes have been developed and run for various clients. Over that period, NRC’s bird guns were used to fire bird carcasses in accordance with ASTM standard (F330 – 16) to certify aircraft materials, gelatin synthetic birds for research purposes as well as steel balls. The latter test aimed at certifying a bullet-proof windshield of a fighter aircraft with a firing ball velocity reaching 1237 km/h (1.036 Mach, 668 knots).
The main objective of this collaborative work between Transport Canada, Defence Research and Development Canada and the National Research Council Canada is to perform a series of experiments simulating impacts between a representative quadcopter drone and various aircraft components (windshield and wing sections) at typical operating conditions of both the aircraft and drone (impact velocity, mass and type of projectile). The wings and windshields from a typical AWM 525 (Part 25) commercial aircraft were used for these impact tests. Tests were performed at operating conditions typical for approach and cruising speeds of an aircraft under 10,000 feet (3,048 m).
This report gives an overall description of the test setup for windshield and wing leading edge impact testing and provides experimental data along with analysis and discussion.
2
WINDSHIELD IMPACT TESTING
2.1
Windshield Test Setup
An overall view of the windshield test setup is depicted in Figure 1. The set of frames used in the plate testing to hold the test plates was also used here to support the test windshields. Basically, the windshield is first mounted (mechanically fastened) on a steel plate and then sandwiched between the two square frames that were used for plate impact testing. Figure 2 depicts an overall view of the windshield mounted on its framed supporting plate.
Figure 2: Windshield frame assembly
This setup may not fully represent the way a windshield is mounted on the aircraft as this frame and supporting structure may be more rigid. Hence in a real collision, the aircraft structure would potentially absorb more of the energy of the impact, reducing the effect on the windshield. On the other hand, it should be noted that most of the development testing of laminated glass windshield designs for bird impact performed at NRC were and are still performed using this or very similar flat panel setups. Certification bird impact tests would follow with fully configured windshields mounted on representative frames or actual cockpit structure.
NRC’s foam-based, split, “BAAT1” sabot was used to perform the impact tests (Figure 3). This
sabot design does not require an arresting mechanism at the muzzle of the cannon. It opens up as soon as it exits the barrel allowing the drone to continue its trajectory onto the target. All drone cameras were zip-tied to their mounting pad on the drone to reduce the risk of separation during acceleration. Figure 4 shows close up views of the weakest point susceptible to failure during acceleration and a zip-tied camera. A reference to the drone’s center of mass is given in Figure 5.
Figure 3: BAAT - Split sabot with drone installed in barrel
Figure 5: Drone center of mass and motor identification
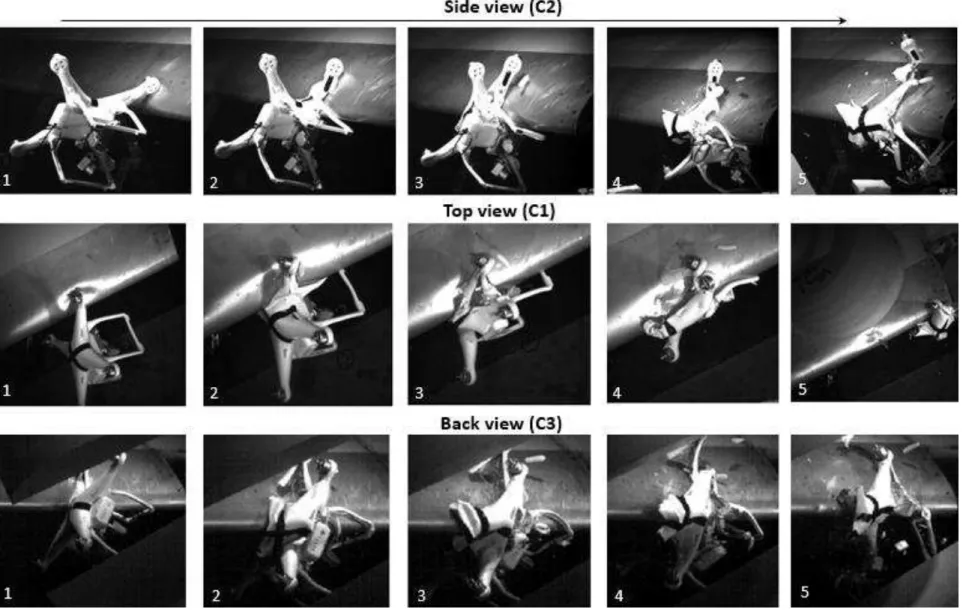
Two high speed cameras were used to measure the drone’s speed. A third camera, along with the speed measurement cameras, captured the drone’s orientation angles (pitch, yaw and roll) at the point of impact. A fourth camera was used to record an isometric view of the impact. Figure 6 depicts the location of the various cameras. C1, the top plane, and C2, the side plane, were used to measure the drone’s speed as well as the yaw and pitch angles, respectively. C3 allowed the measurement of roll angles and C4 gave an overall view of the impact.
Details on speed measurement method can be found in the plate testing report (CR-GTL-2020-0053).
Figure 6: High speed cameras locations
2.2
Windshield Test Data Analysis
Two impact tests were carried out on two separate windshields (side windows: #2) as presented in
Table 1. The first test was conducted on the PORT windshield (left hand side) at a speed of 140 knots (72 m/s). The second test was performed on the starboard (STBD) windshield (right hand side) at a speed of 250 knots (128.6 m/s). Figure 7 identifies the various cockpit windows of the aircraft used in this study. It is important to mention that #2 windshields were used because of their availability. However, while using windshield #2, the intent was to simulate an impact on the front windshield. Cockpit #1 and #2 windshields are very similar in construction and their design would have been tested to the same bird impact certification requirements. A sketch showing the structure of such a window is presented in Figure 8. It is mainly composed of three layers: a non-structural protective outer glass pane, a structural vinyl interlayer and a structural inner glass pane. Urethane adhesive interlayers are used between the main plies for bonding purposes. The structural inner glass represents the main load bearing pane whereas the vinyl interlayer is structural for bird impact resistance and fail-safe pressure loads (in case of failure of the structural inner glass pane).
Pictures of the two windshields mounted on the test frame are presented in Figure 9 and the overall setup of both tests is shown in Figure 10. Quadcopter drones were used as the projectiles. Battery charge level was approximately at 25% or lower for both tests (Figure 11 and Figure 12).
Table 1. Windshield Test conditions
Test # Speed [knot, m/s] Windshield Battery status
1 140 (±5), 72 (±2.5) PORT charge 25%
2 250 (±5), 129 (±2.5) STBD charge 25%
Figure 7: Cockpit windows: a) exterior view, b) interior view
Figure 9: Test windshields (Outboard side)
Figure 11: Drone in sabot with battery charge indicator (Test #1)
Figure 12: Drone in sabot with battery charge indicator (Test #2)
Figure 13 and Figure 14 illustrate the crash sequences at the impact speeds of 140 knots (72 m/s) and 250 knots (128.6 m/s) respectively. For Test#1, at 140 knots (72 m/s), the legs of the drone impact the windshield frame first followed by motor #1, camera, motor #2 and then the whole body of the drone. For Test #2, at 250 knots (128.6 m/s), the legs, again impacted first, followed by motor #2, motor #1 and then the main body of the drone. It is important to note that the camera housing became detached from its mounting points at some point during the launch. However, the camera did follow the trajectory of the drone and impacted the windshield correctly, on target, contributing its portion to the overall impact force. This can be seen in the last sequence of images (image #5) where the drone’s camera was tracked by the high speed camera (C1).
Figure 13: Drone/windshield impact at 140 knots (Test #1)
Even though there was no penetration, the windshields underwent severe damage in both tests. The external and internal layers of the windshields both failed for each test run. The damage was especially severe for the high speed test. The impacts generated clouds of glass fragments that were observed above the windshields immediately after impact. Figure 15 shows the cloud of glass generated at a drone impact speed of 250 knots (Test #2).
The impact speed and in-flight orientation of the drone for both tests are reported in Table 2. It is important to mention that the roll angle for the low speed test was difficult to determine due to visibility issues caused by the sabot. Overall, the drone orientation angles for both tests were low and the drone speeds were within the accepted range.
Table 2. Speed and drone impact angles
Test
# Velocity [knot, m/s]
Orientation angle [°]
Pitch Yaw Roll
1 141.5, 72.79 1 12 2 - 5
2 252.4, 129.85 4.5 5.5 6.5
Figure 15: Cloud of glass fragments (Test #2)
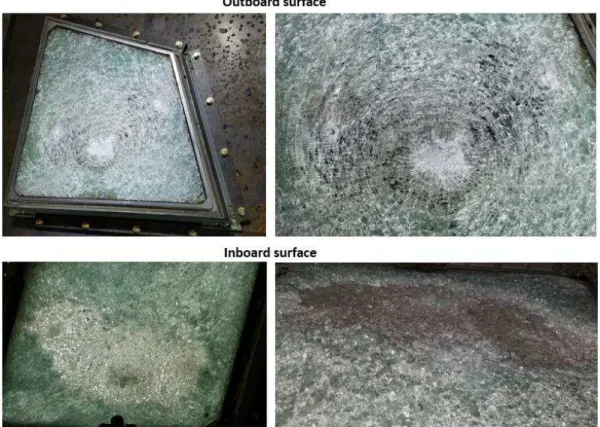
Windshield post-test pictures are presented in Figure 16 and Figure 17. One can notice the severity of the damage to both windshields and only surmise the possible consequences of such impacts would have, especially at high speed where both the internal and external glass layers of the windshield broke in the vicinity of the impact location and disintegrated into fragments. In both tests, all four of the glass plies have been fractured and only the plastic (vinyl) interlayers were holding the shattered fragments together after the impacts.
a result of the cracks throughout the inner and outer glass panes. The mass ratio between the drone (~ 2.6 lb) and bird (4 lb) is 65%. However, the severity of the damage resulting from the drone impact is more significant. The cloud of glass fragments generated by the drone impact represents a significant event in windshield strike testing.
The AWM 525 windshields are required to survive 4 lb at 350 kn bird impacts with no damage at all under three outer surface temperature conditions (-40, 70 and 140°F) and at four or more target locations (mid-window, top FWD corner, top AFT corner and mid-length of center post).
Figure 16: Post-test pictures of the windshield (Test #1): a) Outboard surface, b) Inboard surface
To no surprise, both drones were severely damaged as depicted in Figure 18 and Figure 19. There was no smoke or ignition of the battery packs. Actually, the battery pack for the low speed test remained attached to the body of the drone along with the arms and motors. On the other hand, the drone for Test #2 was disintegrated into pieces and the battery cells showed signs of partial oxidation.
Figure 18: Post-test pictures of drone (Test #1)
Figure 19: Post-test pictures of drone (Test #2)
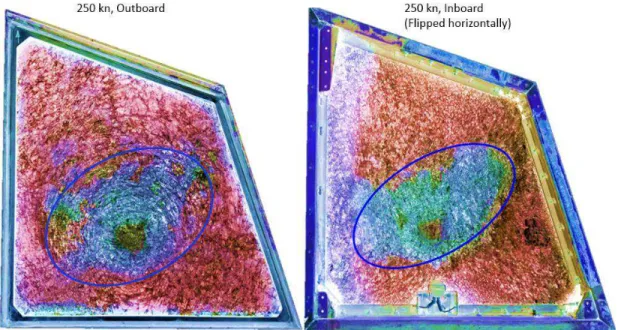
Glass ply fracture for both tests is depicted in Figure 20 (140 kn) and Figure 21 (250 kn). In both figures, the inboard pictures were flipped horizontally for presentation purposes and the colour thresholds were adjusted to enhance contrast. These modifications highlight that the individual
Inspection of the windshield impacted at 140 knots suggested that about 15% of the outer non-structural glass ply was spalled off. However, spalling did not reach the outboard surface of the structural vinyl interlayer (circled in Figure 20).
On the other hand, visual inspection of the windshield impacted at 250 knots along with surface measurement (based on surface colour) using a CAD software showed that about 25% of the inner structural ply glass was spalled off down to the inboard surface of the structural vinyl interlayer (circled in Figure 21).
Figure 20: Fracture pattern and material loss (circled) at 140 knots (Test #1)
2.3
Windshield Results Summary
A total of two tests were conducted on two distinct windshields at a speed of 140 and 250 knots. The drone impacts resulted in both the outer non-structural and inner structural glass plies being shattered. In both tests the windshield no longer supports pressure loads due to the fracture of the inner ‘structural’ glass ply. Only the structural vinyl interlayer remains to support fail-safe loads and prevent depressurization. However, this layer may be compromised by the loss of windshield heating and the development of cracks through its surface under sustained aerodynamic loading at low temperature. This windshield design would be expected to withstand a 4 lb bird impact at 350 knots with no damage.
In addition, the amount of glass spalled from the inner ply of the impacted laminated windshields was significant and the cloud of fragments released into the cabin and moving with velocity would have posed a penetration and inhalation hazard to the operator located directly behind. It is also expected that the optics through the impacted windshield would be lost and an emergency landing will be then required. Such windshields are supposed to pass a 4-pound bird impacts at a speed of 350 kn at various temperatures. Based on NRC’s bird impact experience, the damage that resulted from the drone impact at 250 kn is unique and has never been experienced during a bird impact test.
Drone/windshield impact simulations performed under the FAA-ASSURE (UAS Airborne Collision Severity evaluation2) suggests a damage level category of 2 based on their damage level
categories chart (Table 3) at a drone (quadcopter) impact speed of 250 knots. The report outlines that the impact does not induce considerable damage to the windshield where a significant fraction of the deformation due to the impact is absorbed by the drone. The experimental impact test results do not agree with the simulation results by ASSURE. It is important to mention that ASSURE’s simulations considered a whole aircraft with an integral cockpit, whereas NRC’s tests were performed on a test frame as reported in section 2.1.”
Based on the results of the impact tests, it is recommended to develop a separate damage level category for windshields since failure of the structural glass pane may cause a direct threat to the pilots.
3
WING LEADING EDGE IMPACT TESTING
Drone impact testing were conducted on aircraft wing sections of an AWM 525 (Part 25) representative aircraft. The wings were removed from a retired aircraft and cut into sections for easy manipulation and storage. A total of three segments per wing were obtained as depicted in
Figure 22. For these tests, only the middle and tip segments were used.
3.1
Wing Test Setup
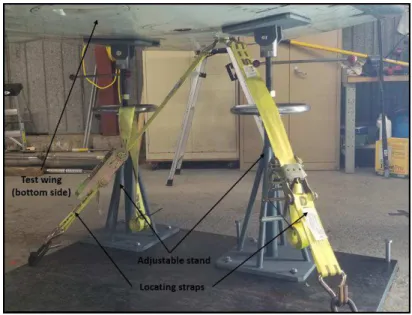
Four adjustable stands, secured to a steel plate (5’ x 12’ x 1”) were used to locate the wing sections at the appropriate height and orientation to the cannon (Figure 23). In addition to height adjustment, each stand features a pivoting flat plate and a rubber pad to match the curvature of the wing lower surface and ensure full contact. Heavy duty straps were also used to secure the wing sections in place. The straps were anchored to the steel plate via swivel hoist rings and hooked into the lower wing skin by removing the access panels as shown in Figure 23. This doesn’t fully represent a real boundary condition of the wings but it allows the wing test sections to be fixed in place during the impact.
It is important to mention that the wing sections were positioned at a sweep angle of 25° to the cannon to represent the wing orientation in flight and during an impact condition. Angle of attack is usually within 1 to 2 degree and was set to zero (0°) in the test setup as it was deemed to have no effect on the test results. The drones’ impact trajectory was selected to be parallel to the aircraft’s longitudinal axis as depicted in Figure 22.
Figure 23: Wings test stand
3.2
Wing Test Data Analysis
3.2.1 Low Speed with Deployed Slats
A total of four tests were performed at a speed of 140 knots (72 m/s) simulating the approach speed for an AWM 525 (Part 25) aircraft. Leading edge slats were deployed and impact locations were pre-defined (Figure 24). Location L1 represents an impact at the leading edge of the slat, whereas location L2 represents an impact target location at the upper side of the slat. All tests were conducted on the middle segment of the PORT wing. Details of this segment along with the impact location of each test are illustrated in Figure 25. The wing is shown in the up-side-down position to identify the various slat tracks, actuator and sensor. Impact target locations were chosen to be approximately in the middle of sections 1, 3, 4 and 6. A summary of the test conditions and battery status for each test is presented in Table 4.
Similarly to the windshield tests, a total of four high speed cameras were used for the wing impact tests as depicted in Figure 26. Two cameras, C1 and C2, were used to measure the drone’s speed and orientation angles, yaw and pitch, respectively, with the C3 camera measuring the roll angle. The C4 camera recorded an overall isometric view of the impact.
Tests #1 and #2 were conducted at the lower position, L1, of the slat as illustrated in Figure 27.
Figure 28 shows the drone/sabot assembly for Test #1. The image shows the battery and camera supports built into the back of the sabot. The camera was also secured to its mount on the drone using zip ties to reduce the risk of its detachment from its mount during acceleration.
Figure 24: Impact locations with slat deployed
Figure 25: Wing middle segment (Upside-down)
Table 4. Low speed test conditions (Wing: middle)
Test # Velocity [knot, m/s] Location Battery 1 140 (±5), 72 (±2.5) Leading edge of slat, free end Discharged
2 140 (±5), 72 (±2.5) Leading edge of slat, between tracks Charged
3 140 (±5), 72 (±2.5) Upper side of slat, between tracks Discharged
Figure 26: Wing test setup for low speed condition
Figure 27: Wing setup for Tests #1 and #2 (140 knots)
Figure 29 shows the sequence of images from Test #1 of the drone impact with the wing slat at a speed of 138.6 knots. During this first test, the drone experienced significant rotations in all planes, the roll angle was approximately 66°, while the pitch and yaw angles were approximately 10.5° and 24° respectively. The severe roll of the drone, 66°, caused the center of mass of the drone to miss the intended impact point on the wing’s slat resulting in the majority of the drone’s mass to deflect into the floor, lessening the damage that the slat ended up receiving. The images from
Figure 29, cameras C2, side view and C3 back view capture the incident well. Motor #1 first impacted the slat followed by its arm and then the back motor (#4) and its arm. The main mass sheared off and impacted the steel floor plate.
Pictures of the slat after the tests are presented in Figure 30. As surmised, the damage was not as severe. The drone was completely destroyed as presented in Figure 31. The batteries were not fully destroyed and as the batteries were discharged prior to testing, no sign of ignition was observed.
Figure 30: Post-test pictures of the slat (Wing, Test #1)
For the second test, the wing segment was lowered by 2 inches (5.08 cm) to reduce the risk of missing the designated impact point, set within a circle with a radius of 3” (7.62 cm) as indicated in the test plan document.
The second test was successful in terms of hitting the target point within the permissible tolerance of the test speed (142.8 knots). Figure 32 shows pictures extracted from the high speed videos recorded from the camera C2, side view, camera C1, top view, and camera C3, back view locations. Similar to the first test, the drone’s trajectory was perfectly aligned. However, the rotation angles were not as severe, especially for the roll angle which was approximately 26° (a difference of 40° from the first test). The pitch angle was higher (22°) but was directed upward, helping to keep the drone moving towards the top side of the slat. It is also important to note that the wing’s sweep angle of 25° and drone yaw angle of 10.5° led to the drone impacting the slat with motor #2 first. This was followed by the left leg, then the main body which includes the battery pack and the camera. The curvatures of the slat/leading edge and the wing’s sweep angle had diverted/deflected the drone on impact away from the target area.
Pictures of the impacted section of the slat are presented in Figure 33. From the impact of the drone, described above, one can observe the damage caused by the impact of the various drone parts on the slat. Even though the dents were permanent (plastic deformation), the exterior skin of the slat did not experience any penetrating damage or tears. However, the slat did experience a noticeable distortion on its free end as depicted in Figure 34. The distance between the impact location and the free end was about 4 feet (1.2 m).
Upon inspection of the damage to the wing slat, an attempt to retract the slat was performed to assess the extent of damage on the deployment/retraction operation. The wing slat was manually retracted with a minimum effort as shown in Figure 35 that depicts the slat in its retracted position.
Figure 33: Post-test pictures of the slat (Wing, Test #2)
Figure 35: Slat retraction after Test #2
Figure 36: Post-test pictures of the drone (Wing, Test #2)
The drone was completely destroyed as a result of the impact. The battery started to smoke as a result of oxidation caused by damage to the battery pack from the impact and were immediately extinguished following accept procedures to eliminate any risk of fire and the creation of toxic fumes. Figure 36 shows the remains of the drone after impact, along with the remains of the partial burnt battery housing.
A summary of the drones orientation angles and measured speeds are presented in Table 5.
Table 5. Speed and drone impact angles (Leading edge of slat, L1)
Test # Velocity [knot, m/s] Orientation angle [°]
Pitch Yaw Roll
The leading edge slat was deployed back and secured in place using straps and the wing was then repositioned for Test #3. Figure 37 shows the setup and impact locations for Tests #3 and #4. Both tests were conducted at low speed (140 knots, 72 m/s) with the target located in the upper side of the slat, as shown in the lower left image of Figure 37. The drone used for Test #3 had a discharged battery and the camera was secured in place using zip ties, as in previous tests. Figure 38 shows the drone location in the sabot and the entire assembly being loaded into the canon prior to the initiation of the test fire.
The impact locations for tests #3 and #4 were selected to assess the likelihood of the drone puncturing the leading edge skin and the extent and severity of any internal damage caused from an impact. However, based on the characteristics of the curvature of the leading edge at that specific location, as seen in Figure 39, it was surmised that the impact energy will be less severe than when compared to the target locations of Tests #1 and #2.
Figure 37: Setup and target loaction for Tests #3 and #4
Figure 39: Impact point and leading edge curvature
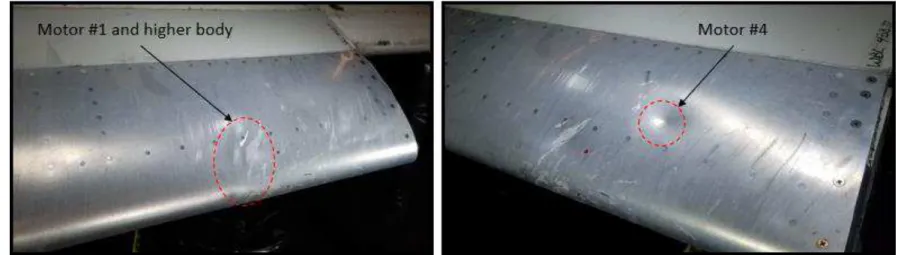
Figure 40 shows the impact sequence for the three main flight planes. The images show that the drone experienced little movement from its initial orientation through its trajectory to the target. The yaw angle was approximately 1.5°, the upward pitch angle was approximately 8° and the roll angle was approximately 16°. The drone’s average measured speed of 138.2 knots was within the accept test requirements for a low speed test. The initial point of impact started with the left leg, motor #2, right leg and camera and then the main body followed by motor #3 and motor #1. The
over the remaining part of the wing, as opposed to the effects of having a less steeper angle of impact with much less deflection and more direct impact energy as seen in Test #2.
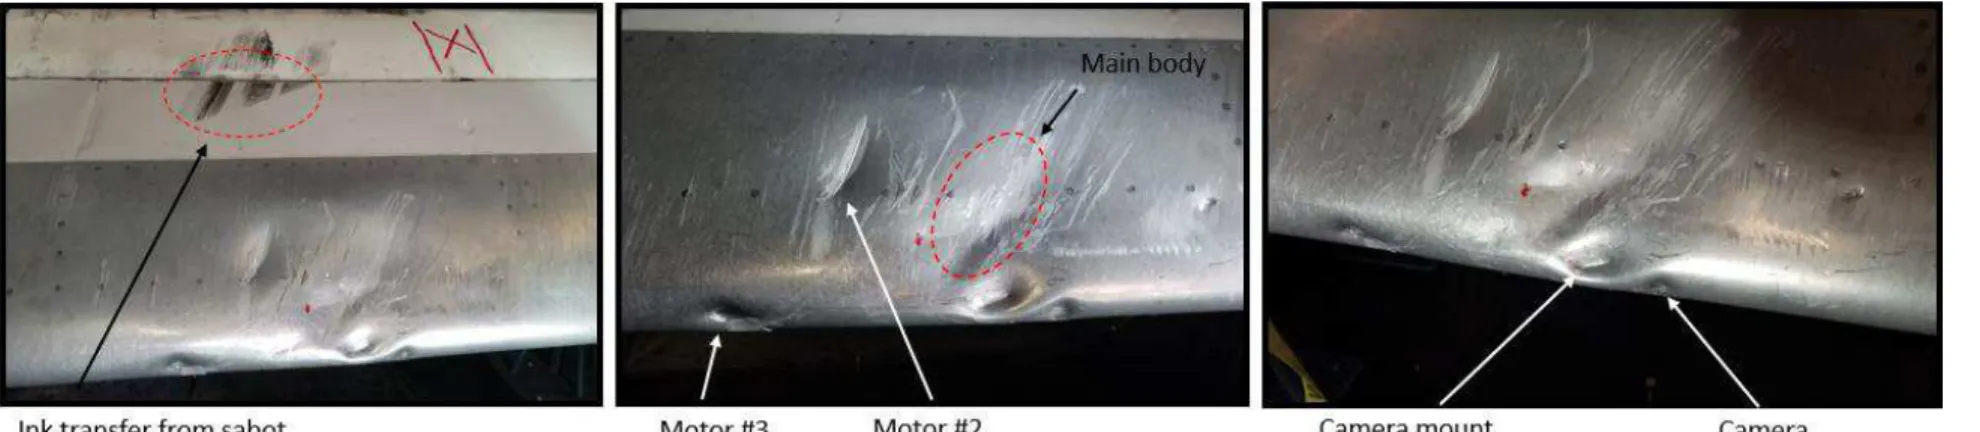
The slat was deformed in various locations as indicated in Figure 41. The leading edge was also slightly deformed by motor #1. In terms of severity, the damage caused by the motors and main body on the upper part of the slat is significant. Tears in the slat have caused the underlying honeycomb structure to deform and become partially exposed. No damage was observed on the leading edge skin located under the slat’s deformations.
After impact, the drone continued its flight as an integral damaged mass until its secondary impact with the mobile debris shield and floor leading to its complete disintegration (Figure 42).
Figure 41: Post-test pictures of the slat (Wing, Test #3)
Test #4, at low speed, was conducted using a drone with a fully charged battery (Figure 43) aimed at the space between the actuator and the sensor as showed in the lower right image of Figure 37.
Figure 44presents the sequence of the impact. The drone movement/rotation are quite similar to those of Test #1 with a pitch angle of 6.5°, yaw angle of 17.5° and a roll angle of 90°. However, the impact was on target but the effect of the battery was insignificant. Actually, the way the main body of the drone impacted the slat created a reaction force that led the battery to gradually eject as the drone was diverted away from the wing as showed in the series of images extracted from the C4 camera (Figure 45).
After the ejection of the battery, the trajectory of the drone changed with a very steep post-impact pitch angle. The drone impacted the ceiling and jammed within the ceiling metal sheeting as depicted in Figure 46 (top row). The battery pack landed in the snow outside the test facility. Surprisingly, it was still on and looked in good condition. Only a few cracks were noticed on its external housing (Figure 46).
Pictures of the impacted area of the slat are presented in Figure 47. The type of damage is more or less similar to the one of Test #3. The motors caused dents on the slat and leading edge, whereas the impact of the main body and camera generated deep deformations of the skin of the slat. The underlying aluminum honeycomb structure was deformed and exposed. After the test, the back side of the slat was inspected and no sign of severe secondary damage was observed.
Table 6 gives the drones’ orientation angles and measured speeds for Tests #3 and #4.
Figure 47: Post-test pictures of the slat damage (Wing, Test #4)
Table 6. Speed and drone impact angles (Slat upper side, L2)
Test # Velocity [knot, m/s] Orientation angle [°]
Pitch Yaw Roll
3 138.2, 71.1 8 1.5 16
3.2.2 High Speed with Retracted Slats
Two high speed impact tests, Test #5 and #6, were conducted on the STBD wing, tip segment at a speed of 250 knots (128.6 m/s). The speed of 250 knots represents the threshold for aircraft operation under 10,000 feet (3048 m)3. The slat was set in the fully-retracted position. Details of the tip segment, along with the impact location of each test are illustrated in Figure 48. In this figure, the wing is oriented in an inverted position to better identify and visualize the various slat tracks, actuator and sensor. Impact target locations were selected to be in the middle of sections 1 and 6. Section 3 incurred slight damaged during handling and was consequently excluded from testing. A summary of each test condition and battery status is summarized in Table 7. Test #5 was conducted using a drone with a discharged battery, whereas for Test #6, the battery was fully-charged.
Figure 48: Wing tip segment and impact locations (Upside down)
Table 7. High speed test conditions (Wing: tip)
Test # Velocity [knot, m/s] Location Battery 5 250 (±5), 128.6 (±2.5) Leading edge of slat, between tracks Discharged
6 250 (±5), 128.6 (±2.5) Leading edge of slat, between tracks Charged
Figure 49 depicts the test setup for the high speed condition. Given that the wing tip segment comes from the STBD wing, it was mounted and oriented to reflect the proper sweep angle of the donor aircraft. The high-speed camera views used for previous tests were again employed for these tests:
- C1 and C2 measured the drone’s speed and its yaw and pitch angle, respectively. - C3 measured the roll angle.
Figure 49: Wing test setup for high speed condition
Images of the impact sections for Tests #5 and #6 are presented in Figure 51 where target points, as well as, slat track locations are identified.
It is important to note that for all tests, the selected target point has an acceptable error of impact of a radius of 3 inches (7.62 cm) around the target point. This makes targeting a specific point on the outboard section of the leading edge segment, with the slat fully retracted, very challenging (Test #5) as this segment is the thinnest section of the wing:
- raising the impact location point could result in missing the target: drone goes underneath the slat (Figure 52a),
- lowering the target point may result in diverting the drone away from the wing due to the shallow curvature of the slat/leading edge (Figure 52).
Pictures of the drone/sabot assembly for Tests #5 and #6 are presented from various angles in
Figure 53 and Figure 54. Similar to the previous tests, the battery and camera were supported within the sabot using foam blocks. The cameras were zip-tied to their support, as for previous tests, to prevent movement and reduce risk of detaching during acceleration within the barrel.
Figure 53: Drone/sabot assembly for Test #5 (Discharged battery)
Figure 54: Drone/sabot assembly for Test #6 (Charged battery)
In Figure 55 the drone/slat impacts at various time steps from the different camera angles are presented for Test #5. The drone impacted the slat at a speed of 249.4 knots (128.3 m/s) with a downward pitch angle of 2.5° and yaw and roll angles of 9.5° and 8.5°, respectively. The slat was impacted at a lower position of the target point which resulted in a redirection of its trajectory under the slat. In this figure, pictures from C2 (side) and C1 (top) clearly show the impact sequence starting by motor #1 (due to sweep angle); the upper part of the drone’s body, motor #2, then motor #4 and finally motor #3. C4 pictures, the isometric view, shows the effect of the roll angle of the drone on the impact with the target point. The slight roll caused the drone to impact the slat with the top of motor #1, first, before it was distorted and deflected under the slat.
The drone’s centre of mass hit the slat approximately 1.5-in to 1.75-in (3.81 to 4.45 cm) below the selected target location. With the majority of the center of mass missing the leading edge of the slat, Figure 56, the resulting damage to the center of the slat was not as severe as was expected. The images also show the various dents caused by the impact of the various drone’s sections. Motor #3 caused the most significant damage resulting in a tear to the skin of the slat. The track support was also dislocated as a result of the impact.
Figure 57 shows the remaining parts of the drone after the test. The drone was completely destroyed. The battery, remained intact after the impact as seen in the images in Figure 55, but incurred significant damage after impacting the rear wall of the mobile debris shield. The four cells of the battery exhibited oxidation at their smashed sides.
Figure 57: Post-test drone parts (Test #5)
The execution of Test #6 required the re-attachment of the unhooked straps to the internal structure of the wing. This was done and, in addition, the wing was strapped down using an extra strap over the top to firmly secure it to the steel plate (Figure 58).
Test # 6 was successfully conducted. The drone impacted the slat on target at a speed of 255.4 knots (131.4 m/s). The drone experienced rotation around the three main axes, a downward pitch of 9.8°, a yaw angle of 9.5° and a roll angle of 39.8°. Figure 59 presents images of the impact through various time steps from high speed cameras (C1, C2 and C4). As expected, the drone impacted the slat with motor #1 first due to the wing’s sweep angle. The motor impacted the slat at a lower position in relation to the target point as a result of the downward pitch angle and the significant clock wise, rolling angle. Then, the battery and main body followed, impacting the slat, slightly to the left of the target point. The drone rubbed on the skin of the slat and then diverted
Close up pictures of the slat after the impact are presented in Figure 60. Motors #1 and #4 along with battery caused significant damage to the slat. A large tear was caused by the drone’s main body. The angled direction of the damage was dictated by the wing’s sweep angle, as well as, the counter clockwise drone’s yaw angle. Motor # 2 also caused a deep indent on the slat. In addition, the structure of the slat was wrapped at the level of the tracks as depicted in Figure 61.
It is important to report that the slat was found to be jammed in place as a result of the impact damage. Significant mechanical force was applied in an attempt to deploy the slat with no success. It is also worth noting that such a drone impact may not cause immediate threat to an airplane, but may result in serious technical issues in deploying the flaps/slats during the approach phase of the flight.
Furthermore, the Federal Aviation Administration Advisor Circular 25.571-1D4 provides guidance related to damage tolerance for an aircraft following an incident such as a bird strike:
a) Seventy percent (70%) limit flight-maneuver loads and, separately, 40% of the limit gust velocity (vertical and lateral) at the specified speeds, each combined with the maximum appropriate cabin differential pressure (including the expected external aerodynamic pressure).
b) The airplane must be shown by analysis to be free from flutter up to Vo/Mo with any change in structural stiffness resulting from the incident.
Based on the above mentioned requirements, pilots should act accordingly in the case of a bird strike and the structure should be able to withstand 70% flight loads and 40% gust velocities. In addition, the airplane must be free from flutter at max manoeuvring speed. The same criteria can be used when assessing UAS strikes on aircraft structure. However, the results of this study cannot be used as a reference to verify such requirements.
Figure 60: Post-test pictures of the slat (Test #6)
Figure 61: Slat/track damage (Test #6)
Debris from the drone is presented in Figure 62. The impact energy was of such significance that it caused the drone to break apart and destroy some of the protective foam layer installed on the internal side of the mobile debris shield. While other pieces of debris became embedded into the foam layer. The battery pack began to smoke and ignited immediately after the impact and was
Figure 62: Drone debris after impact (Test #6)
3.3
Wing Results Summary
In this section a summary of test conditions are presented in Table 8, with test data summarized in Table 9. In addition, the FAA-ASSURE damage level categories (Table 3) was used to categorize the level of damage sustained by the wing section in each of the tests from the drone impact as outlined in Table 10.
The battery charge condition does not have a direct effect on the severity of damage received. However, all tests with a charged battery led to the release of smoke from oxidation, resulting in ignition of the battery cells, which may lead to a severe secondary damage.
Table 8. Summary of impact test requirements (Wing)
Test # Velocity Wing
segment Impact location on slat
Battery status knots m/s
1 140 (±5) 72 (±2.5) Middle Deployed slat, lower part Discharged
2 140 (±5) 72 (±2.5) Middle Deployed slat, lower part Charged
3 140 (±5) 72 (±2.5) Middle Deployed slat, higher part Discharged
4 140 (±5) 72 (±2.5) Middle Deployed slat, higher part Charged
5 250 (±5) 128.6 (±2.5) Tip Retracted slat, lower part Discharged
6 250 (±5) 128.6 (±2.5) Tip Retracted slat, lower part Charged
Table 9. Summary of speed and drone orientation angles (Wing)
Test #
Drone impact speed Drone orientation angle [°]
knots m/s Pitch Yaw Roll
1 138.6 71.3 10.5 24 66 2 142.8 73.5 22 10.5 26 3 138.2 71.1 8 1.5 16 4 135.7 69.8 6.5 17.5 90 5 249.4 128.3 2.5 9.5 8.5 6 255.4 71.3 9.8 9.5 39.8
Table 10. Damage severity level (Wing impact)
Test #, speed (kn)
Severity Description Damage picture
1, 140 Level 1 Small plastic deformation Battery missed target
2, 140 Level 2
Extensive plastic deformation on external skin.
Distortion of secondary parts No failure of skin
3, 140 Level 2
Extensive plastic deformation on external skin.
Partial failure of skin
Partial damage to underlying structure
4, 140 Level 2
Extensive plastic deformation on external skin.
Localised failure of skin Partial damage to underlying structure
Battery missed target
5, 250 Level 2
Skin fracture
Extensive plastic deformation of skin
Secondary damage (tracks) Battery missed target point
6, 250 Level 3
Extensive failure of the skin Penetration of drone debris inside the fractured area Secondary damage (tracks) Slat jammed in place
4
CONCLUSION
Impact tests of quadcopter drones against AWM 525 (Part 25) aircraft components have been carried out at the National Research Council of Canada (NRC). The test campaign focused on windshields and wing leading edge components. Tests were performed at two speeds simulating real operating conditions of this type of aircrafts: approach speed of 140 knots (72 m/s) and maximum operational speed, under 10,000 feet, of 250 knots (129 m/s). Table 11 provides a high level summary of the results and below is a list of the main conclusions:
Drone impact on windshields results in a considerable damage especially at the speed of 250 knots. All the glass plies were fractured and a significant amount of glass fragments were released into the cabin (~25% of the structural inner glass pane).
Such an impact results in completely impaired vision through the windshield.
It is believed that the cloud of fragments released into the cabin would have posed a penetration and inhalation hazard to the operator located directly behind.
The severity of damage resulting from an impact of a drone against a leading edge slat depends on the impact speed, drone rotation angles and impact location on the slat.
Impact tests on the front windshield mounted in a real cockpit will be needed to validate the above conclusions.
All wing impact tests assumed that the drone was flying parallel to the aircraft’s longitudinal axis; hence, the sweep angle of the wing was accounted for.
Impact tests at low speed (140 knots) on deployed slats (leading edge of slat) result in plastic deformation of the skin. The battery pack plays a significant role in defining the damage severity.
Impacts at the same speed on deployed slats at their upper side caused extensive damage to the skin and underlying honeycomb structure.
Drone impacts on retracted slats at high speed (250 knots) caused skin fracture, severe deformation of the slat curvature, secondary damage to the leading edge and penetration of drone debris into the fractured area. Such damage is categorized as level 3 according to FAA-ASSURE damage level reference.
All impact tests using charged batteries (LiPo) resulted in severe failure of the batteries cells (generation of toxic fumes, ignition, etc.). However, fumes or battery ignition will have no effect on the aircraft operation since none of the batteries or their components were lodged within the wing structure.
Future impact tests on windshields for AWM 525 (Part 25) aircrafts should consider the following:
1) Test a front windshield mounted in its original cockpit to have the proper boundary condition along the perimeter of the windshield.
2) Use of a witness plate positioned appropriately and fabricated such that the projected debris will be retained and their distribution and penetration depth can be assessed 3) Install a high speed camera inside the cockpit to assess the structural windshield
deformation and measure glass fragment speed (inboard)
Future impact tests on wings for AWM 525 and AWM 523 (Part 25 and Part 23) aircrafts should consider the following:
1) Consider impact tests on other key locations of the leading edge (actuator, sensor and slat track).
2) Perform impact tests against the leading edges of the horizontal and vertical stabilizers. 3) Engine drone ingestion, fan blades and/or engine cowl lip impact testing.
4) Perform impact tests on AWM 523 aircraft components (wings, struts, empennage and propeller blade).
Table 11. Results summary for wing and windshield impact tests
AWM 525 (Part 25) Aircraft
Leading edge slat Windshield
Deployed (140 kn) Retracted (250 kn) 140 kn 250 kn Case Test 1 Test 2 Test 3 Test 4 Test 5 Test 6 Test 1 Test 2 Severity Level 1 Level 2 Level 2 Level 2 Level 2 Level 3 Fail Fail
Fire risk No No No No No No No No
1 BAAT: Stands for the names of NRC staff who designed the sabot (Brian, Allan, Azzedine and Tim)
2 http://www.assureuas.org/projects/deliverables/a3/Volume%20I%20-%20UAS%20Airborne%20Collision%20Severity%20Evaluation%20-%20Structural%20Evaluation.pdf 3 F AR 91.117(A) 4https://www.faa.gov/regulations_policies/advisory_circulars/index.cfm/go/document.information/documentID/865 446