Analyzing the Flow of Knowledge with Sociometric Badges
The MIT Faculty has made this article openly available.
Please share
how this access benefits you. Your story matters.
Citation
Fischbach, Kai et al. "Analyzing the Flow of Knowledge with
Sociometric Badges." Procedia - Social and Behavioral Sciences 2, 4
(June 2010): 6389-6397 ©2010 Elsevier Ltd.
As Published
https://dx.doi.org/10.1016/j.sbspro.2010.04.048
Publisher
Elsevier BV
Version
Final published version
Citable link
https://hdl.handle.net/1721.1/125603
Terms of Use
Creative Commons Attribution-NonCommercial-NoDerivs License
COINs2009: Collaborative Innovation Networks Conference
1877-0428 © 2010 Published by Elsevier Ltd. doi:10.1016/j.sbspro.2010.04.048
Procedia Social and Behavioral Sciences 2 (2010) 6389–6397
Analyzing the Flow of Knowledge with Sociometric Badges
Kai Fischbach
1, Peter A. Gloor
2, Casper Lassenius
3, Daniel Olguin Olguin
2, Alex (Sandy)
Pentland
2, Johannes Putzke
1, Detlef Schoder
1 1University of Cologne, Germany2MIT, Cambridge MA,USA 3Helsinki University of Technology, Finland
(the names of the authors are in alphabetical order)
Elsevier use only: Received date here; revised date here; accepted date here
Abstract
This paper presents a collection of “best practices” for the use of “Sociometric Badges" that support automatic collection of face-to-face interaction between workers within an organization. The practices presented aim to improve data quality over legacy methods allowing insights into the processes and structures of an enterprise’s de-facto communication networks. Our approach uses dynamic Social Network Analysis (dSNA) to make it easier for executives to analyze and manage communications networks. The practical applicability of the approach was evaluated by case studies conducted in three different organizations: (1) the marketing department of a medium sized bank in Germany, (2) the post-anesthesia care unit at a large US hospital, (3) teams of software developers in a Nordic European country. For the analysis, we tracked, amongst others, all personal interactions between the knowledge workers in a department or team using sociometric badges worn by each employee for the duration of the case studies. We analyzed this sociometric data as well as emails and instant messages exchanged between the employees and compared it with performance data of individuals and teams. The paper highlights 16 key lessons learnt during these studies. The first nine lessons focus on overcoming the employee's privacy concerns to set up the necessary technology infrastructure, and the final seven provide general findings for efficient management of knowledge workers based upon the results of the case studies.
Keywords: sociometric badges, social network analysis, knowledge flow optimization
1. Introduction
In manufacturing, there is a wealth of knowledge on how to monitor and improve performance. Often, blue-collar workers are even paid by piecework rates. However, we still do not know much about the “knowledge workers” inside an enterprise. How do they cooperate and which forms of cooperation do lead to high productivity? Are there any means of measuring knowledge worker productivity? In this paper we provide some preliminary answers to these questions. In a series of projects, we analyzed knowledge flows and knowledge worker productivity in a German retail bank, nurses in a Boston area hospital, and software developers in large technology companies in a Nordic European country. In our work, we look at metrics of individuals and groups in social networks measured at a microscopic level, as a predictor of individual and organizational effectiveness and performance. By applying social network analysis to ego and social group networks and by using sociometric badges that automatically collect data on interactions, this study contributes novel insights for optimizing individual, group, and organizational
COINs2009: Collaborative Innovation Networks Conference
6390 Kai Fischbach et al. / Procedia Social and Behavioral Sciences 2 (2010) 6389–6397
performance. In this paper, we present “best practices” for setting up and running such studies in organizations, as well as present initial findings from three case studies.
2. The Analyzed Organizations
The first case organization was a regional divisions of a savings and loans association belonging to a huge financial group in Germany. We decided to analyze knowledge flows in one particular regional division for mainly three reasons: First, the savings and loans association has a decentralized organization structure. Analyzing knowledge flows in a regional subunit in detail is more meaningful than analyzing knowledge flows between more than 370,000 people who seldom interact with each other. Second, the regional division under examination is the biggest regional division of the savings and loans association. It employs about 4,500 employees in 216 branches. Furthermore, the historical roots of the regional division can be traced back till 1853, and in its current legal form till 1923. Hence, the results of the study might be generalizable to other big (incumbent) organizations. Third, the particular regional division is open towards innovations. For example, it is the first German Sparkasse (savings and loan association) with an Internet site (since 1995). Since 2004, the Internet site is optimized for use by visually handicapped people.
The second organization was a Boston area teaching hospital that has 50 Operation Rooms (OR). After surgery is completed, patients are taken to the Post Anesthesia Care Unit (PACU), where they are kept under supervision until they recover from anesthesia. Thereafter they are admitted to the floor units where they convalesce before being discharged. Patients without assigned beds on the floors are kept in the PACU until vacancies on the floors can be found. The PACU is a critical intermediary step in the surgical patient throughput system and it consistently experiences delays of various kinds. These delays cause hold ups in the OR resulting in schedule disruptions, overtime work and productivity losses (Olguin-Olguin et. al, April, 2009).
The third organization were three teams of software developers in two high-tech companies in a Nordic European country. Each team of developers was mostly co-located in one location. All teams used the highly interactive agile Scrum development methodology (Schwaber & Beedle, 2002), in which team members work together in small collaborating groups in two to four week iterations, having daily project meetings. This process is very well suited for measurement with sociometric badges. In particular, we are able to correlate interaction patterns with team outcomes on a detailed level.
In each of the three organizations we equipped 22 to 67 knowledge workers with the sociometric badges for the duration of four weeks. This length for our experiment was chosen to have a period of time long enough to overcome short periodic fluctuations such as meetings and unexpected absences of individuals, while still short enough not to overly annoy study participants by having to wear the sociometric badges over extended periods of time.
3. Analyzing Social Networks
The authors used different methods to collect data about knowledge flows between employees. E.g., at the bank we analyzed all emails exchanged between seven business units over a period of 6 months (i.e. 16 million emails). Second, we measured face-to-face interactions between the 22 employees in the "New Media" department during one month using Sociometric Badges (see Figure 1).
Figure 1. Social Badge
Sociometric Badges are small micro-computers in approximately the size of a cell phone that are equipped with a
variety of different sensors. These sensors allow tracking the wearers' position (via Bluetooth communication with base stations), movement (via three-axis-accelerometer), interaction (via infrared), and mood (via microphone and subsequent pitch analysis – no voice is recorded) (Olguin-Olguin et. al, February, 2009). Afterwards we used the software Condor (Gloor & Zhao, 2004) to visualize the social network dynamically and calculate a variety of social network statistics (Wassermann & Faust, 2005). Social badge and e-mail data is complemented by a daily online survey measuring the satisfaction with the day’s work of each study participant, as well as additional communication archives such as phone and chat logs.
4. Applying Knowledge About Social Networks
The time series about different network statistics and the movies visualizing the dynamic evolution of an organization’s social network can be used for a variety of different purposes.
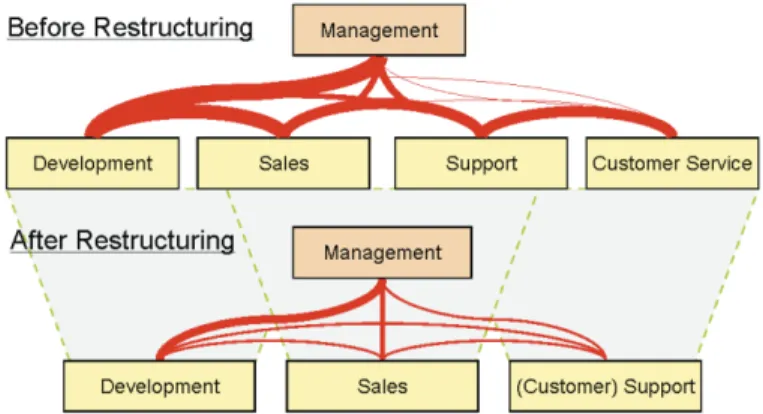
For example, the department head of the “New Media” department at the bank used this information to restructure his department. As one can see from Figure 2 and Figure 3, formal organization structures and informal communication processes diverged significantly before the reorganization.
Figure 2. Organization chart in bank before reorganization
Before the reorganisation, the two senior managers were quite peripheral in the social network of the bank (see Figure 2). The employees rather communicated to the department head directly who was overwhelmed by the different tasks he had to coordinate. Furthermore, the amount of face-to-face communication between the management team and the four different functional teams was rather unbalanced (Figure 3). A large proportion of the communication took place between the management team and the development team only. In Figure 3, the line
6392 Kai Fischbach et al. / Procedia Social and Behavioral Sciences 2 (2010) 6389–6397
weights of the red curved lines illustrate the amount of face-to-face communication between the different functional teams. Furthermore, a member of the development team mainly communicated with members from the sales team. After the reorganization (see Figure 3) the amount of communication between the different functional teams decreased significantly and became much more balanced.
Figure 3. Face-to-face communication at bank department before and after restructuring. The thickness of the lines represents the total amount of time spent in face-to-face conversations.
Network statistics and movies about network evolution can also be used for a variety of other analyses. In our studies, we also had access to performance indicators of individual employees, teams and business units. These performance indicators were self-assessments (interviews, questionnaires), as well as objective numbers from the controlling department (credit volumes etc.), the recovery time for patients in the PACU, and performance metrics for the software developers. Furthermore, we collected data reflecting the employees' personality dimensions and job satisfaction. Using this data (and the data from various other studies), we figured out certain network structures and certain types of communication that might boost economic performance of an organization. In this paper we will not describe the performance findings, they have been described elsewhere. Rather, the remainder of our paper describes 9 lessons of how to win buy-in of study participants, and 7 preliminary lessons on how to apply sociometric badges to increase organizational performance.
5. Nine Key Lessons on Increasing Acceptance for Analyzing Social Networks with Sociometric Badges
Based on our studies, we provide 16 key lessons for organizations that would like to optimize their knowledge flows using sociometric badges complemented by methods from social network analysis. The first nine lessons focus on setting up the necessary infrastructure to analyze social networks inside an enterprise. The last seven focus on results about the influence of social networks on organizational performance.
To many subjects, data on their communicative behavior – in particular as collected by sociometers – is inherently personal and considered sensitive. Therefore, the idea of management collecting and using that data can easily instill feelings of fear and distrust unless the goals of the study, as well as how data will be collected and analyzed and used is clearly communicated to all participants. In particular, issues of privacy and voluntary participation in the study are important.
When trying to convince people of the advantages of Sociometric Badges, emphasize the playfulness of the badges. Phrases like "Thinking about this project even lets my heart beat quicker" will create a relaxed atmosphere and positive attitude toward the Sociometric Badges. Without this positive attitude, the data might easily become flawed, as it is easy for participants to reduce data quality.
In a similar vein, support the "we feeling" of the employees in a department wearing the Sociometric Badges. No one wants to be an "outsider" (even if no one else notices) and belong to the group of "Non-Badge-Wearers".
5.2. Lesson #2: Use External Analysts
On the one hand, many knowledge workers might be interested in optimizing knowledge flows in their enterprise. On the other hand, they might also fear that some knowledge about their personal communication in the hands of the wrong decision makers might impede their personal careers, and hence do not want to provide their supervisors insights into their personal interactions. Therefore, and of course somewhat self-servingly, we recommend managers to entrust third parties with the data collection and analysis.
5.3. Lesson #3: Do a Pilot Study
Your best sales people for participation in badge studies will be your own employees who have taken part in a study previously. Therefore, it is best to carefully select a part of your organization in which the participation threshold is low for a pilot study before doing a larger scale study.
When employing Sociometric Badges in a multinational enterprise, start to run the pilot application in an office with an open culture that is also open towards new technologies. For example, the German Bank, the Boston area teaching hospital, and the Nordic European technology companies all have a reputation for an open culture and a willingness to experiment. Rather emphasize the prospects of using Sociometric Badges for knowledge flow optimization, than using them for measuring knowledge worker productivity (or even don't measure knowledge worker productivity at all). Almost every employee will be willing to participate in a Social Badge study if you can communicate to him/her that the results will lead to less workload for each individual due to optimized information flows, less need for coordination and more individual freedom.
Starting with a technical department can be beneficial. Many employees in those departments love carrying gadgets. Furthermore, these employees will be your best advocates for promoting your idea through the whole enterprise. They will be proud to wear the badges, answer curious questions about them, and will convince the members of other departments of the advantages of the study.
5.4. Lesson #4: Make Participation Voluntary and Allow Workers to Wear Dummy Badges
Participation in the study should be voluntary. Therefore, allow non-participating employees to wear dummy badges without any functionality, so that the other team members do not know who participates in the study and who does not. After a short period of time, most employees want to wear "real" badges with full functionality, because they will be curious about the results.
6394 Kai Fischbach et al. / Procedia Social and Behavioral Sciences 2 (2010) 6389–6397
5.5. Lesson #5: Allow Unobserved Areas
Even the most enthusiastic Social Badge wearers do not want to be under surveillance all the time. Therefore, allow some unobserved areas (besides the bathroom). It is better to have some missing data that you can control for than putting your analysis to the risk of sabotage. For example, two employees can just put two Sociometric Badges next to each other and close to a radio without wearing them.
5.6. Lession #6: Allow for a Dust-Settling Period
Factor in a dust-settling period into your study, because it will take a few days until all participants are willing to participate in the study, and don't behave artificially anymore. For example, one worker stated at one of the first days of one of our studies to another worker "Look at me! - Otherwise our sociometric badges won't recognize our communication!" However, some days later the same worker forgot to remove his Social Badge after work to recharge its battery, but only noticed on the way home that he was still wearing the Sociometric Badge.
5.7. Lesson #7: Provide Fast Feedback
In the beginning of a Social Badge study, most employees will be skeptical towards the results. To overcome these concerns, the analysts should provide fast feedback to each employee and communicate the results openly. This means that each employee should already see after a few days a graph or movie illustrating her/his position in the social network of the organization. Seeing those movies will make the employees involved in the study and enthusiastic about discovering more about their personal interactions. However, communicating the results openly does not mean to neglect privacy issues. Therefore, feedback should be provided to each employee personally, with the names of the other employees in the graph made anonymous. Furthermore, the investigators should not provide any written material to the employees containing individual names, so that the social network cannot be reconstructed collaboratively by some of the employees.
5.8. Lesson #8: Sapere Aude!
When you will see the first analysis of Social Badge data in your enterprise, you will be surprised how accurate the results will reflect some of your impressions about what is going on in the organization. However, avoid trusting the data blindly. All quantitative measures need some qualitative interpretation. And also don't be afraid of the results. Even if somebody is unexpectedly peripheral in the social network of the enterprise, there might be a reasonable explanations for it (e.g. a lot of external cooperation partners). Use the data as a starting point for deeper qualitative analysis. If you have the funds, investigators could also do interviews and observations during the data collection phase of the sociometric badge study to aid them in interpreting the data.
5.9. Lesson #9: Share Individual Insights with the Individual, General Insights with the Managers
We obtained high buy-in among study participants by promising to only share individual results such as network position and personality characteristics with the individual, while giving a condensed view of organizational network structure and communication patterns to management. For example, the nurses in the hospital enthusiastically embraced our results, because we were able to show the high contribution of senior nurses to the smooth operation of the PACU. This was something people always had guessed might be true, but so far had had no way of proving it.
6. Seven Key Lessons on the Influence of Social Networks on Organizational Performance
Besides the lessons about how to proceed when setting up the necessary technical infrastructure, we also gained seven key insights about the influence of social networks on organizational performance.
6.1. Lesson #1: Formal Structures Seldom Reflect Real Communication Processes
In the teams we examined, formal organizational charts and defined business processes did not always correspond to the real communication processes. Like illustrated above in the case of the New Media department, reorganization measures incorporating information from social network analysis can help avoid cognitive overload of managers.
6.2. Lesson #2: Identify “Hidden Leaders” Among Central Actors in a Social Network
Generally, study findings suggest that employees who occupy central positions in a team's social network have a higher productivity and are more satisfied with their jobs. However, study findings also suggest, that some central actors are not able to handle all the work tasks they are expected to coordinate. This is particularly true for employees who do not hold a high hierarchical position in the enterprise. The discrepancy between high centrality and missing authority within the organization can be illustrated using the (true) case of an introverted, technical employee who coordinated almost all work tasks in his (non technical) team, and who had a low position in the department's hierarchy. Often, his colleagues complained about the "nerd" who was not able to accomplish all work tasks given to him in time. Hence, he got the reputation of being lazy and being not able to work. Consequently, the employee also got very dissatisfied and thought about quitting his job, even though he was one of the top performers in the department, occupied the strategically most important position in the social network of the department, and controlled very important knowledge flows inside the enterprise. If this employee had left the company, it would have posed a serious threat for the operational efficiency of the whole department.
Hence, if low-hierarchy employees start complaining about too much workload, higher management should take these complaints seriously and try to identify the (un-)official interfaces and contact persons of these employees in the enterprise. Sometimes, these employees hold the strategically most important positions inside an enterprise, and there might be some need for formal restructuring.
6.3. Lesson #3: Volatility of Group Centralization has Different Effects on Performance of "Creative" and "Throughput" Teams
When examining the effects of degree of balance in team communication on team performance, we discovered that one should distinguish between "throughput teams" and "creative teams" (Gloor et. al. 2007b). Whereas creative teams benefit from alternating communication patterns, throughput teams benefit from stable communication patterns. Particularly, the authors found that a high volatility of the network statistic "group centralization" can be beneficial for team performance of creative teams, i.e. creative teams perform the best, if phases of "total anarchy in communication", and phases of strong hierarchical communication alternate in regular patterns. In contrast, the economic outcome of throughput teams (i.e. teams that need a lot of accuracy such a customer service team that repetitively processes contracts) benefits from a stable and hierarchical communication structure (i.e. a high "group centralization" network statistics).
6.4. Lesson #4: Reciprocity Boosts Team Performance even though Team Members might not notice
Reciprocity in communication means that, for example, if employee A sends an email to employee B, employee B will also send an email to employee A in return. To measure reciprocity, the authors used a contribution index that reflects the ratio of messages sent by employee A to other team members vs. messages received by employee A other team members (Gloor et. al. 2007). Afterwards the authors aggregated these individual statistics to a network statistic at team level. Our findings suggest that teams composed of individuals that have a more balanced communication have a better (objective) performance than teams composed of members that have an unbalanced communication. However, when teams have to evaluate their own performance, teams with a more balanced communication do not rate their performance higher than teams with an unbalanced communication. Note that instead of messages the contribution index can also measure face-to-face interaction through sociometric badges, where in an unbalanced case one person looks at the other, while the other person never looks the first one into the face.
6396 Kai Fischbach et al. / Procedia Social and Behavioral Sciences 2 (2010) 6389–6397
6.5. Lesson #5: Birds of a feather flock together
The finding that birds of a feather flock together is not really new, and analyzed extensively in academia by a stream of research in “homophily theory”. In a similar vein, the authors also found that high performing employees tend to communicate with other high performing employees. Therefore, in a business context it is important that managers do not only strategically optimize their formal cooperation networks and cooperation partners, but also their informal communication networks and friends. For example, in another study (Raz & Gloor 2007) analyzed informal communication networks between 100 Israeli software start-ups. From 2000 to 2004, 42 percent of the enterprises in the study did not survive. However, probability of surviving was significantly higher for enterprises whose managers communicated often with managers from other (surviving) enterprises. Using sociometric badges, we can identify people with similar and complementary characteristics to establish groups of high-performers (Gloor et. al 2010)
6.6. Lesson #6: Innovations Spread in a Generalizable Pattern
Another question is whether ideas, projects and products that will be successful in the future can be identified already in early stages of product development. In earlier work we have introduced a generalizable pattern how successful innovations spread throughout "Collaborative Knowledge Networks" (CKNs) (Gloor 2006). In the first phase, a small number of densely interconnected actors develop a new idea (in the so called COIN – Collaborative Innovation Network). In the second phase, the visionary idea is taken by another group of visionaries, who excel not only in vision, but further develops the idea. Those people form the nucleus of the CLN (Collaborative Learning Network), joined by visionaries of the previous phase as experts, gurus, or wizards. In the third phase, the innovation achieves external recognition. New members are attracted to the innovation (labeled as Collaborative Interest Network – CIN). These actors communicate the advantages of the innovation to the outside world until the innovation is adopted.
Managers could try to analyze the diffusion of new ideas in their enterprises and identify the key employees that drive those innovations based on their communication patterns in COINs.
6.7. Lesson #7: Measuring Response Times to Emails boosts Economic Performance
The final lesson learnt from our studies is that telling people that high performing employees have shorter response times to emails and to measure their response times boosts economic performance.
First, study findings suggested that people who have similar work tasks respond quicker to emails if they have a better performance.
Second, if you tell people that you start measuring and communicating their response times to emails, no one wants to be a "low performing worker" and hence tries to answer all emails more quickly. This behavioral change results in less idle times when waiting for data by other knowledge workers and hence leads to a higher economic outcome of the enterprise.
Therefore, we recommend to start measuring and communicating response times to emails and to communicate these results to employees (e.g. using rankings). Even though response times might not be comparable between different departments, they might be within some functional teams. The concerned employees themselves will know best how to interpret the results.
7. Conclusions and Outlook
In this study, the authors showed how methods from social network analysis can be applied to analyze and optimize knowledge flows in a German bank, a Boston teaching hospital, and a Nordic European software company and provided some lessons learnt. While the organizational chart of an organization is like a skeleton of a body, and the organizational processes are like its blood system, in this paper we showed a way to understand the nervous system of an organization – the invisible knowledge flows.
We hope that this article together with the hardware and software provided and lessons learnt will help foster the transition of our approach from a basic research into the industrial world.
References
Gloor, P. Oster, D. Raz, O. Pentland, A. Schoder, D. "The Virtual Mirror - Reflecting on Your Social and Psychological Self to Increase Organizational Creativity", to appear in Journal on International Studies of Management & Organization, M.E Sharpe. Summer 2010 vol. 40, no. 2
Gloor, P. Paasvaara, M. Schoder, D. Willems, P. Finding Collaborative Innovation Networks Through Correlating Performance With Social Network Structure. Journal of Production Research , Taylor and Francis, April 2007
Gloor, P. Zhao, Y. TeCFlow - A Temporal Communication Flow Visualizer for Social Networks Analysis, ACM CSCW Workshop on Social Networks. ACM CSCW Conference, Chicago, Nov. 6. 2004.
Gloor, P. Swarm Creativity, Competitive Advantage Through Collaborative Innovation Networks. Oxford University Press, 2006
Gloor, P. Oster, D. Putzke, J. Fischbach, K. Schoder, D. Ara, K. Kim, T. Laubacher, R. Mohan, A. Olguin Olguin, D. Pentland, A. Waber, B. Studying Microscopic Peer-to-Peer Communication Patterns. Proc. AMCIS Americas Conference on Information Systems, Keystone, Colorado, Aug. 9-12, 2007
Olguin-Olguin,D.;Waber, B. N.; Kim, T.; Mohan, A.; Ara, K.; and Pentland, A.. Sensible Organizations: Technology and Methodology for Automatically Measuring Organizational Behavior. IEEE Transactions on Systems, Man, and Cybernetics-Part B: Cybernetics. Vol. 39 No. 1 February, 2009.
Olguin-Olguin, D., Gloor, P. A., and Pentland, A. Wearable Sensors for Pervasive Healthcare Management. 3rd International Conference on Pervasive Computing Technologies for Healthcare 2009. London, UK. April, 2009
Pentland, A. 2006. Automatic mapping and modeling of human networks. Physica A 378(1):59–67. Pentland, A. 2007. On the collective nature of human intelligence. Adaptive Behavior 15(2):189–198.
Raz, O. Gloor, P. Size Really Matters - New Insights for Startup's Survival, Management Science, February 2007 Schwaber, K. and Beedle, M. Agile software development with Scrum. Prentice-Hall, 2002.