HAL Id: hal-02751876
https://hal.inrae.fr/hal-02751876
Submitted on 3 Jun 2020HAL is a multi-disciplinary open access archive for the deposit and dissemination of sci-entific research documents, whether they are pub-lished or not. The documents may come from teaching and research institutions in France or abroad, or from public or private research centers.
L’archive ouverte pluridisciplinaire HAL, est destinée au dépôt et à la diffusion de documents scientifiques de niveau recherche, publiés ou non, émanant des établissements d’enseignement et de recherche français ou étrangers, des laboratoires publics ou privés.
Tools to visualise the structure of multi-agent
conservations at various levels of analysis
Tiana Ralambondrainy, Jean-Michel Médoc, Rémy Courdier, Francois Guerrin
To cite this version:
Tiana Ralambondrainy, Jean-Michel Médoc, Rémy Courdier, Francois Guerrin. Tools to visualise the structure of multi-agent conservations at various levels of analysis. International Congress on Modelling and Simulation, Dec 2007, Christchurch, New Zealand. �hal-02751876�
Tools to Visualise the Structure of Multi-agent
Conversations at Various Levels of Analysis
Ralambondrainy, T. 1, J.-M. Médoc 2, R. Courdier 1 and F. Guerrin 2
1
Université de la Réunion, EA2525, Iremia, Saint-Denis, La Réunion, F-97715 France 2
Cirad, UR Risque environnemental lié au recyclage, Saint-Denis, La Réunion, F-97408 France Email: tiana.ralambondrainy@univ-reunion.fr
Keywords: multi-agent based simulation, simulation observation, conversation, agent interaction,
human-computer interaction.
EXTENDED ABSTRACT
Multi-Agent Based Simulation (MABS) is a suitable way to simulate the dynamics of natural or social systems. However, observing and analysing large-scale simulations involving numerous, complex and heterogeneous agents is still a challenge. Understanding simulation results requires the user to perform the following visual information-seeking tasks: (i) overview, (ii) zoom-and-filter, (iii) details-on-demand. This paper concentrates on the analysis of conversations among agents in MABS at various scales, from global overview to local details.
Tools do exist in today’s platforms to visualise the organisational structure of a MABS (i.e., agents’ representation within their environment) and also to provide details based on local message exchanges as in the AUML formalism. However, to our knowledge, tools for viewing information exchanges among agents at various scales (namely at a macro level) are still lacking.
The need to understand phenomena ranging from macro level to local interactions arise at every phase of the modelling cycle in order to answer the questions that should be asked:
• Conceptual validity: Is the representation reasonable for the model’s intended use? • Computerized model verification: Does
the model generate correct outputs? • Operational validation: Does the model
meet the end-user needs and criteria? This paper presents both conceptual and pragmatic findings to overcome the lack of suitable representation of interactions in large-scale MABS. We introduce the concept of ‘conversation’ as a set of sub-conversations, metadata and knowledge on conversations, and optional messages identifiers.
Conversation can thus be the basis for new interpretation tools more suitable for overviewing large MABS than tools based on message enumeration. Indeed, information is presented at a higher level and is more condensed. We thus propose the following tools based on conversations: (i) Conversation maps, to give an overview of all conversations that occur in a simulation; (ii) Conversation wires, to give conversation views at intermediate scales; (iii)
Conversation sequence diagrams, giving the
chronological details of all elementary messages of a conversation. These tools can be customized according to the user’s criteria.
We illustrate the use of such concepts and tools on a real simulation experiment: the organization of organic matter transfers at a territory scale in the Reunion Island simulated with an agent-based model called Biomas. These concepts and tools for overviewing the interaction among agents are useful at every phase of the modelling cycle as they help explore simulation outputs at various scales. In research and learning activities they help identify more precisely unsatisfactory situations (e.g., failure of negotiations between agents) and improve simulation scenarios. They thus provide facilities for analysing MABS at various levels, allowing one to explain macro-level phenomena in terms of local underlying agents’ interactions. Our approach is thus a step towards answering the two issues inherent in bottom-up approaches as in MABS: identify global phenomena and local interactions accounting for them.
1. INTRODUCTION
Multi-Agent Based Simulation (MABS) is a suitable approach for bottom-up models that put into play different agents interacting in a common environment. However, the large number of agents in a simulation raises two questions: How to understand emerging global phenomena? How to explain these phenomena from local interactions among agents? To answer these questions, Shneiderman (1996) argues that information (i.e. simulation results) has to be processed and presented to the end-user in the following order: overview first, then zoom and filter, finally give details on demand. In MABS, representations do exist to visualise agents and their environment. However, to our knowledge, generic representations to visualise agent interaction at a macro level are lacking. Moreover, simulation models are getting larger and more complex: visualizing and understanding agent interaction is far beyond the ability of message tracing tools. Hence, we propose a new representation level of interactions focusing on the concept of “conversation”. Based on this, we have developed generic tools to ease the analysis of the huge set of interaction results produced during a simulation. These tools allow the global conversational activity of the system to be represented, based on various semantic criteria: temporal, conversational, topical... depending on the questions that are to be answered by simulation.
We first present the current state of the art of MABS interaction analysis in section 2. Then we present an observation model of MABS based on the concept of conversation in section 3. Finally, in section 4, we illustrate on a real large-scale simulation example (material flow management at a territory scale) how tools based on the conversation concept help facilitate MABS analysis.
2. TOOLS FOR ANALYSING AGENT INTERACTION
The need for understanding global phenomena and local interactions that produce these phenomena arises at every phase of the modelling cycle in order to answer the questions that should be asked according to Rykiel (1996):
• Conceptual validity: Is the representation reasonable for the model’s intended use? • Computerized model verification: Does
the model generate correct outputs? • Operational validation: Does the model
meet the end-user needs and criteria?
Satisfying this need for all modelling phases requires the user to be provided with observation functionalities for the whole observation range, from global overviews to specific details. Also, Grimm (2002) underlines the need for such functionalities in visualization tools for model understanding purposes as well as to share the model with a community.
Representing agent interactions in a suitable way is fundamental to understanding the whole simulation. Indeed, in bottom-up approaches such as in MABS, the evolution of the whole system is driven by low-level interactions between entities (agents), in contrast with classical lumped models providing high-level, top-down descriptions of phenomena.
We argue that existing representations that are used to analyse interactions based on message tracing are too limited in the case of large-scale simulations. Indeed, the most common output for message-based interaction analysis is visualizing message logging e.g., giving the sequential list of all messages chronologically ordered. Another representation is a graphical and chronological view of messages exchanged between agents, such as the sequence diagrams of the Agent-based Unified Modeling Language (AUML), formalised by the Foundation for Intelligent Physical Agents (FIPA) and described in Huget et al. (2003). Payet et al. (2005) also propose a similar “message tracer” for filtering and displaying interactions between agents. All these tools are message-centred, as they consider the message as the basic unit of information to be displayed. If these tools are suitable for details-on-demand purposes as they deliver local information, they are not suitable for giving a global overview of interactions in the whole system.
Although much research effort has gone into improving inter-agents communication (see Pasquier et al., 2004, for a state-of-the-art of inter-agent dialogue), little research focuses on how to observe these interactions from an external end-user point of view.
Botia et al. (2006) analyse interactions between intelligent agents to debug MABS by identifying message groups thanks to data mining. This may be useful in order to identify incorrect interactions in the debugging process, but it does not suffice for visualizing conversations and exploring interactions. It is the same case as statistics: characteristics extracted from a set of data may be necessary, but give few indicators sufficient for a finer analysis or exploration, i.e. navigating
between overview and details-on-demand information.
3. CONVERSATION-BASED OBSERVATION MODEL 3.1. The concept of conversation
As previously said, the basic information unit commonly used in existing tools is the “message”. It represents a piece of communication between a sender and a receiver. However, this information level is very low. We argue that a higher level of information is necessary to analyse large-scale simulations. So, we propose a new representation called the “Conversation-based observation model” (see Ralambondrainy and Courdier, 2007, for details). A “conversation” is a set of messages exchanged between agents, assembled according to a given logic with additional data characterizing this conversation. The new unit of information used for representing interaction is thus the conversation, although the message set still remains at the lower level for finer investigations. As a consequence, display and visualization can be based on a smaller, more condensed, information set composed of conversations instead of messages, making it easier for the observer to get interaction overviews.
A conversation is formally defined with the Extended Backus Norm Form (EBNF), as follows (see Scowen, 1993, for details):
<conversation> =({<conversation>}, {<metadata>},{<knowledge>}, [{<message-id>}]);
where parentheses “()” indicate a group; curly brackets “{}” indicate possibly repeated elements; angle brackets ”<>” indicate principal concepts; square brackets “[]” indicate optional elements. A conversation is composed of four parts: (1) A set of sub-conversations possibly empty; (2) Synthetic and objective information called “Metadata” characterizing the conversation (e.g., number of messages, conversation purposes, nature of the participants,…); (3) Specific synthetic information called “Knowledge” (i.e., semantic interpretation depending on the observer’s point of view); (4) Message identifiers called “Message-id” keeping a link to each message in the conversation.
This recursive definition is flexible and has two advantages. First, a conversation can be split into smaller parts, thus giving more details on its inner structure. Second, a set of conversations can be synthesized to represent a higher-level structure:
for example, all conversations made by a given agent to achieve its goal can be assembled into a single, high-level conversation. These structures can thus be considered as an interpretation step.
3.2. Architecture of a MABS observation platform
A computerized agent model can be implemented using a MABS platform such as Swarm, described by Minar et al., (1996), or Repast, described by North et al. (2006). The goal of such platforms is both to run the model and visualize the outputs produced by simulation. As visualization often involves advanced data processing independent of the simulation process itself, we argue that the visualization process should be separated from the simulation process.
Separating these two processes has three main advantages. Firstly, the simulation process can be simpler, as no observation task must logically interfere with simulation. Secondly, a separated observation platform can be used with any other simulation platforms. Thirdly, observation processes can be run either during or after a simulation. We propose the generic architecture displayed in Figure 1 to manage conversations and produce pertinent representations of the information suitable for interpretation.
Figure 1. Generic architecture of a MABS
observation platform.
Simulation Platform
Observer
The observation tasks include perception, processing, storage and rendering of conversation information. First, the observation platform perceives the basic outputs from the simulation process, such as the message details. Then, the processing task computes the information needed to identify and characterize conversations (i.e. metadata and knowledge). Processing can be done through pattern recognition (e.g., with Petri-nets as in Botia et al., 2006) or message content analysis. After identifying and characterizing conversations, the computed data are delivered to the end-user. This delivery can consist of diagrams displayed on screen or other outputs that can be used for further
Perception Processing Storage Rendering Observation Platform Platform Task Data transfer
analysis by other specialized tools. Computed data can also be stored in a database for further use.
4. CONVERSATION ANALYSIS IN LARGE-SCALE SIMULATIONS
4.1. Biomas: simulation of organic matter flows
In order to help agricultural stakeholders reflect on their management practices and environmental impacts, we have developed a multi-agent model called Biomas (Courdier et al., 2002). It allows us to simulate flows of organic matter (OM) amongst a set of farms located within a territory. Our aim is to provide, by the means of simulation, agricultural stakeholders with support to evaluate various OM flows management options.
We have applied Biomas to deal with the case of Le Tampon heights, in the southern part of the Reunion Island, where significant and diversified livestock farming (pig, poultry, dairy, suckling and fattening cattle) is found together with diversified cropping systems (sugarcane, grasslands, market gardening,…). Although the balance between the supply of OM by livestock farms (i.e., effluents) and the demand by crops is globally equilibrated at the scale of the whole district, some local disequilibria do exist at the scale of individual farms. This allows us to consider transferring effluents from the farms with surpluses to those lacking OM, in order to better take advantage of their fertilizing value while avoiding pollution risks by improving the effluents’ repartition over the whole district.
The simulation scenarios that must be addressed put into play hundreds of agents (farmers, livestock enterprises, crops, means of transportation, groups of farmers). These agents of hybrid reactive/cognitive nature have the distinctive feature of being merely different one from another. Thus, each simulation gives rise to many intricate interactions that are particularly complex to analyse: these agents exchange more than 50,000 messages for each simulated year. In order to explain this system’s global behaviour, it is necessary to be capable of monitoring large-scale interactions between agents, not only during the phase of model verification, but also for the acceptance by end-users of conclusions drawn from the simulations.
4.2. Typical conversation in Biomas
The agents are autonomous and try individually to achieve their goals. We have three main categories of agents: OM producers (OMP), mainly livestock farms; OM consumers (OMC), mainly crops; and
OM transporters (OMT). The goal of OMP agents is to get rid of their effluents (slurry, manure) without polluting their environment; OMC agents aim to get enough OM to satisfy their fertilization needs; OMT agents aim to transport OM efficiently to maximize their deliveries. The model takes into account the OM nitrogen content. The road network is modelled as a set of interconnected road segments. Compatibility between crop types and OM types is given by a table that can be customized by the user. The social network of each farmer agent, reflecting observations drawn from field surveys, is predefined and kept constant during each simulation. Experimenting with changes in these networks and evaluating their impact on the whole-system efficiency can be done in alternative scenarios.
OMP or OMC agents can initiate negotiations with other agents to achieve their goals. A typical successful negotiation conversation is as follows:
1. Critical situation alarm arising in an OMP (resp. OMC) farm: risk of effluent overflow in storages (resp. fertilization needs by crops);
2. Negotiation set-up: an OMP (resp. an OMC) agent proposes (resp. requests) OM to the agents involved in its social network;
3. OM negotiation: matching OM supplies with demands in terms of type and quantity;
4. Transport negotiation with OMT agents: finding a carrier available with adequate capacity;
5. Actual OM deliveries.
Negotiations can fail due to several, possibly combined, reasons (see Figure 2): OM type is not compatible with crops; OMP supply is not synchronized with OMC needs; no means of transportation is available; agent social network is not appropriate or incompletely specified, e.g. because data are lacking in the database used to parameterise the model.
4.3. Conversation analysis for global overview
To analyse these interactions, we have implemented conversation concepts in a post-simulation processing tool developed in Java and called CONAN (Conversation Analyser). It partially uses the Prefuse Library described in Heer et al. (2005) and the JfreeChart library for display.
The analysis of interaction using CONAN reduces the quantity of information to nearly 3,000
conversations from a set of 50,000 elementary messages. An example of conversation analysis based on the success/failure criteria listed above, computed by CONAN, is given in Figure 2. Only 6 percent of all conversations are successful. This is an example of an unsatisfactory management scenario.
Figure 2. Diagram overviewing success/failure
cases in agents negotiations with Biomas.
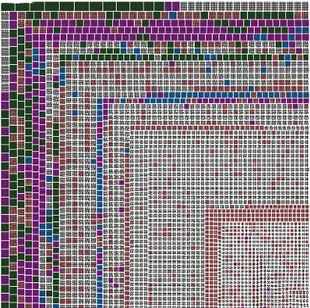
Figure 3. A Conversation map shows all
conversations as coloured rectangles classified according to whether the corresponding negotiations succeeded (green) or failed (red). A “Conversation map” such as that in Figure 3 gives an overview of all conversations that occurred in a simulation classified according to their result and size. Each conversation is represented by a rectangle whose size is proportional to the size of the conversation (i.e., the number of messages it contains). Its colour indicates the negotiation result: successful conversations are in green, conversations having failed in red.
The conversation map classifies all rectangles in a contiguous space: the biggest conversations are placed at the top left corner, the smallest are at the bottom right corner. Successful conversations are among the biggest: as corresponding negotiations proceed to a conclusion, they contain more messages compared with conversations that are interrupted earlier in the negotiation process.
Figure 4. Variant of the conversation map of Fig.
3 distinguishing the causes of negotiation failures. Figure 4 shows another conversation map similar to that in Figure 3 except that conversations having failed are displayed with different colours according to the cause of negotiation failure: e.g., bad synchronization is denoted by white rectangles; lack of transport by blue ones. All successful or failed conversations, along with their main causes, can thus easily be identified using conversation maps. Also, these views provide the user with an entry point to each particular conversation: more precise information is available on demand with a simple click on each rectangle. Such a representation facilitates user browsing and exploration activities highlighted by Knight et al. (1999) in the field of software visualisation.
4.4. Conversation analysis for exploration at intermediate scales
To get more detailed information on conversations, we use the Conversation wire view. This makes it possible for the end-user to explore a subset of conversations semantically linked and ordered depending on users’ choices. Each conversation is represented by a “ball” (Figure 5). The size of the ball represents the conversation “size” (i.e., its number of messages). Its colour represents its category. The balls are linked by a “wire” indicating an order between these conversations.
Among other possibilities, we have chosen to order the conversations by their start date. The horizontal and vertical position of each conversation in the display is obtained by a dynamic repulsion force associated with each “ball”.
Figure 5. A Conversation wire shows a subset of
conversations semantically linked and ordered. In the example given in Figure 5 we see that green balls are generally bigger that brown ones: conversations initiated by crop farmers (in green) need more interaction than conversations initiated by livestock farmers (in brown). Moreover, there is a succession of green conversations in the first part (bottom left part of the display) then followed by a green/brown alternation of crop farmers and livestock farmers conversations (upper and right parts) corresponding to different manure spreading periods on crops. As with conversation maps, conversation wires are also starting points to get more detailed information on conversations: sub-conversation list, metadata and knowledge on a particular conversation and the Conversation
sequence diagram of all messages exchanged
during this conversation (see Figure 6).
5. CONCLUSIONS
This paper has presented both conceptual and pragmatic findings to deal with the lack of suitable representation of interaction in large-scale MABS. We introduced the concept of conversation as a set of sub-conversations, metadata, knowledge and optional message identifiers. Thanks to this concept and the post-simulation process developed in CONAN, we get a better understanding of complex simulation outputs, over the whole
modelling cycle and for every scale of analysis from global overview to details.
Figure 6: A Conversation sequence diagram lists
chronologically (top to down) all messages exchanged between agents in any conversation. Conversations can thus be the basis for new tools better suited to large-scale MABS analysis than tools based on elementary messages. Therefore we proposed: (1) Conversation maps, to give an overview of all conversations that occur in a simulation; (2) Conversation wires, to give views of the same conversation at lower scales; (3)
Conversation sequence diagrams, giving the
chronological details of all elementary messages of a conversation. Displays and renderings provided by these tools can be customized according to user’s criteria. This is in keeping with the approach advocated by Shneiderman (1996) for visualization systems: (i) overview, (ii) zoom-and-filter, (iii) details-on-demand.
We have illustrated the interest of such concepts and tools for analysing the outputs of a real simulation experiment: organic matter transfer at a territory scale involving the interaction among hundreds of agents. They have proved useful at every phase of the modelling cycle as they facilitate the precise identification of simulated situations, improvement of simulation scenarios, and exploration of interaction results at different scales. They help MABS analysis by allowing the observer to navigate between macro and micro observation levels. These are thus a step towards
answering the two issues inherent to bottom-up approaches such as MABS: identify global phenomena and explain them in terms of underlying interactions.
Future work will primarily focus on improving the capacity of conversation interpretation in CONAN in a way similar to what is done on the semantic web (Pinheiro and Moura, 2004). Our idea is to use conversation-generic and domain-specific ontologies together with an expert engine in order to characterize semantically all conversations in a MABS.
ACKNOWLEDGMENT
This research is supported by a grant from the regional council of the Reunion Island.
6. REFERENCES
Botia, J.A., J.M. Hernansaez, and A.F. Gomez-Skarmeta (2006), On the application of clustering techniques to support debugging large-scale multi-agent systems, paper presented at ProMAS’06, 4th Programming Multi-Agent Systems Workshop, Hakodate, Japan, May 9.
Courdier, R., F. Guerrin, F.H. Andriamasinoro, and J.-M. Paillat (2002), Agent-based simulation of complex systems: Application to collective management of animal wastes,
Journal of Artificial Societies and Social Simulation, 5(3).
Grimm, V. (2002), Visual debugging: a way of analysing, understanding and communicating bottom-up simulation models in ecology, Natural resource
modelling, 15(1), 23-38.
Heer, J., S.K. Card, and J.A. Landay (2005), Prefuse: a toolkit for interactive information visualization, paper presented at SIGCHI Conference on Human Factors in Computing Systems, Portland, OR, USA, April 2-7.
Huget, M.P., B. Bauer, J. Odell, R. Levy, P. Turci, R. Cervenka and H. Zhu (2003), FIPA Modeling: interaction diagrams, Foundation for Intelligent Physical Agents (FIPA), Working Draft, version 03-07-02,
http://www.auml.org/auml/documents/. Knight, C., and M. Munro (1999), Comprehension
with[in] virtual environment visualisations, paper presented at IWPC’99 IEEE 7th
International Workshop on Program Comprehension, Pittsburgh, PA, USA, May 5-7.
Minar, N., R. Burkhart, C. Langton and M. Askenazi (1996), The Swarm simulation system: A toolkit for building multi-agent simulations, Working Paper 96-06-042, Santa Fe Institute, Santa Fe, AZ, USA. North, M.J., N.T. Collier and J.R. Vos (2006),
Experiences creating three implementations of the Repast agent modeling toolkit, ACM
Transactions on Modeling and Computer Simulation, 16(1), 1-25.
Pasquier, P. and B. Chaib-Draa (2004), Modèles de dialogues entre agents cognitifs : un état de l'art, Cahiers Romans de Sciences
Cognitives, 1(4), 79-138.
Payet, D., J.-M. Médoc, T. Ralambondrainy, F. Guerrin and R. Courdier (2005), Observation and analysis tools for multi-agent simulations, Experience from the Geamas/Biomas platform, paper presented at CABM-HEMA-SMAGET Joint Conference on Multi-Agent Modelling for Environmental Management, Bourg-Saint-Maurice, France, March 21-25.
Pinheiro, W.A. and A.M.C. Moura (2004), An ontology-based approach for semantic search in portals, paper presented at DEXA 2004, 15th International Workshop on Database and Expert Systems Applications, Zaragoza, Spain, 30 August-3 September. Ralambondrainy, T. and R. Courdier (2007),
Synthesizing agent interactions through the concept of conversation, paper presented at SCSC'07 Summer Computer Simulation Conference, San Diego, CA, USA, July 15-18.
Rykiel, E.J.J. (1996), Testing ecological models: the meaning of validation, Ecological
Modelling, 90, 229-244.
Scowen, R.S. (1993), Extended BNF - A generic base standard, paper presented at Software Engineering Standards Symposium Brighton, UK.
Shneiderman, B. (1996), The eyes have it: a task by data type taxonomy for information visualizations, paper presented at 12th IEEE Symposium on Visual Languages, Boulder, Colorado, USA, September 3-6.