Analysis and Comparison of the Biotech Startup Ecosystem
in the United States and Japan
by
Ayano Kagami
B.S. in Biophysics and Biochemistry The University of Tokyo, 2005 M.S. in Biophysics and Biochemistry
The University of Tokyo, 2007 Ph.D. in Biophysics and Biochemistry
The University of Tokyo, 2011
Submitted to the System Design and Management Program in Partial Fulfillment of the Requirements for the Degree of
Master of Science in Engineering and Management at the
Massachusetts Institute of Technology June 2019
2019 Ayano Kagami. All Rights Reserved.
The author hereby grants to MIT permission to reproduce and to distribute publicly paper and electronic copies of this thesis document in
whole or in part in any medium now known or hereafter created.
Signature redacted
Signature of Author:
S
r
a
lystem Design and Management Program May 15, 2019
Certified By:
Signature redacted'
Michael A. Cusumano Sloan Management Review Distinguished Professor of Management Thesis Supervisor
Signature redacted
Accepted By:
MASSACHUSETTS INSTITUTE Joan S. Rubin
OF TECHNOOGY Executive Diretor, System Design and Management Program
Analysis and Comparison of the Biotech Startup Ecosystem in the United States and Japan
by
Ayano Kagami
Submitted to the System Design and Management Program on May 15, 2019, in partial fulfillment of the requirements for the degree of
Master of Science in Engineering and Management
ABSTRACT
Many regions and cities, including in Japan, are interested in developing a biotech startup ecosystem. Therefore, there are several strategies and policy instruments in Japan to promote medical research and development and collaboration among universities and industries, and to foster entrepreneurship in Japanese society. However, a startup ecosystem is a complicated system because there are many stakeholders and many ways of interactions among them. For this reason, it is assumed that the coordination of many factors, such as governments' policies and the academic and industrial environment, is required to develop the ecosystem. The Greater Boston area, where MIT is located, is a world-renowned biotech cluster. Many countries and cities have been trying to imitate this cluster, but just copying the ecosystem might not work in other cities because the environment surrounding the ecosystem is different from cluster to cluster.
In this study, we analyze and compare the biotech startup ecosystems in the U.S. (Greater Boston and San Francisco Bay Area) and Japan (Tokyo (Kanto region) and Kyoto (Kinki region)) in order to understand the key factors required for developing the ecosystem and to get insights for developing an ecosystem in Japan. We also analyze universities locating within these areas from the standpoint of the interface machinery between academic research and industry. In the analysis, we compare the stakeholders and their network in each cluster and explore the advantages and challenges of Japanese clusters. For universities, we also compare the system of managing the intersection of academic researchers and industries in each university and explore the functions and features of offices involved in the system.
The results of the analysis suggest that the Japanese biotech startup ecosystems have several challenges: the weakness of the network among stakeholders and of the support system for startups; the low level of entrepreneurship and of opportunities to foster it; and the limitation in the capital available. These challenges exist even though there is strong support from the governments and there are well-organized systems in universities for supporting not only collaboration with industry but also startups and student entrepreneurship. Therefore, taking advantage of the system in universities and utilizing them as the community and/or platform for stakeholders in the ecosystem, including the promotion of entrepreneurial education, might help Japanese clusters to develop successful biotech startup ecosystems.
Thesis Supervisor: Michael A. Cusumano
Acknowledgements
First of all, I would like to thank Prof. Michael A. Cusumano, my thesis supervisor. His exact advice and wealthy knowledge, especially derived from his experience as Vice President and Dean at the Tokyo University of Science helped me a lot in tackling this theme and giving my ideas into shape. It was a precious time for me to work with him. I express my gratitude here.
I would also like to thank the Japanese community in the Greater Boston Area,
especially whom I met through my journey for the study. Their knowledge and experience in the biotech ecosystem, their passion to deliver technology to the society, and their ugly on Japanese environment encourage me to push forward on this study. There are many people who help me to shape the study through discussions. I want to express my appreciation especially to my supervisor during the intern at BioInnovation Labs, LLC (BioLabs) in the summer 2018, Dr. Jean-Jacques Yarmoff.
I learned a lot from the discussions with him about the biotech ecosystem in
Boston/Cambridge, France, and Japan. I also want thank Dr. Erin L. Scott and Ms. Margaret Chiappetta for having discussions at the beginning of the study. Mr. Takuro Yoshimoto, my college in MEXT, provided me the information on OECD's research related to university-industry collaboration and the suggestions for policy analysis. Additionally, I would also like to thank my friends in MIT. They inspired me a lot and made my life in MIT priceless not only in the classrooms but also in other activities.
I could not be here in MIT without the sponsorship from Ministry of Education,
Culture, Sports, Science and Technology. I appreciate their support and I would like to share and make use of the experience in MIT and the results of this study after I back to the office.
Finally, I need to thank my family in Japan; my father, mother, sister, brother and two grandmothers. I really appreciate their understanding and tremendous supports, even when they had difficult times.
Table of Contents
1. IN TR O D U CTIO N ... 13
2. RESEARCH Q UESTIONS... 17
3. LITERATURE REVIEW ... 19
3.1 INNOVATION ECOSYSTEM AND POLICY ... 19
3.2 REGIONAL CLUSTERS AND BIOTECH INDUSTRIES ... 23
3.3 M IT APPROACH TO INNOVATION ECOSYSTEM... 25
3.4 KNOWLEDGE TRANSFER FROM ACADEMIA TO INDUSTRIES... 29
4. DEFINITION AND SPECIFICITY OF THE BIOTECH STARTUP ECOSYSTEM... 32
4.1 DEFINITION OF THE BIOTECH STARTUP ECOSYSTEM... 32
4.2 SPECIFICITY AND TRENDS IN BIOTECH INDUSTRIES... 32
4.3 BIOTECH STARTUP'S PROCESS FROM START TO EXIT ... 34
5. METRICS IN COMPARING THE BIOTECH STARTUP ECOSYSTEM... 38
5.1 STAKEHOLDERS IN THE BIOTECH STARTUP ECOSYSTEM ... 38
5.2. INNOVATION CAPACITY AND ENTREPRENEURSHIP CAPACITY IN A BIOTECH ECOSYSTEM ... 41
6. REGIONS AND UNIVERSITIES ANALYZED IN THIS RESEARCH ... 46
6.1 SELECTION OF REGIONS IN THE U.S. AND JAPAN ... 46
6.2 ADMINISTRATIVE INFORMATION AND BASIC DEMOGRAPHICS OF CLUSTERS ... 50
7. COMPARISON OF STAKEHOLDERS IN THE U.S. AND JAPANESE ECOSYSTEM ... 55
7.1 ANALYSIS AND COMPARISON OF STAKEHOLDERS... 55
7.2 ANALYSIS OF STAKEHOLDERS' NETWORK IN THE U.S. AND JAPANESE CLUSTERS ... 108
8. FUNCTION AND COMPARISON OF UNIVERSITIES IN THE ECOSYSTEM... 118
8.1 OVERVIEW OF UNIVERSITIES' FUNCTION IN THE ECOSYSTEM... 118
8.2 FUNCTIONS OF UNIVERSITIES IN THE U.S. ECOSYSTEM... 119
8.3 PERFORMANCE OF JAPANESE UNIVERSITIES IN THE ECOSYSTEM... 127
8.4 COMPARISON OF FUNCTIONS OF UNIVERSITIES IN THE U.S. AND JAPAN ... 132
9. DISCUSSION FOR POLICY IMPLEMENTATION ... 142
9.1 FINDINGS FROM THE STAKEHOLDERS AND ITS NETWORK ANALYSIS... 142
9.2 FUNCTIONS OF A UNIVERSITY IN A BIOTECH STARTUP ECOSYSTEM ... 148
9.3 ADVANTAGE AND CHALLENGE OF JAPANESE BIOTECH STARTUP ECOSYSTEM ... 152
9.4 POLICY RECOM M ENDATIONS ... 157
9.5 INSIGHTS FOR RESEARCH QUESTIONS ... 160
9.6 F U TU R E W O RK S ... 164
10. CO N C LU SIO N S... 167
11. D A TA SO U R CE ... 169
List of Figures
FIGURE 1 FIVE STAKEHOLDERS IN INNOVATION ECOSYSTEM FROM MIT'S MODEL ... 26
FIGURE 2 MIT's MODEL FOR INNOVATION-DRIVEN ENTREPRENEURSHIP SYSTEM ... 27
FIGURE 3 WORLDWIDE PRESCRIPTION DRUGS & OTC PHARMACEUTICAL SALES BY CATEGORY ... 3 4 FIGURE 4 FLOW CHART OF TASKS IN A BIOTECH STARTUPS BUSINESS ... 35
FIGURE 5 STAKEHOLDER VALUE NETWORK SURROUNDING ENTREPRENEURS ... 39
FIGURE 6 STAKEHOLDER VALUE NETWORK OF THE INNOVATION ECOSYSTEM... 39
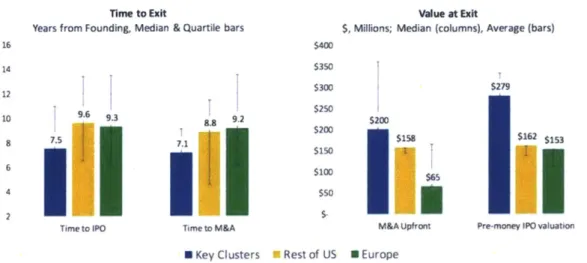
FIGURE 7 EXIT TIME AND VALUE AT EXIT BY REGION (AVERAGE: 2013-2016)... 47
FIGURE 8 DOMESTIC SPENDING ON R&D BY COUNTRIES (2000-2017)... 51
FIGURE 9 PERCENTAGE OF GROSS DOMESTIC EXPENDITURE ON R&D FINANCED BY THE G OV ERN M EN T ... 52
FIGURE 10 NUMBER OF RESEARCHERS PER 1000 EMPLOYED... 53
FIGURE 11 NEW ACTIVE SUBSTANCE (NAS) MEDIAN APPROVAL TIME FOR 6 REGULATORY A UTHORITIES IN 2008-2017 ... 70
FIGURE 12 RATION OF RISK CAPITAL BY THE STARTUPS' STAGE... 74
FIGURE 13 TRENDS IN INVESTMENT OF UNIVERSITY AFFILIATED STARTUPS ... 77
FIGURE 14 ALLOCATION OF RISK CAPITAL BY REGION 2017 (RATIO IN THE AMOUNT OF RISK CA PITA L)... 78
FIGURE 15 ALLOCATION OF RISK CAPITAL BY REGION 2017 (RATION IN THE NUMBER OF DEALS) ... 7 8 FIGURE 16 WORLD SHARE OF PAPERS IN MAJOR 7 COUNTRIES (ALL FIELDS, IN TOTAL NUMBERS, TOP 10% PAPERS AND TOP1% PAPERS))... 81
FIGURE 17 TREND OF TEA IN FIVE MAJOR COUNTRIES... 91
FIGURE 18 PERCENTAGE OF OPENING OR CESSATION OF BUSINESS... 92
FIGURE 19 STAKEHOLDER VALUE NETWORK IN THE BIOTECH STARTUP ECOSYSTEM... 109
FIGURE 20 DSM FOR STAKEHOLDERS IN BOSTON/CAMBRIDGE CLUSTER ... 110
FIGURE 21 DSM FOR STAKEHOLDERS IN JAPANESE CLUSTERS ... 115
List of Tables
TABLE 1 TOP 10 BIOPHARMA CLUSTERS IN 2018 BY REGION... 25
TABLE 2 DEFINITION OF FIVE COMPONENTS OF I-CAP AND E-CAP ... 28
TABLE 3 MEASUREMENTS FOR 5 INPUTS IN I-CAP AND E-CAP... 28
TABLE 4 TYPES OF CHANNELS IN KNOWLEDGE TRANSFER AND ITS DEFINITION ... 29
TABLE 5 THE TASK OF A BIOTECH STARTUPS ... 35
TABLE 6 SUPPLY AND DEMAND OF SIX STAKEHOLDERS IN THE ECOSYSTEM ... 38
TABLE 7 LIST OF STAKEHOLDERS AS AN ORGANIZATION ... 40
TABLE 8 METRICS FOR CAPTURING I-CAP IN THE BIOTECH ECOSYSTEM ... 42
TABLE 9 METRICS FOR CAPTURING E-CAP IN THE BIOTECH ECOSYSTEM... 42
TABLE 10 METRICS FOR EVALUATING I-CAP AND E-CAP OF SUPPORTING ACTIVITIES ... 45
TABLE 11 NUMBER OF UNIVERSITIES IN TOP 100 IN THE WORLD UNIVERSITY RANKINGS 2019 BY STA T E (U S )... 4 7 TABLE 12 UNIVERSITIES RANKED IN TOP 100 (CALIFORNIA)... 47
TABLE 13 UNIVERSITIES RANKED IN TOP 100 (MASSACHUSETTS)... 48
TABLE 14 LOCATION OF HEADQUARTERS OR BUSINESS OFFICES... 48
TABLE 15 LOCATION OF UNIVERSITIES IN TOP 20 BY REGIONS AND PREFECTURES... 49
TABLE 16 UNIVERSITIES RANKED IN TOP 20 (KANTO)... 49
TABLE 17 UNIVERSITIES RANKED IN TOP 20 (KINKI) ... 50
TABLE 18 AREA, GDP AND POPULATION OF EACH COUNTRY AND REGION... 51
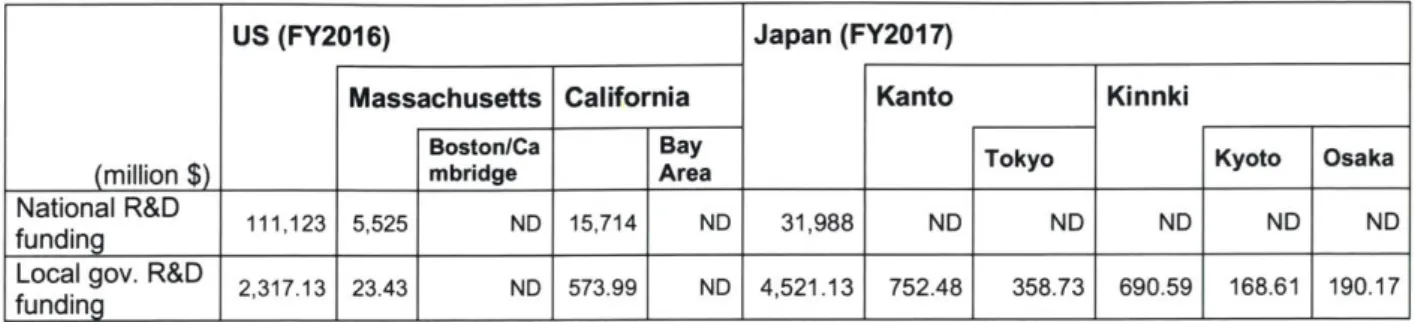
TABLE 19 FUNDING ON R&D BY FEDERAL/NATIONAL GOVERNMENT AND LOCAL GOVERNMENTS ... 5 3 TABLE 20 TOP 5 STATES AWARDED BY NIH FUNDING IN FY2018... 56
TABLE 21 TOP10 UNIVERSITIES FUNDED BY AMED IN FY2017... 60
TABLE 22 TOP 11 UNIVERSITIES FUNDED BY KAKENHI IN FY2017... 61
TABLE 23 LIST OF THE GOVERNMENT FUNDING PROGRAMS AND OTHER POLICIES FOR FOSTERING INNOVATION ECOSYSTEM... 63
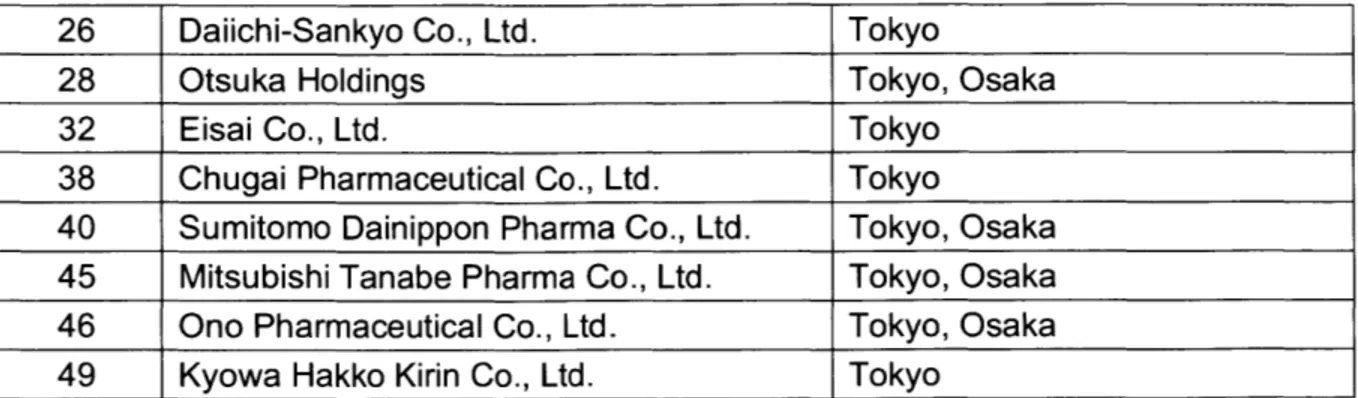
TABLE 24 NUMBER OF COMPANIES IN TOP 50 AND TOP 20 PHARMACEUTICAL COMPANIES BY CO U N TRIES ... 7 1 TABLE 25 LOCATION AND THE TYPE OF FACILITIES IN THE CLUSTERS BY TOP 20 COMPANIES. 71 TABLE 26 LOCATION OF HEADQUARTERS AND R&D FACILITIES OF TOP 10 JAPANESE PHARM ACEUTICAL COM PANIES... 73
TABLE 27 NUMBER OF UNIVERSITIES IN TOP 50 IN THE WORLD UNIVERSITY RANKING 2019 BY C O U N T R Y ... 7 9 TABLE 28 RANKING OF UNIVERSITIES IN THIS RESEARCH ... 80
TABLE 29 SHARE OF PAPERS IN CLINICAL RESEARCH AND BASIC LIFE SCIENCE (IN TOTAL NUMBER OF PAPERS AND TOP 10% PAPERS (BASED ON THE FRACTIONAL COUNTING M ETH O D ))... 8 1 TABLE 30 NUMBER OF NOBEL PRIZE LAUREATES IN NATURAL SCIENCES BY COUNTRY ... 82
TABLE 31 NUMBER OF UNIVERSITIES, GRADUATE STUDENTS IN S&E AND DOCTORATE RECIPIENTS IN S& E BY CLUSTERS... 83
TABLE 32 FINANCIAL AND ADMINISTRATIVE DEMOGRAPHICS OF UNIVERSITIES... 83
TABLE 33 RESEARCH FUNDING BY UNIVERSITIES ... 85
TABLE 34 NUMBER OF RESEARCHERS AND AWARDS ... 86
TABLE 35 NUMBER OF HCR OF UNIVERSITIES... 86
TABLE 36 NUMBER OF PATENTS AND THE TOTAL REVENUE FROM PATENTS BY UNIVERSITIES 87 TABLE 37 SELF-PERCEPTION AND THE SOCIETAL VALUE ABOUT ENTREPRENEURSHIP ... 90
TABLE 38 NUMBER OF UNIVERSITY-AFFILIATED STARTUPS ... 93
TABLE 39 LIST OF SUPPORTING ORGANIZATIONS AND THEIR SERVICES ... 93
TABLE 40 SUMMARY OF THE SIX STAKE HOLDERS IN CLUSTERS... 102
TABLE 41 ROLES OF THE NATIONAL/LOCAL GOVERNMENTS IN THE BIOTECH STARTUP E CO SY STEM ... 103
TABLE 42 REQUIRED TASK AND AVAILABILITY FOR A BIOTECH STARTUP IN BOSTON/CAMBRIDGE C LU ST E R ... 111
TABLE 43 RESOURCES FROM UNIVERSITIES TO THE ECOSYSTEM... 119
TABLE 44 ORGANIZATIONS AND SYSTEMS RESPONDING TRANSFERS FROM UNIVERSITIES TO THE E CO SY STEM ... 119
TABLE 45 ENTREPRENEURSHIP OPPORTUNITY IN UNIVERSITIES... 121
TABLE 46 FUNCTION OF INDUSTRY RELATED OFFICES IN FOUR US UNIVERSITIES ... 124
TABLE 47 LIST OF STUDENT CLUBS... 126
TABLE 48 ENTREPRENEURSHIP OPPORTUNITIES IN JAPANESE UNIVERSITIES... 128
TABLE 49 STUDENT ORGANIZATION RELATED TO ENTREPRENEURIAL ACTIVITY IN JAPANESE U N IV ER SITIES ... 129
TABLE 50 FUNCTION OF INDUSTRY RELATED OFFICES IN FOUR JAPANESE UNIVERSITIES... 131
TABLE 51 NUMBER OF RESEARCHERS PER INDUSTRY-ACADEMIA MANAGEMENT OFFICER BY U N IV ER SITIES ... 135
TABLE 52 ENTREPRENEURIAL CLASSES PER STUDENT BY UNIVERSITIES... 136
TABLE 53 SWOT ANALYSIS OF STAKEHOLDERS IN JAPANESE ECOSYSTEM ... 152
List of Acronyms
AMED Japanese Agency for Medical Research and Development
CVC Corporate Venture Capital
GEM Global Entrepreneurship Monitor
I-Cap Innovation Capacity
IDE Innovation Driven Enterprise
INCJ Innovation Network Corporation of Japan
IP Intellectual Property
JETRO Japan External Trade Organization
JST Japan Science and Technology Agency
E-Cap Entrepreneurship Capacity
FDA the US Food and Drug Administration
METI Ministry of Economy, Trade and Industry
MEXT Ministry of Education, Culture, Sports, Science and Technology
MHLW Ministry of Health, Labour and Welfare
NEDO New Energy and Industrial Technology Development Organization
NIH National Institute of Health
NSF National Science Foundation
OECD Organization for Economic Cooperation and Development
PMDA the Japan Pharmaceuticals and Medical Devices Agency
R&D Research and Development
SME Small/medium-sized Enterprises
SME The Small and Medium Enterprise Agency
TLO Technology Licensing Office
Currency exchange rates used in this study
(OECD.Stat (https://stats.oecd.org), Exchange rates, period-average)
Year Yen/$ 2011 79.807 2012 79.790 2013 97.596 2014 105.945 2015 121.004 2016 108.793 2017 112.166 2018 110.423
1. Introduction
As a country which lacks natural resources, Japan has been allocating a significant amount of budget to science and technology research and development (R&D) both in
the government and in industry. The number of researchers is in 3rd place in the
world, following the United States and China[1]. Also, sixteen Japanese researchers were awarded Nobel prizes in the natural sciences since 2017 and the number of the
applications to the Patent Cooperation Treaty (PCT) is 3rd, again following China and
the U.S.[2] Thus, there has been a significant amount of research that has great impact not only in academia but also on the society in Japan.
In addition, greater generation of innovation is needed to overcome the long period of economic stagnation and the aging and shrinking population. Given this background, the expectation for healthcare and medical innovation is huge. The needs for innovation are the same in industry because the rapid development of science and technology is forcing them to change their R&D strategy and to shift from in-house R&D to open innovation. Thus, companies have more interest in academic research and collaboration than ever before.
Therefore, many policy initiatives have been undertaken to boost the innovation based on the strength of academic research in Japan. One of them is the promotion of academia-industry collaboration. For this purpose, the Ministry of Education, Culture, Sports, Science and Technology (MEXT) provides funding to universities, industries, and entrepreneurs for fostering collaboration and enabling the smooth transfer of the fruits from academic research to the society. Another policy is the promotion of startup businesses, especially spin-off startups from academic research. To encourage such businesses, the Japanese government provided $1.5 billion (120 billion JPY) in risk capital from the national budget to universities and the Japan Science and Technology Agency (JST) for investing in university spin-off startups in
to solve the problems of an aging society with increasing medical costs, the Act on Promotion of Healthcare Policy was approved in 2014 and a significant amount of budget for medical R&D has been allocated since then. Several local governments, such as Tokyo, Kawasaki, Kyoto, and Kobe, have been investing in efforts to develop biotech ecosystems as a source of economic growth.
Although Japan has risen in the total ranking in the Global Innovation Index and Tokyo-Yokohama came out on top among the top 100 science and technology clusters,
the ranking is 13th among 126 countries[4]. In addition, the ranking is 31st in the
creative outputs, though Japan is at the top in innovation quality[4]. These research results suggest that there is a deficiency in the system which converts the academic knowledge to business or social good, despite the governments' policies.
For comparison, the Greater Boston area is a place where universities, high tech
companies, and startups (especially in biopharmaceutical industries) have
accumulated, and it is one of the U.S,'s top two biotech clusters, along with the San Francisco Bay Area. Thus, an innovation and startup ecosystem has formed in this area. For example, Massachusetts Institute of Technology (MIT) and Harvard University are consistently ranked within top 10 in the several university rankings and Harvard University is top ranked in the number of the highly cited researchers[5]. Five of the top six U.S. hospitals are also in the Greater Boston[6]. Not only top universities and hospitals but also many high-tech companies are located in Cambridge; Google, Amazon, Facebook, and many of the largest pharmaceutical companies, such as Pfizer and Novartis. A large number of entrepreneurs, venture capital firms (VCs) and incubation facilities for startups are also present. In addition, because of historical strength in the biotechnology field and the attraction of top pharmaceutical companies, the Greater Boston area is highly suitable for biopharmaceutical industries. Thus, the biotech startup ecosystem has already formed.
Developing an innovation ecosystem or a startup ecosystem is a complicated process because there are many types of stakeholders and because the environment surrounding stakeholders is different from region to region. In addition, the biotechnology industry is more challenging than other fields because of its high risk and the steep costs. Therefore, comparing the several biotech clusters in the US, including the Greater Boston Area, and the several areas in Japan suggests insights and key actions to develop a biotech startup ecosystem in Japan. In addition, comparison of universities in clusters from the perspective of the functions in the ecosystem might suggest to us how to overcome the challenge in Japanese clusters where there has been difficulty in transforming the achievements in academic research to industries or social good. This is because it is well known that MIT has been playing an important role in forming the ecosystem in Cambridge and also giving tremendous impact to industries by its alumni and researchers.
Therefore, we have analyzed and compared the biotech startup ecosystems in two clusters in the US and two clusters in Japan and also the function of universities in the ecosystem in each region in order to reveal the key actions and insights to develop a successful biotech startup ecosystem in Japanese clusters. In Chapter 1, we provide the motivation and the brief background for the thesis. In Chapter 2, the research questions are discussed for framing the research. In Chapter 3, the backgrounds of policies and the preceding research are reviewed to understand the current environment of the ecosystem and the existing theories related to the innovation and startup ecosystem and the knowledge transfer from academia to industries. In Chapter 4, we discussed and defined the boundary of the biotech startup ecosystem and the specificity of the biotech industry in comparison with other industries. In Chapter 5, the metrics for comparing the biotech startup ecosystem among several cities are discussed and defined. In Chapter 6, the regions and universities we analyze and compare in this research are explored to shed light on the biotech startup ecosystems and to discuss the practical implementation of the desirable policies. In Chapter 7, the stakeholders and their networks in the regions we studied in Chapter
6 are examined and the differences between the U.S. and Japan are explored. In
Chapter 8, the functions of universities in the ecosystem are explored and the differences of the systems in the universities we identified in Chapter 6 are analyzed. In Chapter 9, the findings of the research, the policy recommendation for developing the biotech startup ecosystem in Japan, and future work are discussed.
2. Research Questions
In this section, research questions are discussed to shape the focus of the research. As discussed in the previous section, the purpose of this study is to understand the biotech startup ecosystem for better implementation of Japanese policies and actions. Therefore, the comprehensive question of the research directly comes from the purpose.
Q:
How can we develop a biotech startup ecosystem in Japan?To answer this question, comparing the successful biotech startup ecosystem(s) with the ecosystems in Japan. Thus, the first research question is to examine existing biotech startup ecosystems including the ones which recognized as a successful case and the ones which have been trying to establish in Japan.
Q1:
What are the weakness and strength of the Japanese ecosystem compared with the successful ecosystem in the U.S.?The Q1 is the base for figuring out the weakness and strength of Japanese ecosystems to establish policies for developing them. For this purpose, we analyze two clusters in the United States, Boston/Cambridge and San Francisco Bay Area, which are recognized as top biopharmaceutical clusters in the U.S.[7] and also analyze two clusters in Japan, Tokyo (Kanto area) and Kyoto (Kinki Area), which have been trying to develop the biotech ecosystems. To answer this question, we need to explore two following questions.
Q1-1: What is the key element in the ecosystem and how does it impact on the
ecosystem?
The first sub-question approaches to finding the key element of the ecosystem and the impact given by each element to the ecosystem based on the stakeholder analysis and its network analysis by applying MIT's innovation ecosystem model. The second sub-question is the foundation for answering the Q1 based on the stakeholder analysis of each cluster.
Q2: What is the key action(s) for universities in developing the ecosystem in Japan?
The Q2 gives a focus on one of the stakeholders in the ecosystem. As discussed in the previous section, universities are the sources of cutting-edge technologies and innovation and played an important role in the development of the biotech cluster in Boston/Cambridge[8]. In addition, Budden and Murray (2019) mentioned that universities are often the ideal leader for developing regional innovation ecosystem [9]. Thus, exploring the way to developing the ecosystem in Japan by changing universities might be one of the solutions. To answer this question, the following two questions are needed to be explored.
Q2-1: What are the functions of universities in the ecosystem?
Q2-2: What are differences in universities' function and contribution in the ecosystem
between the U.S. and Japan?
The first sub-question approaches the function of universities in the ecosystem and the second sub-question approaches the difference between universities in the U.S. and universities in Japan. The relationship between academia and industry have been catching the eye of researchers and governments who want to industrialize the results of academic research. However, Japanese universities seem to be not performing well in this context as noted in the previous part. Thus, the comparison of universities' system in the US and Japan from the aspect of their function in the ecosystem will give us insights about the root of the problem.
3. Literature Review
In this section, innovation ecosystem and policy in the U.S. and Japan, the basis of regional clusters and biotech industries, MIT's approach to innovation ecosystem, and the mechanism of knowledge transfer are reviewed, in order to explore the biotech startup ecosystem in the U.S. and Japan in the following sections.
3.1 Innovation ecosystem and policy
(1) Innovation ecosystem and startup ecosystem
Ecosystem is traditionally defined as a biological community of interacting organisms and their physical environment in Oxford English Dictionary. However, its meaning was expanded to the non-biological situation and the word "ecosystem" is now generally used as a complex network or interconnected system as the analogy of the biological ecosystem.
"Innovation ecosystem" is defined as an interconnected set of people and resources (and their physical environment) that provide the context for Innovation Driven Enterprises (IDEs) to start, grow and scale [10]. In this definition, IDEs are startups whose competitive advantage and growth potential is driven by innovation [11]. On the other hand, the World Bank defines in its report the startup ecosystem as follows:
The combination of people, startups at various stages and other stakeholders and organizations supporting or connecting to these startups, interacting in multiple dimensions to create and scale new startup ventures[12].
Thus, if we focus on innovation generated in startups and implemented through the startup ecosystem, there is significant overlap between the innovation ecosystem and the startup ecosystem.
(2) Innovation policy in the U.S.
In The Global Competitiveness Report 2018 (World Economic Forum), the U.S. is
ranked 1st in Business Dynamics and 2nd in Innovation Capacity (1st is Germany).
The score of Business Dynamics is based on the cost and time spend in starting a new business, the attitude toward entrepreneurial risk, companies embracing disruptive ideas, and so on. Innovation Capacity is based on multi-stakeholder collaboration, scientific publications, patent applications, R&D expenditures, buyer sophistication, and so on [13]. Thus, this ranking suggests that the U.S. is a country suitable for innovative business.
Also, it is said, "The United States has long been at the forefront of cutting-edge innovation" in OECD Science, Technology and Industry Outlook 2012. This position is based on the excellent higher education institutions, a large and integrated marketplace, and efficient capital and equity markets [14].
The policy on innovation in the U.S. backs to 1980 when the Bayh-Dole Act and Stevenson-Wydler Technology Innovation Act were established. The Bay-Dole Act is the act for promoting the technology transfer from university to industries and enables entities to apply patents based on research funded by the federal government and to license them to the third party. Because of this act, universities (and inventor) can earn royalty from patents and also are enhanced incentives for technology transfer. As a result, the collaboration between academia and industry, technology transfer and creation of startups have promoted [15].
Stevenson-Wydler Technology Innovation Act was also established in 1980 and determines the way to manage the results funded by the federal government. For example, entities are required to maximize the application of the research result funded by the federal government by transfer to the private sector. In addition, the federal agencies with research institutes are required to allocate more than 0.5% R&D budget to the technology transfer, and entities are required to establish the
office for technology transfer and in the case of a institute's R&D budgets exceeds
$ 20 million, to employ a full-time officer for technology officer [15]. With these two
acts, the technology transfer in the U.S. institute was promoted.
Under President Obama's administration, there are several policies for innovation. Strategy for American Innovation, released in 2009, is for establishing the foundation
for sustainable growth and the creation of quality jobs by clarifies the critical roles1
for the federal government [16]. Based on this strategy, President Obama started in 2011 to celebrate, inspire and accelerate high-growth entrepreneurship throughout the nation [17]. This initiative is based on the idea that startups and entrepreneurs can be engines of job creation and economic growth. It focused on five areas; (1) Unlocking access to capital to fuel startup growth, (2) Connecting mentors and education to entrepreneurs, (3) Reducing barriers and making government work for entrepreneurs, (4) Accelerating innovation from "lab to market" for breakthrough technologies, (5) Unleashing market opportunities in industries like healthcare, clean energy, and education [16].
(3) Innovation policy in Japan
Importance of innovation for economic growth has been mentioned in Japan, the nation lack of natural resources. However, the history of Japanese innovation policy was started almost 10 years later for the U.S. The Act to Facilitate Technology Transfer from Universities to the Private Sector was established in 1998 in order to improve the technologies in industries including new field and to activate R&D activities in academic institutes. With this act, the establishment of the technology transfer offices (TLO) was boosted. In 1999, the system for Bayh-Dole was enacted in the Act on Special Measures Concerning Revitalization of Industry and Innovation in
1 1) Investment in the building blocks of innovation, such as fundamental research, human capital,
and infrastructure. 2) Creation of the right environment for private-sector investment and
competitive market. 3) Catalyzing for breakthrough related to national priorities and other grand challenges of the 21st century.
Industrial Activities. This system is based on Bay-Dole Act in the U.S. In addition, the exception on licensing fee for researchers in universities was accepted and faculties in national universities can become to be board members of companies in 2000 [15].
In Growth Strategy 2018, creation of innovation ecosystem through collaboration with universities industries, and government agencies are mentioned and the improvement of universities' management system, the collaboration of academia, industry, and government, and the support for startups are also mentioned for accomplishing the goal[18]. In Integrated Innovation Strategy, established also in
2018, achieving "the most innovation-friendly country in the world" and showing
models of problem-solving to other countries as the front-runner of the world are declared as the objectives[19].
In addition, the recent amendment on Act on Improving the Capacity, and the Efficient Promotion of Research and Development through Promotion of Research and Development System Reform (the name is now changed to the Act on Activation of Science, Technology and Creation of Innovation) on December 2018 enables the national R&D agencies to invest startups for commercializing their fruits of R&D.
However, the challenge to fill in the gap between academia and industries and the small number and size of startups based on R&D have been mentioned in Japan. Many policies have been trying to overcome this problem and one of the representative system reorganizations in the funding system happened in medical R&D field. This was the reason for the establishment of the Agency of Medical Research and Development (AMED) in 2015. Currently in Japan, most of the funding to biomedical research is provide by AMED, which corresponds to NIH in the U.S., though AMED doesn't own research institute by itself.
AMED was established in Apr 2015 based on "Japan Revitalization Strategy -Japan is Back-" established in 2013[20]. With the strong push from the government, AMED was assigned as the control tower of the medical research and development, and most of the budget related to the medical R&D which had been managed by three ministries and agencies, i.e. Ministry of Education, Culture, Sports, Science and Technology (MEXT), Ministry of Economy, Trade and Industry (METI), Ministry of Health, Labour and Welfare (MHLW) and their belonging agency related to medical R&D, were integrated to AMED. Its primary objective is providing seamless financial support from basic research to practical application from which medical R&D in Japan had been suffering because the funding programs were provided by three ministries depending on its research stage, such as basic research, pre-clinical research, and clinical research.
Despite of these policies and the fact that Tokyo is ranked top in Innovation Cities
Index 2018 and Japan ranked 6th in Innovation Capacity in the Global
Competitiveness Report 2018[13], the government still feel needs and challenges for promoting innovation and implementing cutting-edge technology to the society because progressing aging society requires innovation with more speed than current pace. This mind is also same as in local governments especially which located in the rural area with a highly aging community and the national government encourages local governments to boost their economy by utilizing the specialty of the region in Regional Revitalization Strategy. Actually, some prefectures and cities, such as Kanagawa Prefecture, Kawasaki City, Kobe City, Kita-Kyusyu City, have been set their priority on science and technology as their core industry.
3.2 Regional clusters and biotech industries
(1) Regional clusters
Cluster is defined as a geographic concentration of interconnected companies and institutions in a particular field. It includes suppliers and providers of the industry and often extends to downstream of the industry, such as channels and customers,
and also to governmental and other institutions, such as universities, consulting firms, and human resource providers[21].
The formation of a cluster is important for companies in competition because clusters help them in accessing to specialized and experienced employees and suppliers and also to specialized information from their community in more easier way than other regions [22]. In addition, linkage among stakeholders within a cluster is more easily recognized and captured.
Clusters also have an important role in innovation. This is because firms within a cluster can perceive new buyer needs more clearly and rapidly and because participation in a cluster gives advantages in perceiving new technological, operating or delivery possibilities. Competition among firms which locate geographically concentrated also reinforce the innovation. These are almost same in new business formation because the existing networks information about opportunities which lower entry barriers for entrepreneurs are the advantage in starting a new business for filling the perceived gaps in a cluster[22].
(2) Biotech clusters in the world
Biotech industries also form clusters around the world. Genetic engineering and biotechnology news (GEN) announces annually the ranking of biopharma clusters in each region, the U.S., Asia, and Europe[7], [23], [24]. As shown in Table 1, the ranking in 2018, Boston/Cambridge and San Francisco Bay Area are the top2 clusters in the
U.S. and Japan is ranked 2nd in Asia. Though these rankings are separated by region,
the prosperity of top 2 clusters in the U.S. is obvious because of its long history in biotech industries beginning from the 1970s, recombinant DNA technology. Since then, many firms and talents have been accumulating to these two clusters.
Table 1 Top 10 biopharma clusters in 2018 by region
Rank US[7] Asia[23] Europe[24]
1 Boston / Cambridge, MA China United Kingdom
2 San Francisco Bay Area Japan Germany
3 New York / New Jersey South Korea France
4 BioHealth Capital Region [Maryland I India The Netherlands
Virginia / Washington, D.C.]
5 San Diego Australia Spain
6 Greater Philadelphia Taiwan Switzerland
7 Los Angels / Orange Country, CA Singapore Belgium
8 Triangle Park, NC)Raleigh-Durham, NC (includes Research Malaysia Sweden
9 Seattle Thailand Italy
10 Chicagoland Indonesia Denmark
There are several articles analyzed and compared biotechnology clusters, in Boston/Cambridge, San Francisco Bay Area, the U.S., and Europe. The results suggest that the growth and diffusion of human capital, thus skilled labor and scientific expertise, was the primal determinant of the location and timing in the development of the American biotechnology industry [25]. Venture capital firms are another important stakeholder in the biotech cluster. Not only for investing local biotech companies, but also for navigating the business of a young company, VCs play a strong role in R&D [26]. Thus, in the high-tech based industries like biotech, suppliers of knowledge and funding seem to be essential in developing a cluster.
3.3 MIT approach to innovation ecosystem
(1) Innovation ecosystem and stakeholders
There are historically several models proposing stakeholders required for establishing an innovation ecosystem and they keep changing along with the development of economy and technology. In order to boost an economy, the relationship between industry and government had been focused on the old days. However, with the emerging of knowledge-based societies, the role of a university in innovation have been enhanced and the "Triple Helix" of University-Industry-Government relationship was stated [27].
After that, reality has already changed now. From the analysis of the world's iconic innovation ecosystems, Budden and Murray proposed the five key stakeholders in innovation-driven entrepreneurship ecosystems. The five stakeholders in this model are (1) Entrepreneur, (2) Risk Capital, (3) Corporate, (4) Government, and (5) University (Figure 1). These stakeholders are critical to the success in creating and growing innovation ecosystem. There are also other key players who can be included within the five stakeholders depending on the region's specific circumstance, such as service providers like lawyers and accelerators. [9]
Source: Budden & Murray, 2019[9] Figure 1 Five stakeholders in innovation ecosystem from MIT's model
Among these stakeholders, all of them can take a leadership role in creating the ecosystem. However, who is the best leader for ecosystem development is another problem. For example, large corporates are rarely regarded as leaders for the innovation ecosystem, but universities are often ideal leaders of a regional innovation ecosystem because of its regionality and longevity to commit the region. Of course, entrepreneurs/risk capital and government can be a leader but there might be limitations in the development stage and pitfalls in taking a lead. [9]
In addition, collective stakeholder leadership is also a key in developing the innovation ecosystem [9]. Thus, not only stakeholders themselves but also the relationships among them are also an important factor in developing the innovation
ecosystem and considering them becomes more important in the strategic development of the ecosystem.
(2) The system for innovation-driven entrepreneurship
Budden and Murray also developed a way to analyze the innovation ecosystem systematic way which enables to compare and capture each ecosystem in the world
[9], [28]. They break the system into four core elements shown in Figure 2.
A
Source: Budden & Murray, 2019[28] Figure 2 MIT's model for innovation-driven entrepreneurship system
The foundational institutions are existing institutions, rules, practices and norms and are important for the capability of the system in investments or leverage on the ecosystem. Innovation Capacity (I-Cap) and Entrepreneurial Capacity (E-Cap) are the twin engines of the system at the next level on the foundational institutions. The comparative advantage which leads to the impact of the system is shaped based on the elements of two capacities and linkage between these capacities. [28]
For two capacities, I-Cap is the capacity of a place to develop innovative ideas and to take them from societal impact and E-Cap is general entrepreneurial capability and conditions for entrepreneurial activity. Each capacity is consisted by five critical inputs; Human Capital, Funding, Infrastructure, Demand, and Culture & Incentives.
Each component is defined as in Table 2, and the metrics for measuring these inputs are summarized in Table 3.
Table 2 Definition of five components of I-Cap and E-Cap
Components Definition
the appropriate human talent (from within a region, or attracted into a region) with Human Capital relevant education, training and experience for either innovation or
entrepreneurship (or both).
a variety of types of capital (from the public and private sectors) that support Funding innovation and entrepreneurship both at their origins but also throughout the
journey from idea to impact, or start-up to scale-up.
the physical infrastructure that is necessary to support innovation and
Infrastructure entrepreneurship at their different stages - including space as well as equipment required for discovery, production and supply chains, etc.
the level and nature of specialized demand for the outputs of innovation and Demand entrepreneurial capacities supplied by different organizations in the system.
the nature of role models and individuals who are celebrated, the social norms Culture & ('culture') that shape acceptable career choices and the incentives that shape
incentives individual and team behaviors.
Table 3 Measurements for 5 inputs in I-Cap and E-Cap
Components I-Cap E-Cap
Quality of STEM education, STEM
Graduate, New PhD graduate, % of school grads in tertiary education, Human Capital Availability of scientists & engineers, Entrepreneurship perceived
Researchers/professional engaged in capabilities R&D
R&D expenditure, Public R&D Easy access to loans, ease of credit,
Funding expenditure, Business R&D Venture capital (VC) availability, VC
expenditure investment, VC deals
ICT access, Internet Bandwidth, Electricity & telephony infrastructure, Infrastructure Production process sophistication, Number of internet users, Logistics
Availability of latest technologies performance Government procurement of advanced
Demand technologies, University-industry Buyer sophistication, Domestic market research collaborations, Trade, scale
competition & market scale
Entrepreneurial intention, Fear of Culture & Quality of science research institutions, failure, Entrepreneurship as a good incentives Graduates in science & engineering career choice, High status to
successful entrepreneurs Business
3.4 Knowledge transfer from academia to industries (1) Channels for knowledge transfer
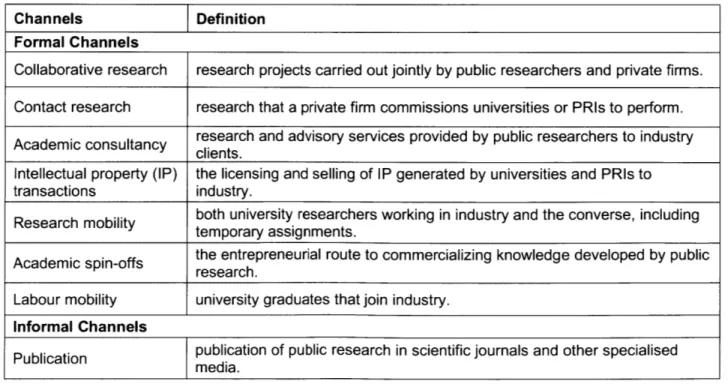
The importance of knowledge-based capital from academia to industries has been increasing, for the competitiveness and addressing the socio-economic challenges by benefitted from research and utilization of research findings to innovation [29]. There are two types of channels in knowledge transfer, one is formal and strong channels and another is informal and weak channels [8].
The formal channels are ones which are transferred by a certain type of legal arrangements. For example, collaborative and contract research, intellectual property transactions, labor mobility and academic spin-offs are categorized to this type of channel in OECD research. On the other hand, informal channels are ones occurred as information spillovers, thus weak connections among participants in a network facilitate this type of transaction, such as conferencing and networking, facility sharing, and recurrent education provided by universities to enterprises or people. The details defined in OECD are shown in Table 4 [8], [29].
Table 4 Types of channels in knowledge transfer and its definition
Channels Definition
Formal Channels
Collaborative research research projects carried out jointly by public researchers and private firms. Contact research research that a private firm commissions universities or PRIs to perform. Academic consultancy research and advisory services provided by public researchers to industryclients. Intellectual property (IP) the licensing and selling of IP generated by universities and PRIs to transactions industry.
Research mobility both university researchers working in industry and the converse, including temporary assignments.
Academic spin-offs the entrepreneurial route to commercializing knowledge developed by publicresearch. Labour mobility university graduates that join industry.
Informal Channels
Conferencing and interaction between public researchers and industry actors can take place in networking formal conferences or dissemination events, but also in more informal
settings.
Networking facilitatedy informal interactions between public research staff and industry researchers. by geographic proximity
Facility sharing Facility sharing between industry and public research.
Courses and continuing Courses and continuing education provided by universities to enterprises,
education and lectures at universities held by industry employees.
In the OECD's report "University-Industry Collaboration: New Evidence and Policy Options", they find five evidences:
1) The direct contributions of universities and public research institutes (PRIs)
to patenting remain modest, but are growing faster than those of inventions from firms.
2) Universities and PRIs increasingly engage in research collaboration with industry.
3) (Physical) proximity to universities and PRIs matter for industry inventions.
4) Startup firms founded by students or academic significantly contribute to commercializing knowledge developed through public research.
5) Labor mobility is a key channel of science-industry knowledge transfer,
particularly in some disciplines and industry sectors.
It is also mentioned that which channel is more important is different from industry to industry [30]. Especially in cutting-edge academic discoveries in biotechnology, such as a technique for recombinant DNA, the knowledge was transferred to industry through university spinoffs in many cases [31]. For example, Genentech (founded in
1976 and now a part of Roche), Biogen (founded in 1978) and Amgen (founded in 1980)
are all started by researchers in universities. Though, engagement on firms as consultants and/or advisory board members also work as the mechanisms of knowledge transfer in tissue engineering [32].
(2) Knowledge transfer and key stakeholders or relationship in the ecosystem
In addition to channels, there is a shift in the weight of contribution by each stakeholder during the development of the ecosystem. Owen-Smith and Powell (2004) revealed that six public research organizations (MIT, Boston University, Tufts, Harvard, the Dana Farber Cancer Center, Massachusetts General Hospital, and the New England Medical Center) and large corporations not in Boston mainly contributed to connects participants of the network in the early development stage of Boston biotech community (in 1988). However, ten years later (in 1998), the network's centrality shifted to dedicated biotechnology firm (DBFs) and VCs, thus it became a
more market-oriented network. They also mentioned that both proximity and
cohesion among participants are important in innovation. [8]
Stakeholders and relationship which underpin the ecosystem's network are also different from a cluster to a cluster. The Boston/Cambridge and San Francisco Bay Area are known as the world's largest and most successful biotech clusters, but their feature is different. The Bay Area cluster's network depended on venture capitals. though Boston/Cambridge cluster's network highly dependent on academic research institute at the early stage, as mentioned above. It is possible that the difference of these clusters is derived from the differences in the stage of clusters, but the heavier reliance on non-DBF patents in the citations of Boston firm's prior art than the firms in Bay Area's one also suggested the difference of knowledge source in these regions.
4. Definition and specificity of the biotech startup
ecosystem
In this section, the outline of the biotech startup ecosystem is defined and the specificity of the biotech startup ecosystem in comparing other technological fields is discussed to explore the ecosystem afterward.
4.1 Definition of the biotech startup ecosystem
In this research, we focus on the startup ecosystem in the biotechnology and pharmaceutical industry and define the ecosystem in this area as the biotech startup ecosystem. The biotech startup ecosystem could contain the medical device area, but the situation in that area is quite different from pharmaceutical industries (or the pharmaceutical industry is a quite unique area from others). In addition, there are two types of startups; one is the innovation driven enterprise (IDEs) and another is small/medium-sized enterprises (SMEs).[11] Thus, we focus on IDEs and limit the area of the biotech startup ecosystem basically within the biopharmaceutical industries, otherwise, there is a notification.
4.2 Specificity and trends in biotech industries (1) Specificity of biotech industries
It is often said that biotech startups a high-risk. Of course, most startups fail in all industry areas (the success rate of biotech startups is 13.8%), but biotech startups spend harder time until when it comes to clear whether their business succeeds. [34] In addition, 90% of clinical trials fail to get approval from the Food and Drug Administration (FDA). [35] Even though it goes successfully, more than 10 years are required until when the product is approved by FDA and it costs $2.6 billion in average (doubled from the mid-2000s) until it gets approved. [36] Because of the duration and costs on R&D, it takes long a time until a drug makes money, increase the risk of competition and cause the risk in expiring its patents and reduction of terms which a company is benefited from the patent protection. [37]
In addition to the specificity as the startup businesses, the biotech startup ecosystem also has a characteristic feature in the way of knowledge transfer from universities to industries. While joint research between universities and industries is a predominant way of knowledge interaction in technology-oriented industries, [30] a deep commitment by a scientist to a firm, such as by full employment or university-spinoff startup, is rather important in transferring new academic knowledge in biotechnology. [31]
Thus, in capturing the biotech startup ecosystem, we need to consider the systems which support the specificity of the biopharmaceutical businesses and the channels of knowledge transfer in biotechnology.
(2) Change in biotech and pharmaceutical industry
The change in the technological trend is inevitable in all industries and affects companies' business model. In addition, the needs for decreasing the cost and duration in developing new drugs makes it critical for pharmaceutical companies to change their R&D strategy. For example, companies collaborate with academia in a more engaging way and result in the increment of R&D budget allocation to collaboration partners from academia and the creation of a new alliance program with academia. Also, portfolio management including M&A and project acquisitions becomes more important in this industry. [37]
Creating innovation centers is another trend for pharmaceutical companies to boost innovation by mixing the internal and external resource including experts within or outside of a company.[37] For example, Pfizer opened Centers for Therapeutic Innovation (CTI) in 2010 to boost academic-industry collaboration and to bridge the gap between early scientific discovery and the translation to developing new medicine
(J&J) owns Johnson & Johnson Innovation as a part of the group and incubates and
invests biotech startup companies. [39]
In addition, increasing the share of biologics, such as monoclonal antibodies, proteins or peptides (Figure 3) requires pharmaceutical companies to change their R&D model or pipelines because their traditional drugs are based on small molecules and because their R&D system has been optimized for them. [40]
$ billion Wlabdwide Prescription Drug& OTC Pharmaceutical Sales
1400
1200
0
~
IIIIIILce!
World Preview 2018 Outlook
to
2024, Evaluate Pharma
Figure 3 Worldwide prescription drugs & OTC pharmaceutical sales by category2
4.3 Biotech startup's process from start to exit
(1) Growing process of a biotech startup
A
biotech startup's growth process is almost same as other tech-oriented startups, thought its industry area has some specificity noted above. Table 5 describes what kind of tasks are required in a startup's business and R&D and Figure 4 is the flow chart which shows when each task is required for the business.2 -2017: actual data, 2018-: prediction
Table 5 The task of a biotech startups
Category Type of task Specific tasks
Grant application
Funding Applying business competitions
Fundraising from VC (including CVC)
Human Resource Recruiting
Filing the business
Business Side Establishing a company Fining Advis
Finding Advisory Board Preparing for IPO
Negotiation for M&A or licensing Patenting
IP licensing R&D for POC
R&D R&D for patenting
R&D Side R&D for IND
Coordinating clinical trials Managing clinical trialsdata
Business Idea & Technology
Business
Continuous work on
- Grant application IP L
- Business competition Bus
- Fund raisingBu - HR management , M&A or icensing c iness Plan Advisory Board the business -Founding a startup ant application sing negotiation
:are for IPO
Exit: IPO or M&A
Figure 4 Flow chart of tasks in a biotech startups business
It is apparent from Figure 4 that most of the tasks relating to the management a startup is required temporally and concentrated at the beginning of a business.
R&D
ntinuous work
Finally, a biotech startup exits, that is it goes public in an initial public offering (IPO) or is sold to a large pharmaceutical company. However, a biotech startup's story doesn't end at this point, it still needs to go forward in the R&D side to get FDA's final approval. Also, the management team has to raise money continuously.
Overall, there are many tasks in the business side at the beginning of a startup's business and an entrepreneur has to learn or be supported to overcome them especially if the founding group doesn't have any background in business. Farther, the beginning phase of a biotech startup is more important than of other industry's startups because a biotech business takes much more time and cost. Therefore, in order to reduce the hurdle in starting a business, several types of supports and/or services are required from entrepreneurs.
(2) Requirements for supporters and supporting activity in the ecosystem
As mentioned in Chapter 3, there are five major stakeholders in the innovation ecosystem. The supports and/or services for startups pointed out above are provided
by universities, pharmaceutical companies, and VCs as a part of their business, but
such supports are not their primal function in the ecosystem. In addition, there are certain organizations who primarily provide these supports and services to entrepreneurs. Also, these supports are sometimes delivered by the intangible ways, such as word of mouth. This type of knowledge transduction is based on the network, and the network is also sometimes provided by a certain entity which is not categorized into the five stakeholders, such as the association of stakeholders. The function of these entities which are not categorized to five stakeholders plays a more important role in starting a company, especially in the field like biotech where the risk and cost are higher than other areas.
To fill the gap of the five stakeholders' model and the point above, we decided to count "Supporter" as another stakeholder in the innovation ecosystem. The concept of supporter is also mentioned as one of the stakeholders in the ecosystem in some
models,[41] and it is sometimes called intermediaries.[42] In these models, supporters are defined as infrastructure, professionals, and network which supports entrepreneurs. For example, law firms support startups in the legal process, such as filing the company and signing the license agreement. The association of stakeholders in the ecosystem is also categorized here because their primary role is networking all the stakeholders including startups and the network could be a key for newcomers in the ecosystem like startups. Therefore, as considering the importance of the supporter's role at the beginning of biotech startup business, we adopt this definition and consider supporters as one of the critical stakeholders. In addition, as mentioned above, some of the functions provided by supporters could be provided by other stakeholders redundantly. We also define it as "supporting activity" and discuss this point in the later section.
5. Metrics in comparing the biotech startup ecosystem
In this section, we'll define the metrics for analyzing and understanding the biotech startup ecosystem including the five stakeholders in MIT's model and the supporters as we discussed above.
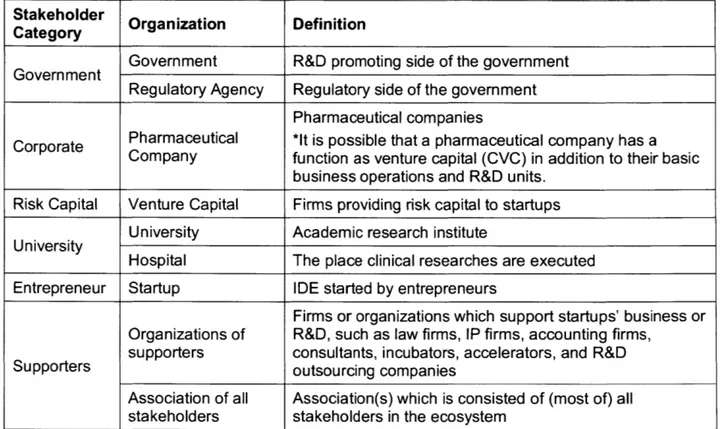
5.1 Stakeholders in the biotech startup ecosystem
(1) Supplies and demands of stakeholders in a biotech ecosystem
Table 6 shows the function of six stakeholders in focusing on their demand and supply
on the ecosystem. The supplies and demands of stakeholders reveal that the main
values exchanged in the ecosystem are technology3, knowledge, researcher, and
money and that the supply of entrepreneur is essential for the risk capital and the supporter. This means they don't have the incentive to be in the ecosystem without entrepreneurs.
Table 6 Supply and demand of six stakeholders in the ecosystem
stakeholders What they can give to the ecosystem What they need from the ecosystem
(supply) (demand)
Technology Money (including tax deduction)
Entrepreneur Knowledge Knowledge
Researcher Place (lab facilities and office space)
Researcher Technology
University Knowledge Money (including tax deduction)
Place (including lab facilities) Knowledge
Researcher
Government Money (including tax deduction) Money (tax)
Place (including lab facilities)
Money Technology
Corporate Knowledge Place (including lab facilities) Knowledge Researcher Researcher
3 In this study, we distinguish technology from knowledge. Technology is the knowledge directly
related to business itself and transferred among stakeholders via patents or other contracts.
Knowledge is the knowledge not directly related to business and tend to be more supportive activity in business. Knowledge can be transferred not only by contracts but also by word of mouth.
Money
Risk Capital Entrepreneur
Knowledge Knowledge
Supporters Place (including lab facilities) Entrepreneur
Opportunity (meet-up etc.)
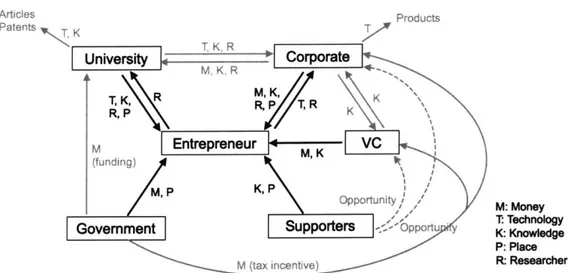
Figure 5 is the stakeholder value network surrounding entrepreneurs and Figure 6 is the whole structure of the network of the ecosystem based on the analysis in Table 6. Figure 6 includes the network other than entrepreneurs and shows that stakeholders are connected mutually. In addition, it shows that researchers and technology are exchanged among entrepreneur, university and corporate.
University Corporate R M, K, T, K,\\ RP/T R, R, R Entrepreneur M, K- VC M: Money M, P K, P T: TechnologyK: Knowledge P: Place
Goverment SupporterS R: Researcher Figure 5 Stakeholder value network surrounding entrepreneurs
Articles Products Patents T University T Corporate M, K, R R, R M Entrepreneur VC (funding) M M, PK Opportunity / M: Money
Suprtr OPP~t T Technology
Govemment Supporters portu Knowledge
P: Place
M (tax incentive) F- Researcher