Publisher’s version / Version de l'éditeur:
Journal of Materials Chemistry, 19, 33, pp. 1-19, 2009-09-09
READ THESE TERMS AND CONDITIONS CAREFULLY BEFORE USING THIS WEBSITE. https://nrc-publications.canada.ca/eng/copyright
Vous avez des questions? Nous pouvons vous aider. Pour communiquer directement avec un auteur, consultez la
première page de la revue dans laquelle son article a été publié afin de trouver ses coordonnées. Si vous n’arrivez pas à les repérer, communiquez avec nous à PublicationsArchive-ArchivesPublications@nrc-cnrc.gc.ca.
Questions? Contact the NRC Publications Archive team at
PublicationsArchive-ArchivesPublications@nrc-cnrc.gc.ca. If you wish to email the authors directly, please see the first page of the publication for their contact information.
NRC Publications Archive
Archives des publications du CNRC
This publication could be one of several versions: author’s original, accepted manuscript or the publisher’s version. / La version de cette publication peut être l’une des suivantes : la version prépublication de l’auteur, la version acceptée du manuscrit ou la version de l’éditeur.
For the publisher’s version, please access the DOI link below./ Pour consulter la version de l’éditeur, utilisez le lien DOI ci-dessous.
https://doi.org/10.1039/B910216G
Access and use of this website and the material on it are subject to the Terms and Conditions set forth at
Hydration of tricalcium silicate in the presence of synthetic calcium-silicate-hydrate
Alizadeh, Rouhollah; Raki, Laila; Makar, Jon M.; Beaudoin, James J.; Moudrakovski, Igor
https://publications-cnrc.canada.ca/fra/droits
L’accès à ce site Web et l’utilisation de son contenu sont assujettis aux conditions présentées dans le site LISEZ CES CONDITIONS ATTENTIVEMENT AVANT D’UTILISER CE SITE WEB.
NRC Publications Record / Notice d'Archives des publications de CNRC: https://nrc-publications.canada.ca/eng/view/object/?id=82783e7a-7802-4758-b945-86dbb7eb2933 https://publications-cnrc.canada.ca/fra/voir/objet/?id=82783e7a-7802-4758-b945-86dbb7eb2933
http://www.nrc-cnrc.gc.ca/irc
H ydra t ion of t ric a lc ium silic a t e in t he pre se nc e of synt he t ic c a lc ium -silic a t e -hydra t e
N R C C - 5 1 3 2 4
A l i z a d e h , R . ; R a k i , L . ; M a k a r , J . M . ; B e a u d o i n , J . J . ; M o u d r a k o v s k i , I .
S e p t e m b e r 2 0 0 9
A version of this document is published in / Une version de ce document se trouve dans:
Journal of Materials Chemistry, v. 19, no. 33, September 9, 2009, pp. 1-19, DOI: 10.1039/B910216G
The material in this document is covered by the provisions of the Copyright Act, by Canadian laws, policies, regulations and international agreements. Such provisions serve to identify the information source and, in specific instances, to prohibit reproduction of materials without written permission. For more information visit http://laws.justice.gc.ca/en/showtdm/cs/C-42
Les renseignements dans ce document sont protégés par la Loi sur le droit d'auteur, par les lois, les politiques et les règlements du Canada et des accords internationaux. Ces dispositions permettent d'identifier la source de l'information et, dans certains cas, d'interdire la copie de documents sans permission écrite. Pour obtenir de plus amples renseignements : http://lois.justice.gc.ca/fr/showtdm/cs/C-42
Hydration of tricalcium silicate in the presence of synthetic calcium-silicate-hydrate
Rouhollah Alizadeh*a, Laila Rakia, Jon M. Makara, James J. Beaudoina and Igor Moudrakovskib
a
National Research Council of Canada, Institute for Research in Construction, 1200 Montreal Rd, Ottawa, ON, Canada, K1A 0R6.
b
National Research Council of Canada, Steacie Institute for Molecular Sciences, 100 Sussex Dr, Ottawa, ON, Canada, K1A 0R6.
Abstract
The early age hydration of tricalcium silicate, the main chemical compound in Portland cement, was studied in the presence of synthetic calcium silicate hydrate (C-S-H) addition having C/S ratios=0.8 and 1.2. Isothermal conduction calorimetry, scanning electron microscopy, differential scanning calorimetry and 29Si MAS NMR were employed in order to investigate events occurring during various stages of the hydration. The results that were analyzed using novel methods in cement chemistry showed that the addition of seeds of synthetic C-S-H significantly accelerated the hydration of C3S. The extent of the
acceleration was dependant on the amount and chemical composition of the C-S-H seeds. It was suggested that the synthetic C-S-H significantly increased the rate and degree of dissolution of the C3S particles.
It was also found that the nucleation and silicate polymerization of the C-S-H that formed during the hydration of the C3S phase was promoted. Direct evidence of the seeding effect
was provided. The properties of the resulting C-S-H hydration products seemed to be dependant on the lime to silica ratio of the synthetic C-S-H. It was suggested that the silicate polymerization and chemical composition of the hydration products of silicate phases may be manipulated through C-S-H seeding. As the chemical and mechanical properties of C-S-H are largely controlled by its C/S ratio, this method should provide a unique tool for tailoring the nanostructure of the hydration products of Portland cement through the addition of selective C-S-H seeds for optimum engineering and durability performance.
Keywords: Tricalcium Silicate (C3S), Calcium Silicate Hydrate (C-S-H), Hydration,
Nucleation, Quantitaive 29Si MAS NMR, C-S-H Seeding
1. Introduction
Tricalcium silicate (C3S†) is arguably the most important clinker phase in Portland cement
[ 1]. Its hydration greatly influences the setting and hardening of the cement paste. The main product of the reaction of C3S with water is calcium silicate hydrate (C-S-H), a nearly
amorphous material, which primarily contributes to the strength and volume stability in cement-based materials [ 2]. Numerous studies have been conducted to understand various steps and mechanisms in the hydration of C3S [ 2, 3]. These mainly include the application of
conduction calorimetry, thermogravimetric analysis, quantitative X-ray diffraction and nuclear magnetic resonance spectroscopy [ 4]. It is known that as soon as the C3S comes into
contact with water a significant amount of heat is generated due to the dissolution of species such as Ca2+ and OH– ions in the aqueous phase [ 5, 6]. This stage is called the pre-induction period. During the next few hours (dormant or induction period) the rate of hydration is negligible. This period is followed by an acceleration in the hydration process. The heat of hydration diminishes after about ten hours during the deceleration stage. There are several hypotheses for the mechanisms responsible for these stages [ 2, 7], that can be employed to describe the hydration of C3S systems in various environments. The hydration kinetics of
C3S can be altered through the addition of various chemicals. The occurrence and duration of
the hydration stages can be readily tailored by controlling the type and amount of these admixtures and additives. Calcium chloride, for example, accelerates the hydration process, shortening the dormant period and generating more heat at a higher rate during the acceleratory stage [ 5]. Fine minerals such as calcium carbonate may act as nucleation sites for the formation and growth of the C-S-H, essentially promoting the hydration of C3S [ 8].
The extent of nucleation and acceleration often depends on the surface area of the fine particles added [ 9, 10]. In most cases, however, it is not very clear if there is any chemical interaction between these additives and the hydration products.
Analogous to the nucleation and growth of crystals in nature, pre-formed calcium-silicate-hydrate may promote the development of the C-S-H produced from the hydration of silicate phases in cement. Several studies have shown that addition of silicate hydrates (including the pre-formed C-S-H) accelerates the formation of C-S-H produced in the hydration of C3S [
† Cement chemistry nomenclature: C=CaO, S=SiO
2, H=H2O.
In the current study, the hydration of tricalcium silicate in the presence of synthetic C-S-H addition (C/S=0.8 and 1.2) was investigated at early ages. In addition to isothermal conduction calorimetry, experimental methods such as differential scanning calorimetry, scanning electron microscopy and quantitative 29Si MAS NMR were employed in order to examine the hydration products and understand pertinent mechanisms controlling various stages of the hydration of C3S and C3S–C-S-H systems. Unlike the previous C-S-H seeding
studies [ 12- 16], the influence of the stoichiometry of the seed particles on the nature of the C-S-H product was investigated in the current research. The 29Si MAS NMR measurements and the isothermal conduction calorimetry results were analyzed using quantitative NMR and derivative conduction calorimetry methods that are novel in cement research. The NMR analysis is described in this paper, while the calorimetric approach has been presented elsewhere [ 17].
2. Method
The C3S clinker was obtained from the CTL Group (Skokie, IL). It was calcined at 900 °C
for 24 hours in order to remove any carbonate impurities, ground in a ball mill using isopropanol, dried under vacuum and stored in a vacuum desiccator until used. The C3S
powder had a nitrogen BET surface area of about 2.4 m2/g. Synthetic C-S-H (C/S ratios= 0.8
Six test samples of 4 grams of C3S with 5, 10 and 20% additions of each C-S-H material and
a seventh control sample of 4 grams of pure C3S were prepared for isothermal conduction
calorimetry. Water (Accusolv, Anachemia Inc.) was added to the dry mix in plastic vials at a w/C3S ratio=0.8 and mixed outside the calorimeter for 30 seconds using a micro spatula. The
0.8 w/C3S ratio was used in order to obtain the desirable workability for mixing the samples
especially when a high proportion of C-S-H was added.
Each plastic vial was placed in the calorimeter 30 seconds after mixing. The heat of the hydration of the cement systems (C3S and C3S–C-S-H) was immediately monitored in a Tam
Air Isothermal Calorimeter (model 3114, Thermometric AB). Glass beads (3mm diameter, having equal heat capacity to each sample) were used in the reference channels of the instrument. Data for the heat evolution was recorded (typical uncertainty=±0.002 mW/g) at 30-second intervals at a constant temperature of 24 °C. The heat capacity of the synthetic C-S-H was assumed to be about 1.3 J/g-°K in the calculations. This is a low average value
Samples of C3S having 20% C-S-H addition were used for DSC investigation, SEM analysis
and NMR measurements. The high addition percentage was used in order to augment the effects of the hydration mechanisms involved and to better detect minor changes in the samples during the hydration. A small sample was taken from these specimens at various hydration times (marked in Fig. 2). These samples were first immersed in excess isopropanol for 24 hours in order to stop the hydration process and then dried under vacuum for another 24 hours. This procedure has been successfully used in SEM studies of the hydration of cement and tricalcium silicate although it may slightly affect the morphology of the hydration products [ 22]. The dried samples were kept in a vacuum desiccator until examined.
Differential scanning calorimetry (DSC) was conducted on the samples obtained at various hydration times using a TA Instruments SDT Q-600. About 10mg of the sample was heated from ambient to 1050 °C at a rate of 10 °C/min under the flow of nitrogen gas (10mL/min). The heat flow was analyzed using Universal Analysis 2000 software.
Scanning electron micrographs were acquired from the uncoated specimens using a Hitachi S-4800 field emission gun SEM instrument. An accelerating voltage of 1.2 KV and an emission current of 4 μA were applied at a working distance of about 3 mm to obtain images having greater resolution and more details than those that are possible at higher accelerating voltages [23].
The 29Si MAS NMR measurements were carried out on a Bruker Avance 200 instrument (magnetic field of 4.7 T and 29Si Larmor frequency of 39.75 MHz) using a BL7 double resonance MAS probe and 7 mm ZrO2 spinners. All NMR measurements were performed at
room temperature at the spinning speed of 5000 Hz. The spectra were acquired in a Bloch decay mode (29Si π/2 pulse of 4 μs) with a high power composite pulse proton decoupling. The delay between the scans was set at 60s. This was sufficient for complete relaxation of all the signals and quantitative measurements. Between 1000 and 1500 scans were commonly acquired in order to obtain a sufficiently high signal-to-noise ratio. Fitting and deconvolution/integration of the spectra were performed using the DMFit simulation program [ 24]. In quantitative measurements the absolute intensity in the spectra was normalized to the total number of scans acquired. The signal of tetrakis(trimethylsilyl)silane was used as the external reference (-9.9 ppm relative to TMS).
3. Results and Discussion
3.1. Isothermal Conduction Calorimetry
One of the primary techniques for studying the hydration kinetics of cement-based systems is the measurement and analysis of the heat developed (Q) after the contact of the material with water. The rate of heat development (dQ/dt) in the hydration of C3S–C-S-H systems and the
control C3S sample investigated in the current study are shown in Fig. 2†. It is observed that
the addition of synthetic C-S-H noticeably modifies the rate of heat generated at various stages of the hydration, the extent of which depends on the composition and the amount of C-S-H added. A derivative analysis of the curves in Fig. 2 was also conducted (see curves in Fig. 3) in order to better identify the subtle changes in the rate of heat development that might be associated with different phenomena. This kind of analysis has been successfully applied in the studies of the hydration of C3S and Portland cement systems [17, 22, 23].
The pre-induction period lasts less than an hour for all samples. This stage ends slightly earlier when the synthetic C-S-H is added. The end of pre-induction period (i.e. the time at which the rate of heat development is a minimum and d2Q/dt2=0) occurs at about 53, 45, 40 and 36 minutes for the control C3S, and 5, 10 and 20% C-S-H additions, respectively. This
†
The data for the first 20m is not plotted in order to enhance clarity.
In a separate study (not reported) using a less reactive C3S sample, it was observed that the
heat generated during the pre-induction stage increased significantly for C3S in the presence
of C-S-H. This effect was much more pronounced in the case of low lime C-S-H (C/S=0.8). It can, therefore, be argued that the early reactions occurring at this stage such as the dissolution of ions from the C3S grain into the aqueous phase (responsible for the initial heat
development) are promoted due to the presence of the synthetic C-S-H seeds. It is also likely that the “barrier layer” that has been suggested to form on the C3S surface and is responsible
for the beginning of the dormant period [12] becomes less effective in the presence of synthetic C-S-H. Ions such as Ca2+ and OH– hypothetically migrate toward the synthetic C-S-H (that has a high surface area which makes it very suitable as a nucleation site) and are adsorbed on its surface where they nucleate and grow to form the C-S-H product instead of forming an early-stage product on the surface of tricalcium silicate. Direct evidence from SEM (section 3.2) supports this theory. Formation of hydration products (precipitated from the solution) on the surface of the C-S-H seed decreases the concentration of ions in the solution phase and accelerates their dissolution from the C3S into the aqueous phase even
during the pre-induction period. (refer to Figs. 4-a1 and 4-b1 for direct evidence of additional dissolution). More heat is then generated during the pre-induction stage due to the suggested mechanisms for dissolution and precipitation. This theory is consistent with the previous observations suggesting that the addition of fine particles such as silica fume and calcium carbonate has similar effects in terms of the length of the pre-induction period and the increased rate of heat development [9, 25-27].
The induction or dormant period can not be identified as such (Fig. 2). The heat flow data for the samples experiences only a brief minimum value after the end of pre-induction period in the rate of heat development curves of seeded samples. Immediately after the occurrence of minimum value, the rate of heat development increases at a rate that seems to vary according to the amount and surface area of the C-S-H seed present in the sample. This effect is better demonstrated in Fig. 3. It has been shown that the induction period is extended when there is a high concentration of dissolved Ca2+ and OH– ions in the aqueous solution [28]. The depletion of Ca2+ and OH– ions from the aqueous solution can accelerate the hydration of C3S [29]. It is therefore suggested that the synthetic C-S-H which acts as a nucleation site for
the growth of the C-S-H product adsorbs the ions in the aqueous solution. This in turn shortens the “induction period”. A decrease in the length of the dormant stage has been observed previously when C3S and Portland cement are hydrated in the presence of various
silicate hydrate systems [12-15]. The end of this period was also observed to occur faster in seeded samples consistent with the interpretations advanced in the current study.
The acceleratory stage leads to a peak after the dormant period followed by the deceleratory stage. This peak occurs at earlier times (presented in Table 1) for the C3S–C-S-H mixes
compared to the control C3S where rate of heat development reaches a maximum value at
about 9.5 hours. This maximum, for the control sample, is preceded by a smaller peak appearing on the shoulder immediately after the end of induction period. It has been demonstrated that the time between the end of the induction period and the start of the deceleration in hydration process is composed of two separate stages [22, 23]. Immediately after the end of the induction period surface reactions predominate, while afterwards bulk nucleation and growth are more significant. The calculation of the derivative of the heat flow curves (obtained using high resolution calorimeters such as that in the current work) can assist in separating the two processes.
The derivative of the rate of heat development curves are shown in Figs. 3-a and 3-b for samples containing synthetic C-S-H addition, C/S=0.8 and 1.2, respectively. The acceleratory stage for the control C3S sample (corresponding the part of the curves in Fig. 3
The existence of these two events is more distinct in the C3S–C-S-H systems. The intensity
and location of the peaks associated with these events appear to be influenced by the type and amount of C-S-H seed. A comparison between the derivative heat flow curves for the control sample, increasing amounts of 0.8 C/S ratio C-S-H (Figure 3a) and increasing amounts of 1.2 C/S ratio C-S-H (Figure 3b) suggests that different processes may be in play during the hydration of the samples with the two different types of synthetic C-S-H. In the 0.8 C/S ratio blends, the main hydration peak from the control sample becomes attenuated with increasing synthetic C-S-H content. This is seen as a shift from being the main positive peak in the figure for the control sample to being a secondary maxima with a value less than zero in the samples with higher synthetic C-S-H content. Instead, the maximum heat flow occurs in an early peak that increases in size with increasing synthetic C-S-H content. Previous work has shown that increasing surface area of C3S produces such an effect [ 22],
which was attributed to surface hydration reactions, as opposed to bulk ones. The high surface area of this type of synthetic C-S-H provides a massive number of sites for the formation of initial C-S-H substances. This promotes the nucleation of C-S-H and accelerates the rate of heat development during the acceleratory stage observed by the increase in the intensity of the peak associated with the first event in Fig. 3-a.
This effect is not dominant in the 1.2 C/S ratio blends, where only a single peak is observed during the initial stages of the hydration reaction. This result suggests that bulk hydration product reactions are the primary mechanism in these samples. Although there is a significant difference in the surface area between the 0.8 C/S ratio and 1.2 C/S ratio samples, both materials had surface areas that are much higher than those that produced the early, surface area related hydration peak in C3S alone [ 22]. Instead, the differences in hydration
behavior may be due to structural differences in the synthetic C-S-Hs. This point is
The deceleratory period in the hydration of C3S–C-S-H is initiated at earlier times for the
C/S=0.8 sample compared to the C/S=1.2 and control sample. The total heat developed in the hydration reactions (i.e. the area under the curves in Fig. 2) is higher when the synthetic C-S-H is added. This suggests that more C3S is consumed in the hydration reactions when C-S-H
is used for seeding. The degree of hydration is therefore likely to be higher in the modified systems. Despite the significant differences during the acceleratory stage, the slope of the rate of heat development curves during the deceleratory stage (as shown by the derivative analysis in Figure 3 between 6 to 12 hours) is similar for all samples. It also appears that two events occur during the deceleratory stage (indicated by double peaks in the region where d2Q/dt2<0 ) in the seeded samples whereas control C3S has only one peak. This behavior,
which is more distinct for the C/S=1.2 sample, may support the existence of two mechanisms in the formation of hydration products: conventional C-S-H on the surface of C3S and the C-S-H on the surface of seeds. It is suggested that these two events in the
conduction calorimetry have different rates during their acceleration and deceleration stages. The calculation of this rate (i.e. their derivative analysis as shown in Fig. 3) will therefore produce curves with double peaks in both stages of the hydration.There is also a slight increase in the rate of heat development reduction (inferred from the intensity of the peaks in the deceleratory stage) when C-S-H is added to the C3S suggesting a quicker completion of
the reactions.
3.2. Scanning Electron Microscopy
The results of the SEM examination of the control C3S and C3S+20% C-S-H (C/S=0.8)
samples are shown in Fig. 4. The surface of the control C3S (Fig. 4-a1) is intact after 20
minutes of hydration during the pre-induction stage. It has a relatively smooth surface similar to that in the unhydrated C3S. Few etch pits appear on the surface after 1h20min of
hydration (Fig. 4-a2). Formation of these etch pits has been previously reported to occur at the end of induction period [ 22, 23]. Small C-S-H hydration products can be observed on the surface of C3S at this time (that is at the beginning of the acceleratory period). After 2.5h of
contact with water, most of the surface of the C3S is covered with etch pits and the C-S-H
The presence of synthetic C-S-H (C/S=0.8) results in noticeable differences in the appearance of the C3S grains during the hydration (shown in Fig. 4-b). The surface of the
C3S is covered by small etch pits after only about 10min (Fig. 4-b1). This is indicative of a
significant dissolution of the C3S during the pre-induction period, which is consistent with
the intense release of the hydration heat at this stage for the seeded systems. The heat of wetting is therefore not the dominant factor controlling the heat of hydration before the dormant period in the blended samples. In a separate study by the authors (unpublished) it was observed that the amount of heat generated in the hydration of β-C2S–C-S-H systems
during the pre-induction stage is much less than that in the corresponding C3S–C-S-H
system. It is therefore unlikely that the wetting effect is a governing factor for the initial release of heat as soon as material comes into contact with water. Dissolution of ions from the unhydrated grains into the solution is suggested to be responsible for the heat of hydration before the dormant period. After 1h, the surface of the C3S is extensively covered
with etch pits (Fig. 4-b2). Small C-S-H hydration products and Ca(OH)2 crystals (identified
by their distinct morphology [ 2]) also appear on the surface. The surface of the control C3S
sample (Fig. 4-a2) is relatively intact at a similar hydration time. The surface of the C-S-H seed does not seem to be affected during the hydration up to this stage (not shown). Changes at the nucleation sites, if any, cannot be observed probably due the limitation of the SEM imaging resolution.
The surface of C3S particles is covered by C-S-H after 3 hours of hydration (Fig. 4-b3). This
corresponds to the location of the maximum in the rate of heat development curve. A larger number of C-S-H particles forms on the surface of the C3S after this time (Fig. 4-b4). Their
population, however, is not as high as that in the control C3S sample (Fig. 4-a4). This
qualitative observation that was made in several spots may suggest that the C-S-H products can form at other sites. Examining the surface of the C-S-H seed at this time (identifiable by its distinct morphology in Fig. 5-a) reveals interesting features. In comparison with the
surface of the pristine C-S-H (C/S=0.8) in Figure 1-a, it is observed that small needle-like particles are formed on the surface of the synthetic C-S-H after 3 hours. These structures appear to be the C-S-H phases produced from the hydration of C3S, but nucleated on the
surface of the seeds rather than on the C3S itself. These particles grow larger at later times
and finally cover the surface of the synthetic C-S-H. This may also be responsible for the relatively lower population of the C-S-H products on the surface of C3S in these samples.
This provides direct visual evidence for the nucleation of hydration products on the surface of fine particles. The formation of C-S-H on the surface of the synthetic C-S-H may help to explain the marked increase in the peak intensity associated with the initial reactions observed in Fig. 3-a for this sample. This also supports the theory that the dissolved ions migrate toward the surface of the C-S-H seed.
Similar changes in the morphology of C3S occur (not shown) in the presence of synthetic S-H (C/S=1.2), but at a slower rate possibly due to the difference in the surface area of the C-S-H seeds as mentioned before. At 20min of hydration no visible change was detected on the surface of C3S and C-S-H. The etch pits and initial C-S-H products appear on the surface of the C3S after about 2h. The formation of C-S-H on the surface of the synthetic C-S-H is clearly observed after 3h as shown in Fig. 5-b. The needle-like structure of the initial C-S-H products on the surface of the seed are easily observed in contrast with the appearance of the pristine C-S-H seed in Fig. 1-b. The growth of C-S-H on the surface of synthetic C-S-H (C/S=1.2) at later times is not as extensive as that in the case of C/S=0.8. The morphology of synthetic C-S-H (C/S=1.2) is still detectable at later hydration times as it is not fully covered by the hydration products. The observed lower rate of formation on the surface of the synthetic C-S-H corresponds well to the results of Fig. 3-b, which shows more prominent effects on the bulk growth of the C-S-H. It should be noted that the C-S-H formed on the surface of synthetic C-S-H must be considered in a separate category distinct from the ‘inner’ and ‘outer’ products postulated in the hydration of conventional silicate phases [ 30]. The mechanism of nucleation and growth of this type of C-S-H is apparently different from that forming on the surface of the C3S. The C-S-H that is precipitated on the surface of the C3S affects the rate of the dissolution of the covered C3S grain and the diffusion of ions. This mechanism, however, is not applicable to the C-S-H forming on the surface of the seed
3.3. Differential Scanning Calorimetry
The DSC technique has been extensively applied in the investigation of calcium silicate systems in cement chemistry [ 31]. C-S-H and C3S both exhibit thermal behavior due to the
crystalline conversion and transition at high temperatures between 800 and 1000 °C. This behavior was explored for the C3S–C-S-H systems in the current study. The results for the
thermal analysis of the control and modified samples with 20% C-S-H addition at selected hydration times are shown in Fig. 6. Two endothermal peaks are observed for the control C3S
sample (Fig 6-a) at 921 and 972 °C indicating the presence of unreacted C3S. These peaks
are observed for hydration times of up to 30 hours (not shown). The pure C3S undergoes two
endothermic events at these temperatures due to the crystalline transitions from triclinic to monoclinic and monoclinic to trigonal forms, respectively [ 31].
The systems containing synthetic C-S-H experience additional thermal events at temperatures between 800 and 900 °C. In addition to the peaks for the unhydrated C3S, Fig
6-b shows an exothermal peak exists in the C3S+20%C-S-H(C/S=1.2) sample at about 886
°C, the location of which is gradually shifted to about 898 °C after 30 hours of hydration. This peak is due to the phase pure synthetic C-S-H initially added to the mixture. The C-S-H has a sharp exothermal peak due to the conversion to β-wollastonite [ 32, 33]. The
The DSC curves for the C3S with C-S-H (C/S=0.8) addition are shown in Fig. 6-c. The
exothermic peak at 832 °C after 10min of hydration is from the synthetic C-S-H. The location of this peak is also shifted to higher temperatures (about 839 °C) at later hydration times suggesting a change in the thermal behavior of synthetic C-S-H addition. In this system, however, a new peak starts to appear after one hour of hydration at about 865 °C. The relative intensity of this peak increases with time. The peaks from the crystalline transformation of C3S are present in the seeded systems during these events.
The C-S-H produced in the hydration of the control C3S sample does not depict any
exothermal event (Fig. 6-a) at the hydration times examined in this study. This might be due the amorphous nature of the C-S-H from the hydration of silicate phases. At later times, however, a relatively small exothermal peak may appear at about 840-867 °C [ 34]. Synthetic C-S-H is a semi-crystalline material and has a high temperature exothermal behavior (as shown in Figs. 6-b and 6-c) due to the conversion to β-wollastonite [ 32, 33]. The broadening of this exothermal peak in Fig. 6-b and the formation of the new exothermal peak in Fig. 6-c as the hydration process is advanced may, therefore, be due to another C-S-H phase that has more ordered structure than that in the control sample and is apparently different in nature from the C-S-H produced in the hydration of pure C3S. It is suggested that the C-S-H that
nucleated and grew on the surface of the C-S-H seed is responsible for the changes in the exothermal events observed in Figs. 6-b and 6-c. This type of C-S-H is likely to have a more developed nanostructure than that forming on the surface of C3S and, unlike it, can be
converted to β-wollastonite. XRD analysis was conducted on the seeded systems in order to obtain additional support for the crystallinity of the new hydration products. The results, however, did not provide any conclusive information in this regard. The location and sharpness of the XRD peaks (primarily due to the semi-crystalline seed) did not change after the nucleation of the C-S-H product on the surface of the seed.
As mentioned, the new exothermal peak (in Fig. 6-c) occurs at temperatures higher than that for the peak associated with the conversion of synthetic C-S-H (C/S=0.8) to β-wollastonite. In the C3S–C-S-H (C/S=1.2) system (Fig. 6-b) this peak is obscured due to the broadening of
the exothermal peak of the C-S-H seed as hydration progresses. In both seeded samples, a shift is observed in the location of the exothermic peak of synthetic C-S-H to higher temperatures at later times. It has been shown previously that the location of this exothermal event is dependant on the stoichiometry of the C-S-H. A higher C/S ratio C-S-H exhibits the exothermal conversion to β-wollastonite at higher temperatures [ 32]. It is, therefore, suggested that in each seeded system, the C/S ratio of the new semi-crystalline C-S-H phase forming on the surface of the C-S-H seeds is proportionally higher than the C/S ratio of the seed itself. It should also be noted that the average C/S ratio in hydrated silicate phases of Portland cement is about 1.75 [ 35]. It is suggested, accordingly, that the chemical composition of the C-S-H product can be modified through the addition of various types of C-S-H seeds having selected C/S ratios. This may provide a unique tool for engineering the properties of the cement-based materials.
3.4. 29Si MAS NMR
Nuclear magnetic resonance (NMR) spectroscopy is a powerful technique that has proven very useful in a wide range of applications in cement chemistry [ 36, 37]. In the current study, the 29Si MAS NMR was conducted on control and seeded C3S samples (having 20% addition
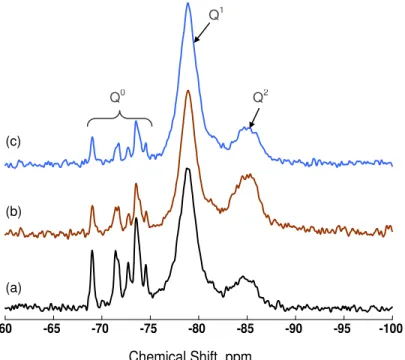
of C-S-H, C/S=0.8 and 1.2) in order to investigate the extent of polymerization in the hydration products after 1 week of hydration. The 29Si MAS NMR spectra of the samples are shown in Fig. 7. They all have similar features in terms of the chemical shift of the peaks. The first set of signals from -68 to -75 ppm labeled Q0 are due to the isolated (uncondensed) silicate tetrahedron at various locations in the crystal structure of unhydrated C3S [ 38]. The
two broad signals located at about -79 and -84 ppm are referred to as Q1 and Q2, respectively. These two signals are due to the silicon atoms in the silicate chain of the C-S-H [ 39]. Q1 corresponds to the end chain silicate tetrahedra and the Q2 is from the middle chain or bridging tetrahedra. Both synthetic C-S-H and the C-S-H product have Q1 and Q2 signals, which overlap in the spectra shown in Figs. 7-b and 7-c. It is therefore desirable to separate the contribution from each of these phases in the spectra in order to evaluate the silicate
Quantitative 29Si MAS NMR analysis of the absolute concentration of Si atoms in different environments was accordingly conducted on the hydrated samples as well as the initial pure phases. Na Y zeolite (Si/Al=2.9) was used as the reference material. The spectra were deconvoluted in order to calculate the integral intensity of each peak employing Lorentzian lines using DMFit software [ 24]. The values of the integral intensity of Q0, Q1 and Q2 sites for various samples are presented in Table 2. The integral area under the spectrum for the reference zeolite sample was calibrated for the number of scans and the mass of silicon atoms in the sample. It is therefore possible to calculate the mass of silicon atoms associated with various Q sites based on their integral intensity normalized for the number of scans. The mass of a specific chemical compound can then be determined knowing the mass percentage of Si in its molecular weight.
The amount of unreacted C3S was calculated according to this procedure based on the
integral intensity (i.e. the area under the spectrum) of the Q0 sites and assuming that C3S has
a chemical formula of Ca3SiO5 [ 2]. The degree of hydration can then be determined knowing
the amount of initial C3S in the mixture. A more convenient approach using only the integral
intentity measurement of Q0 could be applied had the C3S not been mixed with C-S-H seeds
[ 37]. Similarly, the Q1 and Q2 peaks associated solely with the hydration process can be determined for the blended samples by subtracting the signal produced by the synthetic phases. The normalized area under each peak (Q1 and Q2) was initially determined for the
phase pure C-S-H samples (C/S=0.8 and 1.2) using 29Si MAS NMR. A factor of the
normalized area (for the percentage of C-S-H addition and total mass of the sample) was then subtracted from the area of the corresponding signal (Q1and Q2) in the NMR spectra in Fig. 7. The remaining value is, therefore, due to the C-S-H that is produced in the hydration of C3S. The extent of the silicate polymerization in the hydration products (Q2/Q1 ratio) can
then be simply expressed as the ratio of the calculated areas for Q1 and Q2 sites for the new C-S-H. The summary of the results calculated based on the quantitative 29Si MAS NMR
It is shown that the degree of hydration is significantly higher when synthetic C-S-H is added to the C3S (Table 2). The increase of the degree of hydration has been observed previously
for similar seeded systems [ 13]. The observations from conduction calorimetry and SEM are consistent with these results. It seems that the C-S-H seeds accelerate the dissolution of the C3S particles during the initial hydration times before setting. A significant amount of
hydration products are formed on the surface of the added synthetic C-S-H.
It is suggested that the formation of the hydration products on the surface of synthetic C-S-H rather than the surface of the C3S increases the amount of exposed C3S surface as compared
to the control samples, allowing a greater rate of C3S dissolution and increased hydration
activity during the hydration process.
The Q2/Q1 ratio is directly related to the mean silicate chain length and the extent of the condensation of silicate in layered silicate systems [ 4, 37]. The degree of polymerization values calculated for the samples have some interesting aspects. The synthetic C-S-H is more polymerized at lower C/S ratios. It is known that the decrease in the C/S ratio of the C-S-H results in an increase in the degree of silicate polymerization (i.e. relatively longer silicate chains with only few defects due to the omitted bridging tetrahedra). The Q1 signal appears
as a shoulder of the Q2 signal in low C/S ratio H systems whereas in high C/S ratio C-S-H the Q1 and Q2 signals are well-separated. The Q2/Q1 ratio is quantified after the deconvolution of the peaks in the spectrum. The relatively high Q2/Q1 values have been previously reported [ 39] similar to the value of 3.55 for the C/S=0.8 C-S-H. At higher C/S ratio C-S-H systems (including the C-S-H that forms in the hydration of cement phases) the silicate chains primarily consist of dimers and the Q2/Q1 ratio is thus lower than that for the low C/S ratio C-S-H. As shown in Table 2, the Q2/Q1 ratio of the C-S-H that is produced in the hydration of C3S is lower than that in the synthetic C-S-H indicative of shorter silicate
chains containing a greater number of defect sites. This ratio, however, increases for the C-S-H produced in the presence of synthetic C-S-C-S-H. The effect is slightly higher when low C/S ratio C-S-H is used for seeding compared to the case of C-S-H having C/S=1.2. It should be
This observation can be plausibly explained by the nucleation and growth model described by Gartner [ 40]. According to this model, the new C-S-H grows at the end of the initial nucleated C-S-H sheets (or from the C-S-H seeds in the current work) and therefore develops a similar structure to that of the sheets on which it is nucleating. It is reasonable to assume that the C-S-H growing through this mechanism may also have a similar silicate structure to that of the C-S-H seed (i.e. mimicking the nanostructural features of the nucleation site). This behavior can explain the dependence of the Q2/Q1 ratio in the C-S-H product to the C/S ratio of the C-S-H seed. One can expect that the silicate polymerization and chemical composition of the hydration products of silicate phases can easily be manipulated through C-S-H seeding if a wider range of C/S ratio is employed. This effect that was also observed in the DSC results has important practical implications as the chemical and mechanical properties of C-S-H are largely controlled by its C/S ratio [ 19, 20]. It may, therefore, be possible to employ C-S-H seeding in order to produce cement-based systems having a specific durability and engineering performance.
4. Concluding remarks
The mechanism of C-S-H seeding in cement systems employing advanced analytical tools such as quantitative 29Si MAS NMR was studied for the first time. C-S-H seeding was shown to be very effective in accelerating the hydration of C3S. The location of the maximum rate
of heat development (after the dormant period) was shifted to earlier times by as much as 6
hours when synthetic C-S-H was added to the C3S. The dissolution of C3S into the aqueous
solution and the rate of heat development due to the formation of C-S-H were significantly increased. It was shown (by the direct evidence using SEM analysis) that, in modified systems, the C-S-H produced in the hydration of C3S nucleates and grows on the surface of
the synthetic C-S-H. The extent of the silicate polymerization of the C-S-H product was measured through quantitative NMR calculations. It was found that the Q2/Q1 ratio of the C-S-H product can - be modified depending on the stoichiometry and silicate polymerization of the S-H seeds. This was corroborated by the DSC results suggesting the fromation of a C-S-H phase having exothermal behaviour at high temperatures. Futher experimental investigations including spatially resolved techniques and chemical analysis of the pore solution are still required to better understand the mechanism and chemistry of C-S-H seeding.
It should, therefore, be possible to tailor the properties of the hydration products in cement-based materials through controlled metamorphosis method by modifying the hydration process in order to produce a specific C/S ratio C-S-H. The stoichiometry of the C-S-H (as expressed by its C/S ratio) primarily influences its chemical and mechanical properties. Cementitious systems can thus be engineered by controlling the type and the amount of synthetic C-S-H in order to obtain a specific mechanical performance or chemical stability. This should provide a unique opportunity in order to engineer the properties of concrete materials in the future. Moreover, the nucleation of C-S-H on the surface of seeds is suggested to result in the formation of a more homogenous and well distributed hydration material compared to the control C3S where C-S-H essentially precipitates on the surface of
C3S particles. The better distribution of hydration products through C-S-H seeding is likely
to improve mechanical properties and durability characteristics of the hydrated cement system such as strength and permeability.
References
1 Lea F. M. “The constitution of Portland cement,” Quarterly Reviews of the Chemical
Society, 3, 82-93, DOI: 10.1039/QR9490300082, 1949.
2 Taylor H. F. W., Cement Chemistry – 2nd edition, Thomas Telford Publishing, pp 459, 1997. 3 Ramachandran V. S., Concrete Admixtures Handbook, Noyes Publications, Park Ridge NJ,
pp 626, 1984.
4 Ramachandran V. S. and Beaudoin J. J. (edt.), Handbook of Analytical Techniques in Concrete Science and Technology, William Andrew, pp. 964, 2001.
5 Ramachandran V. S., Paroli R. M., Beaudoin J. J., Delgado A. H., Handbook of Thermal Analysis of Construction Materials, Noyes Publications/William Andrew Publishing, pp. 680, 2003.
6 Angstadt R. L. and Hurley F. R. “Hydration of the alite phase in Portland cement,” Nature, 197, 688, 1963.
7 Odler I. “Hydration, setting and hardening of Portland cement” in Lea’s Chemistry of Cement and Concrete – 4th edition, edited by Hewlett P. C., pp. 1053, 1998.
8 Sato T., Beaudoin J.J. “The Effect of nano-sized CaCO3 addition on the hydration of cement
paste containing high volumes of fly ash,” 12th International Congress on the Chemistry of Cement, Montreal, QC. July 08, 2007, pp. 1-12.
9 Beedle S. S., Groves G. W., Rodger S. A. “The effect of fine pozzolanic and other particles on the hydration of C3S,” Advances in Cement Research, 2 [5] 3-8, 1989.
10 Lindgreen H., Geiker M., Krøyer H., Springer N., Skibsted J. “Microstructure engineering of Portland cement pastes and mortars through addition of ultrafine layer silicates,” Cement
and Concrete Composites, 30, 686-699, 2008.
11 Davis R. W. and Young J. F. “Hydration and Strength Development in Tricalcium Silicate Pastes Seeded with Afwillite,” Journal of the American Ceramic Society, 58 [1-2] 67-70, 1975.
12 Gartner E. M. and Gaidis J. M. “Hydration Mechanisms, I,” 95-125 in Materials Science of Concrete, edt. I. J. Skalny. American Ceramic Society, Westerville , OH , 1989.
13 Li Y. and Tang E. “Investigation of modified microstructure of hardened cement paste with C-S-H and Dehydrated C-S-H phase,” J. Chinese Ceramic Society, 19 [4] 373-380, 1991.
14 Thomas J. J., Jennings H. M., Chen J. J. “Influence of nucleation seeding on the hydration mechanisms of tricalcium silicate and cement,” Journal of Physical Chemistry C, 113, 4327-4334, 2009.
15 Tiaklsky P. J., Scheetz B. E., Garvey J. J., Grant B and Thompson J. “Long-term influence of alkaline earth silicate admixtures on the microstructural development of structural concrete,” Proc. 21st Int. Conf. On Cement Microscopy, Las vegas, Nevada, 266-272, 1999.
16 Scheetz B. E., Tikalsky P. J. and Badger S. “Control of the microstructure of concrete: a case for nanometer-sized seeding,” Proc. 11th Int. Cong. On the Chemsitry of Cement, edt.
Grieve G. and Owens G., Durban, South Africa, 1692-1699, 2003.
17 Makar J. M. and Chan G. “Derivative conduction calorimetry,” 12th International Congress on the Chemistry of Cement, Montreal, Canada, 1-12 (CD), July 7-12, 2007.
18 Taylor H. F. W. “Hydrated calcium silicates. Part I. Compounds formation at ordinary temperatures,” Journal of the Chemical Society, 3682-3690, 1950.
19 Alizadeh R., Beaudoin J.J., Ramachandran V.S., Raki L. “Applicabiliy of Hedvall effect to study the reactivity of calcium silicate hydrates,” Journal of Advances in Cement Research, 21 [2] 59-66, 2009.
20 Alizadeh R., Beaudoin J.J., Raki L. “Dynamic mechanical analysis of calcium silicate hydrates,” submitted to the Journal of American Ceramic Society, pp.1-42, 2009. 21 Bentz D. P. “A review of early-age properties of cement-based materials,” Cement and
Concrete Research, 38, 196-204, 2008.
22 Makar J. M., Chan G. W., Esseghaier K. Y. “A peak in the hydration reaction at the end of cement induction period,” Journal of Materials Science, 42 [4], 1388-1392, 2007.
23 Makar J. and Chan G. W. “End of induction period in ordinary Portland cement as examined by high-resolution scanning electron microscopy,” Journal of the American Ceramic
Society, 91 [4], 1292-1299, 2008.
24 Massiot D., Fayon F., Capron M., King I., Le Calvé S., Alonso B., Durand J.-O., Bujoli B., Gan Z., Hoatson G. “Modelling one- and two-dimensional solid-state NMR spectra,”
Magnetic Resonance in Chemistry, 40[1], 70-76, 2002.
25 Wu Z-Q. and Young J. F. “The Hydration of tricalcium silicate in the presence of colloidal silica," Journal of Materials Science, 19, 3477-3487, 1984.
26 Ramachandran V.S., Chun-Mei Z. “Dependence of fineness of calcium carbonate on the hydration behavior of tricalcium silicate,” Durability of Building Materials, 4, 45-66, 1986. 27 Ramachandran V.S. “Hydration reactions in cement containing condensed silica fume,”
International workshop on condensed silica fume in concrete, Montreal, May 1987, pp. 1-6. 28 Kondo R. and Daimon M. “Early Hydration of Tricalcium Silicate: A Solid Reaction with
Induction and Acceleration Periods,” Journal of the American Ceramic Society, 52 [9], 503 – 508, 1969.
29 de Jong J. G. M., Stein H. N., Stevels J. M., Written discussion of the paper entitled “Hydration of Portland Cement” by Copeland L. E. and Kantro D. L. (pp. 387-420 in Proceedings of the 5th International Symposium on the Chemistry of Cement, Tokyo, Japan, 1968), 420-421, Vol. 2. Cement Association of Japan, Tokyo, Japan, 1969.
30 Richardson I. G., “The nature of C-S-H in hardened cements,” Cement and Concrete
Research, 29, 1131-1147, 1999.
31 Ramachandran V. S., Applications of Differential Thermal Analysis in Cement Chemistry, Chemical Publishing Company Inc., New York, pp. 308, 1969.
32 Kalousek G. L. “Application of differential thermal analysis in a study of the system lime-silica-water,” Proceedings of the third international symposium on the chemistry of cement, London U.K. (1952), 296-311, 1954.
33 Taylor H. F. W. “Hydrated calcium silicates. Part V. the water content of calcium silicate hydrate (I),” Journal of Chemical Society, DOI: 10.1039/JR9530000163, 163-171, 1953. 34 Diamond S., Dolch W. L., White J. L. “Studies on tobermorite-like calcium silicate
hydrates,” Highway Research Record, 62, 62-79, 1964.
35 Richardson I. G., “The calcium silicate hydrates,” Cement and Concrete Research, 38, 137-158, 2008.
36 Clayden N. J., Dobson C. M., Hayes C. J. and Rodger S. A. “Hydration of tricalcium silicate followed by solid-state 29Si N.M.R. spectroscopy,” Journal of the Chemical Society,
Chemical Communications, 1396-1397, 1984.
37 Colombet P., Grimmer A.-R., Zanni H. and Sozzani P. (eds.) Nuclear Magnetic Resonance Spectroscopy of Cement-Based Materials, Springer, pp. 430, 1998.
38 Bresson B., Meducin F., Zanni H. “Hydration of tricalcium silicate (C3S) at high
temperature and high pressure,” Journal of Materials Science, 37, 5355-5365, 2002.
39 Cong X. and Kirkpatrick R. J., “29Si MAS NMR Study of the Structure of Calcium Silicate Hydrate,” Adv. Cem. Based Mat., 3, 144-156, 1996.
40 Gartner E. M. “A proposed mechanism for the growth of C-S-H during the hydration of tricalcium silicate,” Cement and Concrete Research, 27 [5], 665-672, 1997.
Table 1. Time (hours) at which the maximum value in the peak of the rate of heat development curve occurs. This time is 9.5h for the control C3S.
Amount of C-S-H Addition
5% 10% 20%
C3S+C-S-H (C/S=0.8) 6.7 5.9 3.1
C3S+C-S-H (C/S=1.2) 7.1 6.3 4.7
Table 2. Integral intensity of the Q sites, degree of hydration and silicate polymerization in the C3S and C3S–C-S-H samples after 1 week of hydration based on quantitative 29Si MAS NMR.
Integral Intensity, % Degree of
Hydration, % Silicate Polymerization (Q
2
/Q1)
Q0 Q1 Q2 Total C-S-H C-S-H Seed C-S-H Hydration
Product C3S 24.1 61.5 14.4 75 0.23 --- 0.23 C3S+20%C-S-H (C/S=0.8) 10.0 53.6 36.4 91 0.68 3.55 0.29 C3S+20%C-S-H (C/S=1.2) 8.3 72.4 19.3 90 0.27 0.32 0.25 24/31
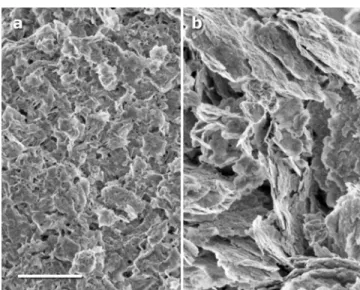
Figure 1. The Morphology of the synthetic C-S-H (a: C/S=0.8, b: C/S=1.2) used as seeding agents during the hydration of C3S. The white scale bar indicates 1μm. (40K magnification)
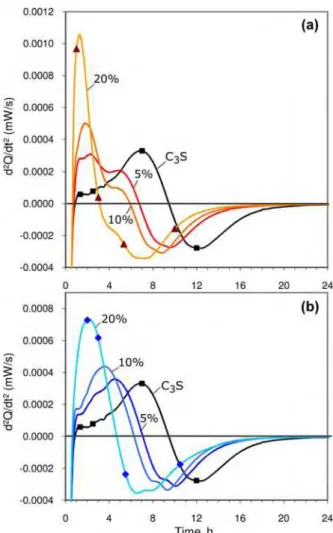
Figure 2. Rate of heat development recorded by isothermal conduction calorimetry for C3 S–C-S-H systems containing various amounts (per mass of C3S) of synthetic C-S-H addition compared with that for the control C3S. a: addition of C-S-H(C/S=0.8), b: addition of C-S-H (C/S=1.2). Markers indicate the time at which samples were taken for other analyses.
Figure 3. The derivative analysis of the rate of heat development curves in Fig. 2 for various amounts of C-S-H addition to C3S; a:C/S=0.8, b:C/S=1.2.
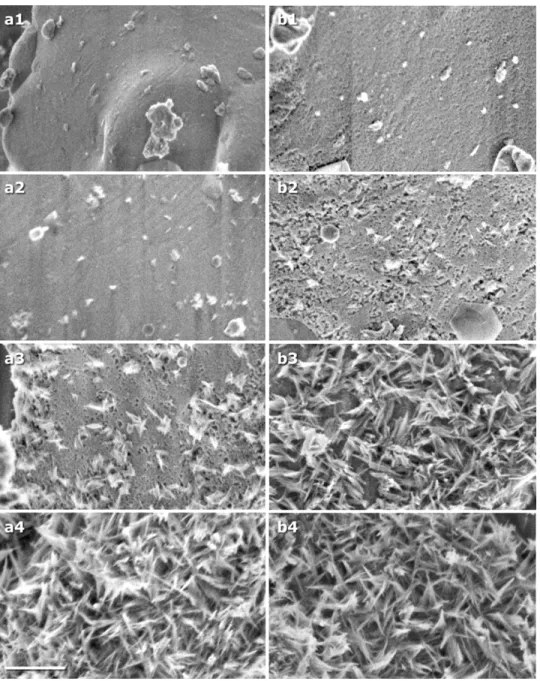
Figure 4. SEM micrographs of the evolution of the surface of C3S at various hydration times. Series a (control sample); a1:20min, a2:1h20min, a3:2h30min, a4:7h. Series b (C3S in the presence of synthetic C-S-H (C/S=0.8)); b1:10min, b2:1h, b3: 3h. b4:10h. The white scale bar indicates 500nm. (80K magnification)
Figure 5. SEM image of the surface of synthetic C-S-H seeds (a:C/S=0.8, b:C/S=1.2) after 3 hours of the hydration of C3S showing the nucleation of needle-like C-S-H products. The white scale bar indicates 500nm. (80K magnification)
Figure 6. DSC curves of the hydrated samples at various times. a: C3S, b: C3 S+20%C-S-H(C/S=1.2), c: C3S+20%C-S-H(C/S=0.8). The curves are offset along the y-axis for clarity. Markers in Figure 7-b and 7-c indicate the exothermal conversion of synthetic C-S-H seed to β-wollastonite at temperatures depending on the lime to silica ratio of the C-S-H; ◊: C/S=1.2, ∇: C/S=0.8.
Chemical Shift, ppm -100 -95 -90 -85 -80 -75 -70 -65 -60 1 Q Q Q0 2 (a) (b) (c)
Figure 7. 29Si MAS NMR spectra of the C3S–C-S-H systems hydrated for 1 week; a: control C3S, b: C3S+20%C-S-H(C/S=0.8), c: C3S+20%C-S-H(C/S=1.2).