Brightbeat: Effortlessly influencing breathing for
cultivating calmness and focus
by
Asma Ghandeharioun
B.S., Sharif University of Technology (2014) Submitted to the Program in Media Arts and Sciences in partial fulfillment of the requirements for the degree of
Master of Science in Media Arts and Sciences at the
MASSACHUSETTS INSTITUTE OF TECHNOLOGY September 2016
@
Massachusetts Institute of Technology 2016. All rights reserved.A uthor ...
Certified by...
Signature redacted
Program in Media Arts and Sciences August 5, 2016
Signature redacted
Rosalind W. Picard Professor of Media Arts and Sciences Director of the Affective Computing Group Massachusetts Institute of Technology
Accepted by ...
Signature redacted
Thesis Supervisor MASSACHUSETTS INSTITUTE OF TECHNO GY
DEC 12
2016
Pattie Maes Academic Head Program in Media Arts and Sciences Massachusetts Institute of TechnologyBrightBeat: Effortlessly Influencing Breathing for Cultivating
Calmness and Focus
by
Asma Ghandeharioun
Submitted to the Program in Media Arts and Sciences
on August 5, 2016, in partial fulfillment of the
requirements for the degree of
Master of Science in Media Arts and Sciences
Abstract
There are many health-related risks associated with chronic stress. One approach for ad-dressing this issue comes from strengthening inside self-regulation abilities rather than eliminating outside sources of stress. However, technology has not been explored to its full potential for delivering calming interventions. While many of the persuasive tech-nologies developed for fostering behavior change focus on cognitive processes, little at-tention has been given to influencing behavior through automatic processes of the brain.
Considering the bidirectional relationship between psychophysiological signals and self-reported emotional states, manipulating the physiological signals that a human being has voluntary control over is promising for achieving a desired emotional state. In this work, we focus on respiration due to the fact that it is both a voluntary and involuntary response of the body. It is a good indicator of stress, but can also be manipulated to induce calmness.
This thesis introduces BrightBeat: a set of seamless visual, auditory, and tactile in-terventions that mimic a calming breathing oscillation with the aim of influencing phys-iological syncing and consequently bringing a sense of focus and calmness. These inter-ventions are designed to run easily on commonplace personal electronic devices, respect the user's privacy, and to not require constant focus or attention in order to be effective. We have designed BrightBeat interventions iteratively and have examined both objective and subjective measures of impact through a series of studies with N=54 users in total. From an objective perspective, BrightBeat interventions significantly influenced calmer (slower) breathing and had a lasting influence. From a subjective perspective, considering the individual differences, these interventions have been shown to improve self-reported calmness and focus. Also, participants reported high preference for using them in the future.
This work has been supported by the Robert Wood Johnson Foundation and the MIT Media Lab Consortium.
Thesis Supervisor: Rosalind W. Picard Title: Professor of Media Arts and Sciences Director of the Affective Computing Group Massachusetts Institute of Technology
The following served as readers for this document:
Thesis Supervisor
Signature redacted
Rosalind W. Picard Professor of Media Arts and Sciences Director of the Affective Computing Group Massachusetts Institute of Technology
Signature redacted
T hesis R eader ... . . . ..0-
-Pattie Maes Professor of Media Arts and Sciences Director of the Fluid Interfaces Group Massachusetts Institute of Technology
Thesis Reader...Signature
redacted..
Sepandar Kamvar Associate Professor of Media Arts and Sciences Director of the Social Computing Group Massachusetts Institute of Technology
Acknowledgments
I am honored to call professor Rosalind Picard my mentor and advisor. She is an
in-spiration to me. In the past two years, her enthusiasm and curiosity has astonished me and her endless support, encouragement, and guidance has helped me immensely. I'm very grateful for her and for being given the chance to learn from her. Her nice and compassionate attitude has made many of my days in the past two years. I would like to express my deepest appreciations to professor Pattie Maes and Sepandar Kamvar for sharing their time and insightful comments with me and helping me see every question more thoroughly and thoughtfully.
I would like to thank all my friends and colleagues in the affective computing group
whom I've learned a lot from directly and indirectly: Vincent Chen, Karthik Dinakar, Micah Eckardt, Szymon Fedor, Javier Hernandez, Natasha Jaques, Kristy Johnson, Grace Leslie, Daniel Lopez, Ehi Nosakhare, Akane Sano, Sara Taylor, Craig Ferguson, and Rashmi Karki. I would like to specially thank Asaf Azaria for helping me become a more grateful person.
I'm thankful to the media lab and to MIT for all the chances I've been given to explore my passion without limits. The abundance of resources and talent has always aspired me.
I am very grateful for being surrounded by the smartest and most driven people in the
world from different parts of the world.
I'm forever grateful to my family and I have no words to thank them enough for their unconditional love and support which has helped me grow as a person. I specially thank my mom for being very close no matter how many miles away we are and for teaching me to work hard for what I care about. I thank my sisters for instilling curiosity in me as a kid and for being my closest friends as an adult. I thank my brother for all the fun memories we have together that still make me laugh even when I'm down. I thank my dad for teaching me to stay calm by example rather than by words.
I would like to express my sincere gratitude to Ardavan for his endless love and
sup-port and for helping me develop a growth mindset. He has taught me to be persistent in taking baby-steps of self-improvement and growing as a person. Nothing is more com-forting than his calmness, optimism, patience, and understanding.
I thank my friends in different states of the US, Iran, and Switzerland for supporting
me through all my ups and downs and for being there for me at the face of difficulty. It's their love and friendship that keeps me sane. I wish there were no geographical boundaries and I could go give a hug to each one of them and express my deepest gratitude in person! Last but not least, I would like to thank the participants of the series of studies I've run for all their valuable input that has helped improve this work.
Contents
1 Introduction 17 1.1 M otivation . . . . 17 1.2 O utline . . . . 18 1.3 Contributions . . . .. . . . . 19 2 Background 21 2.1 Breathing and calmness . . . . 212.1.1 Stress and physiological response . . . . 21
2.1.2 Self-regulation through voluntary respiratory modification . . . . 23
2.2 Technology and meditative experience . . . . 25
2.2.1 Desktop and mobile applications . . . . 25
2.2.2 Sensors and biofeedback . . . . 26
2.2.3 Virtual environments . . . . 29
2.2.4 Responsive environments and objects . . . . 30
3 BrightBeat: A set of unobtrusive calming interventions for personal use 35 3.1 Physiological synchrony . . . . 35
3.2 BrightBeat design . . . . 36
4 Experiment 1 - Manual 39 4.1 Pilot study I . . . . 39
4.1.1 System design . . . . 41
4.1.2 Study protocol and deployment . . . . 42
4.1.3 Results . . . 44
5 Experiment 2 -Automated 51 5.1 Pilot study 2 . . . . 51
5.1.1 System design . . . . 51
5.1.2 Study protocol and deployment . . . . 53
5.1.3 R esults . . . . 56
5.2 Main study . . . 60
5.2.1 System design . . . 60
5.2.2 Study protocol and deployment . . . 61
5.2.3 Results . . . . 63
6 Conclusions and future work 69 6.1 Conclusions . . . . 69
6.2 Future work . . . . 70
A Detailed data analysis plots 73
List of Figures
2-1 2-2 2-3 2-4 2-5 The LifeShirt . . . . FlexComp . . . . Zephyr BioHarness . . . . Spire tracker . . . . Leaf, Prana, and Apple watch meditation app. . . . 27 . . . . 27 . . . . 27 . . . . 28 . . . . 29 . . . . 31 2-6 VMW virtual environment 2-7 2-8 2-9 2-10 BodyVis . . . . SonicCradle meditation chamber ExoBuilding adaptive architecture Ambient lighting biofeedback . 3-1 Schematics of BrightBeat systems. . . . . 4-1 Pilot I -System design . . . . 4-2 Pilot I -Experiment design . . . . 4-3 Pilot I -Sample intervention user . . . . 4-4 Pilot 1 -Sample control user . . . . 4-5 Pilot I -The average breathing rate of all the participants during different tasks ... ... 4-6 Pilot 1 -The task-by-task average difference between the BR and MBR . 4-7 Pilot I -Percentage of the time achieved the GBR in each task . . . . 4-8 Pilot I -Performance . . . . . . . . 31 . . . . 32 . . . . 33 . . . . 33 37 42 44 45 45 46 47 47 48
5-1 Schematic of pyzephyr and BrightBeat . . . . 52
5-2 Custom wristband with oscillating temperature. . . . . 53
5-3 Pilot 2 -System design . . . . 54
5-4 Pilot 2 -Experiment design . . . . 55
5-5 Pilot 2 -Sample control user . . . . 56
5-6 Pilot 2 -Sample intervention user . . . . 57
5-7 Pilot 2 -The task-by-task average difference between the BR and MBR 57 5-8 Pilot 2 -Percentage of the time achieved the GBR in each task averaged over all participants in each group . . . . 58
5-9 Pilot 2 -Percentage of the time achieved the GBR in each task . . . . 58
5-10 Pilot 2 -Performance . . . 59
5-11 Main -System design . . . 61
5-12 Main -Experiment design . . . 62
5-13 Main -The task-by-task average difference between the BR and MBR . . 63
5-14 Main - Percentage of the time achieved the GBR in each task averaged over all participants in each group . . . 64
5-15 Main -Percentage of the time achieved the GBR in each task . . . 64
5-16 Main -Performance . . . 65
A-I Pilot 1 - Box plot of breathing rate for each individual in control and intervention groups . . . . 73
A-2 Pilot 2 -Normalized amplitude versus breathing rate for each user . . . . 74
A-3 Pilot 2 - Box plot of breathing rate for each individual in control and intervention groups . . . . 74
A-4 Pilot 2 -The average breathing rate of all the participants during different tasks . . . ... .... ... ...75
A-6 Main -Box plot of breathing rate for each individual in control and
inter-vention groups . . . 77
A-7 Main -The average breathing rate of all the participants during different
tasks ... ... 78
A-8 Main -Timeline of self-reported calmness, focus, and valence throughout
the experim ent . . . . 79
A-9 Pilot 1 - Normalized histogram of future usage preference for the
inter-vention group . . . . 80
A- 10 Pilot 2 -Normalized histogram of future usage preference for the
inter-vention group . . . . 80
A-I I Main -Normalized histogram of future usage preference for the
List of Tables
4.1 Pilot I -Average user rating . . . 49
5.1 Pilot 2 -Average user rating . . . 60
5.2 Main -Average user rating . . . 66
5.3 Main -Average user rating for the participants with the preferred type of
Chapter 1
Introduction
1.1 Motivation
Chronic stress has been shown to negatively impact health and wellbeing in several ways.
For example, it affects the immune system [771, gastrointestinal [7], cardiovascular [4,86],
and neuropsychiatric [67] health. It also affects cognitive functions, memory, and learn-ing [3, 50]. This wide range of health- and wellbelearn-ing-related risks calls for minimizlearn-ing unnecessary stress in daily life situations. One way to tackle this issue is eliminating external stressors. However, stress is perceived differently among different individuals and there is no consensus around modeling stress or stressors. In fact, new directions are being suggested to address the limitations of previous models [51]. This motivates the idea of developing internal techniques to gain resilience against stress rather than fighting it externally.
Scientific evidence confirms that the relationship between breathing and regulatory effects is bidirectional. Stress has physiological indicators including changes in core tem-perature, cardiovascular tone, respiratory patterns, and more [20]. Among all, respiration has a unique characteristic of being both voluntarily and involuntarily controlled. Also, voluntary deep and slow breathing can induce physiological, affective, and cognitive calm
In the current day and age when individuals spend hours in front of screens, wear-ing headphones, or other wearable devices, technology can be a promiswear-ing medium for delivering seamless calming interventions throughout everyday life activities. However, little research has been conducted around conveying a portion of the positive influences of a meditative experience while being involved in daily activities. In fact, most of the technology designed for health and wellbeing related behavior change relies solely on cognitive processes of the brain rather than delivering an intervention that doesn't require constant attention. Adams et al. refer to the latter as mindless computing [I]. The lack of scalable systems for self-regulating that respect the user's privacy and don't require his/her constant attention and instead mostly rely on the automatic processes of behav-ior change has motivated this thesis. Thus, this thesis ironically uses the techniques from mindless computing to promote a respiratory induced mindful state in everyday activities.
1.2 Outline
The next chapter provides a literature review about stress and its physiological manifesta-tion and why breathing is a good candidate for self-regulamanifesta-tion. It then reviews the existing technologies and systems that facilitate measuring or influencing breathing which directly or indirectly have addressed a meditative experience. This motivates the third chapter, which provides examples of physiological synchrony and introduces a series of inter-ventions where commonplace technological devices mimic a calming breathing signal in order to ease self-regulation and induce calm. We call these interventions BrightBeat. Chapter 4 and 5 explain manual and automated versions of BrightBeat, providing detailed explanation of the system design, user study protocol and deployment, and finally demon-strating results both in terms of self-reported changes and physiological data. Chapter 6 concludes by summarizing the impacts of BrightBeat interventions and providing future directions.
1.3
Contributions
This thesis contributes to bringing mindfulness to every day activities through iterative design and implementation of a series of interventions, BrightBeat, that respect individ-ual differences and privacy and validates them through structured user studies. BrightBeat users had slower relative breathing rates and were able to achieve their goal breathing rate a higher percentage of the time. Also, BrightBeat is shown to improve self-reported focus and calmness. This thesis also tests the hypothesis of physiological syncing through inter-action with means of technology such as screens, headphones, and wristbands by detailed analysis of physiological data. It also replicates the results related to the relationship be-tween voluntarily slowing breathing rate and achieving an emotional state of calmness and focus.
Chapter 2
Background
2.1 Breathing and calmness
In this section, we briefly review the physiological responses of stress with a deeper focus on respiratory patterns. Then, we discuss self-regulation in relation to voluntary modifi-cation of breathing, summarizing the scientific evidence for the effectiveness of breathing exercises on patient and healthy populations both for treatment and improvement pur-poses.
2.1.1
Stress and physiological response
Psychologically, stress is a complex phenomenon. It is perceived and experienced differ-ently by different individuals, and even by the same person in different situations. Several
theories have been devised to model stress in the workplace [5, 10, 27,81,96]. However,
new directions are still being suggested to address the limitations of these models [51]. Under a broader umbrella, stress can refer to a spectrum ranging from negative (distress) to positive (eustress) [stimulation] [78].
As summarized by [9], the physiological response to stress starts with activating the hypothalamic pituitary adrenal axis (HPA) and the sympathetic nervous system (SNS).
The consequent release of several chemical mediators prepares the body for a fight-or-flight response which results in behavioral adaptations including increased arousal and alertness, improved cognition, focused attention, elevations in core temperature, suppres-sion of digestive function, growth, reproduction, and immunity, adaptive redirection of energy, increases in cardiovascular tone, respiratory rate, and intermediate metabolism. On the other hand, the parasympathetic nervous system (PNS), can either assist or inhibit the SNS by decreasing or increasing its activity respectively [20]. Thus, increased PNS activity can counteract the SNS response and return the body to a relaxed state.
In general, the stress response is meant to be short during which the suppression of growth, production, and immune system are beneficial or at least have no adverse conse-quences and improve chances of the individual for survival [20]. However, chronic stress can damage the body in different ways. To name a few, chronic stress has been shown to negatively impact immune system [77], gastrointestinal [7], cardiovascular [4, 86], and neuropsychiatric [67] health. It also affects cognitive functions, memory, and learn-ing [3,50].
As a result, successful stress regulation plays an important role in maintaining health and wellness. In this context, Porges has developed the "polyvagal theory" which explains the evolution of the vagus nerve and its role in the PNS system and relates the autonomic function to behavior [70]. This theory articulates three phylogenetic stages of the de-velopment of the vertebrate autonomic nervous system (ANS). The most evolved ANS component or "Myelinated vagus" causes advanced behavioral functions like social com-munication, self-soothing and calming, and inhibiting arousal. The second component or "Sympathetic-adrenal system" causes mobilization or active avoidance. The most prim-itive component, "Unmeyelinated vagus", causes immobilization such as death feigning, behavioral shutdown, or passive avoidance. These three circuits have a hierarchical struc-ture in which they respond to challenge. The less advanced circuits come into play only when the more evolved ones have failed.
re-lated to stress reactivity [32]. HRV is the physiological phenomenon of the variation of beat-to-beat intervals between consecutive peaks in an ECG signal [8]. More specifically, cardiorespiratory parameters like respiratory sinus arrhythmia (RSA) were put under the spotlight by Porges through the development of polyvagal theory [69]. RSA is heart rate variability in synchrony with respiration, where beat-to-beat intervals are shortened during inspiration and prolonged during expiration [6]. He proposed RSA as a reliable continuous measure of the vagal brake which refers to the unique characteristics of the most evolved autonomic nervous system (ANS) component or "Myelinated vagus" [70]. More researchers witnessed the importance of respiratory functions in understanding au-tonomic mechanisms of the body [24].
Though respiration is primarily regulated for metabolic and homeostatic purposes, it can also change in response to emotions [37]. Many scholars have studied respiratory patterns as indicators of physiological emotional responses. Bloch et. al. showed respi-ratory patterns can distinguish between six basic emotions: joy-laughter, sadness-crying, fear-anxiety, anger, erotic love and tenderness [11]. A review by Boiten and his colleagues have summarized that primary correlates of respiratory patterns including rate, amplitude, and volume reflect general dimensions of emotional response such as calm-excitement, relaxation-tenseness, and active-passive coping [12, 13]. Butler et. al. showed RSA can indicate emotional reactivity and regulatory efforts [17]. Sturgeon et. al. showed RSA to be a promising indicator of resilience to pain [89].
2.1.2
Self-regulation through voluntary respiratory modification
Several ancient to contemporary practices have used breathing techniques for self-regulation. For example, Pranayama (a formal practice of controlling the breath), Qigong (a Chinese system for physical exercise and breathing control), and Alexander breathing technique (a technique to help with voice and breathing) are just a few. Besides practice, scientific ev-idence confirms the bidirectional relationship between breathing and regulatory effects.
Not only are respiratory patterns indicators of emotional reactivity, but also voluntary modification of breathing can influence emotional reactions. For example, Philippot et. al. conducted an interesting experiment composed of two studies. In the first study, par-ticipants were asked to produce specific emotions and describe the consequent breathing patterns. In the second study, the same breathing instructions were given to new par-ticipants to investigate the impact of manipulating respiration on emotional states. The purpose of the study was hidden from the participants through a cover story. Induced res-piration manipulation resulted in differentiated emotional feelings without participants' awareness of the process [66].
Deep and slow breathing has been widely used as part of relaxation techniques in pa-tient populations to treat somatic disorders such as hypertension and pulmonary diseases
[29,31], psychiatric disorders including anxiety and depression syndromes [15,45],
post-traumatic and other stress-related disorders [33,44,57,62,72], and substance abuse [16].
Not only in patient populations, but also in healthy individuals the physical and psycho-logical effects of deep breathing and meditation have been shown. For example, it im-proves cardiovascular health [74], mental function [82], and attentiveness [88], wellbeing, mood, and stress tolerance [14, 16]. Not only rate, but also the inhalation to exhalation ratio (i/e) has been shown to be related to the relaxation response [91].
Sighs are another respiratory behavior which our body uses as a healing process. Nor-mal breathing consists of considerable correlated variability and some random variability. It is known that negative emotions reduce correlated variability and sustained attention reduces total variability. Both conditions evoke spontaneous sighing which is related to subjective relief and restores respiratory variability influenced by stress or attention [94]. It has been shown that these healing characteristics are not exclusive to spontaneous sigh-ing. In fact, when physiologically appropriate, they follow instructed sighs as well [95].
The scientific evidence showing effectiveness of voluntary respiratory modification on emotional regulation calls for designing technologies that ease the regulatory process. In the next section, we provide a brief overview of the role that technology has played in
mediative practices that focus on breathing.
2.2
Technology and meditative experience
With the widespread use of smartphones, advent of wearable devices, and culture of spending countless hours with technological devices, meditative practices have found their way into technological devices. In this section, we review the connection between technology and meditative practices when it is combined with breathing, either by ad-dressing it, measuring it, or influencing it. We start with less interactive examples such as mobile applications that encourage deep breathing in a guided meditation training session and move to more interactive ones introducing sensors and biofeedback examples, virtual environments, and finally responsive environments and objects.
2.2.1
Desktop and mobile applications
There have been several attempts at building mindfulness training, meditation, or simply calming interventions in the form of desktop software or mobile applications. Headspace [41], Stop, breathe, and think [87], Calm [19], Chakra Meditation [63], Breathe [47], and Insight timer [42] are only a few out of many meditation applications that come with training session videos, audio recordings, music, and text. Some of them have incorpo-rated gamification [21] mechanisms to engage participants further and help create a habit of meditation practice. As mindful breathing has been an indispensable part of medita-tion, these apps, by extension, briefly touch breathing. A few apps have paid more overt attention to breathing. MyBreath Lite [40] is an interactive breathing training app which uses the smartphone's built-in microphone to capture breathing and provide real-time au-dio and visual feedback. Stress Doctor [39] is another app that introduces deep breathing techniques. In order to score the effectiveness of the exercise session, it also measures heart rate and heart rate variability (HRV) via smartphone's built-in camera.
problem of sedentary work style and long work sessions. CalmDown [23] is a desktop application for Mac for reminding a user to take breaks either in the form of going for a walk or deep breathing by fading in/out colors on the screen. More recently, the Let Me Relax [73] system has been developed. This system is a sedentary state recognition plat-form using accelerometer data from the smartphone and the smartwatch sensors. Then, it suggests simple relaxation techniques from a pool of interventions which include deep and slow breathing. A study with 22 participants showed that the system could help the intervention group reduce self-reported stress compared to the control group who didn't receive the relaxation notifications.
2.2.2
Sensors and biofeedback
Researchers and engineers have long been developing sensors for capturing physiology including respiration. FlexComp [49] is one of the early devices with high signal qual-ity. It is a wired device (Fig. 2-2), with a control module, where several encoders can be attached. The sensors include surface electromyography(sEMG), electrocardiography
(ECG), electroencephalography (EEG), skin conductance (SC), peripheral temperature,
blood volume pulse (BVP), respiration amplitude, goniometer adapter, and force adapter. Later, wearable measurement devices came out in different form factors. For example, LifeShirt [98] is a garment that measures physiology and also serves as an electronic diary of symptoms and activities. LifeShirt (Fig. 2-1) comes with embedded inductive plethysmography sensors. It continuously monitors respiration, heart activity, inductive cardiography, motility, and posture. The captured data are displayed and stored on a hand-held computer (Visor). After offline analysis, cardiorespiratory parameters like heart rate, RSA, tidal volume, stroke volume, pre-ejection period, apnea-hypopnea index,
thoraco-abdominal coordination, and sighing can be extracted. Zephyr BioHarness [65] is a more
recent device which is composed of a BioModule and an adjustable chest strap with con-ductive fabric sensors as shown in Fig. 2-3. It measures respiration (breathing waveform,
amplitude, rate), ECG data (heart rate, heart rate RR, heart rate variability and ECG), mo-tion (3-axis accelerometry, activity), posture, and temperature. The recorded data can be transmitted wirelessly, or downloaded offline. The strap sensor within the chest belt mea-sures the size differential between the expansion and contraction of the thoracic cavity and sends it to BioModule which produces the breathing waveform, estimates amplitude, and breathing rate. However, these devices were mostly designed as a tool for researchers and clinicians rather than focusing on the wearer and his/her needs and experiences.
Figure 2-3: Zephyr BioHar-ness
Figure 2-1: The LifeShirt Figure 2-2: FlexComp
McCraty is among the pioneers of scientifically using biofeedback for improving
well-ness through training, education, and self-monitoring 1521. He commercialized his
re-search through emWave, an ear-clip sensor for measuring PPG that comes with a mobile and desktop application. Through training sessions, it guides users toward larger RSA amplitude by calculating a coherence score based on HRV.
RESPeRATE 1431 is another device for guided breathing. This device composes
rhythmic guiding tones in real-time, while measuring the user's respiration pattern. It is cleared by the Food and Drug Administration (FDA) and is available without a pre-scription. It has been verified through clinical trials as an effective method for reducing blood pressure and thus has been used for the treatment of hypertension 125,931.
Figure 2-4: Spire tracker and charger (left) and components (right)
breathing measurement device and several feedback mechanisms while focusing on the end-user. He developed Breathbelt for ambulatory continuous measurement of breath rate. He introduced peripheral paced respiration (PPR) for visual pacing in parallel to information work by a bouncing bar on the desktop screen 154]. He later introduced social features to PPR and studied how they affected the user. He identified design principles
through an iterative design process 1551 and later implemented Breathaware, a gamified
drop-down menu in the system tray for informing users about their breathing by showing rate, estimating calm points, daily milestones, encouraging messages, and a buddy list.
A next iteration was breathTray and then Breathwear in a mobile context. He created
the "Calming Technology" lab at Stanford where they further studied inducing cognitive, affective, and physiological calm through technological interventions.
Moravji later created Spire [85], a wearable tracker that measures breathing patterns to encourage overall mindfulness and provide a more thorough guided meditation expe-rience. Spire (Fig. 2-4) is worn on a belt or bra and captures breathing by a pressure sensor.
In recent years, more and more wellbeing trackers are coming to market with an in-creased focus on breathing. Leaf 1901 is an example in the form of smart jewelry with motion sensors that can be worn as a necklace, bracelet, or snapped onto clothing. It has guided meditation sessions during which it captures respiration. Prana 17 1] is
an-other tracker that is worn in the waist area. Prana evaluates breath patterns differentiating between diaphragmatic and chest breathing and posture. It is accompanied with an app
10:09 Su m y 10:09
P AIRE 5r AP !ODA'
TA9e a minute to 5 MINS
Figure 2-5: Leaf fitness tracker (left), Prana posture and respiration tracker (middle), Apple watch meditation app (right)
that provides active training sessions and gamifies breathing exercises. Apple has also
an-nounced a mindfulness app, called Breathe, for Apple Watch in WWDC 2016 121. Breathe
coaches users through timed breathing sessions in order to help then de-stress. The app can be launched from the watch face or set up in advance with reminders and it measures heart rate throughout the session. Fig. 2-5 shows Leaf, Prana, and Breathe meditation app for Apple Watch.
2.2.3
Virtual environments
Virtual reality (VR) first came to existence through science fiction in 1935 197]. However, it soon evolved and now several VR headsets are available off-the-shelf including Oculus Rift, HTC Vive, Samsung Gear VR, Google cardboard, Microsoft HoloLens, and many more. VR has been widely used for entertainment including games, films, media, con-certs, museums, and theme parks. It has also been used in urban and architecture design and for retail purposes. Another VR usage has been in training, mostly for military appli-cations. VR provides a low- or no-risk simulated environment for training novice person-nel. Also, medical and therapeutic applications of VR have emerged recently. Surgical simulators 1841, exposure therapy for post traumatic stress disorder (PTSD) patients 1751,
treating anxiety and phobias [64] and acute pain [36,58,80] are a few examples. As VR is capable of engaging user's senses and recreating environments at low cost, it is also a good candidate for mindfulness meditation training [38].
Meditation chamber [79] is an immersive virtual environment primarily designed for meditation training and secondarily for reducing stress, anxiety, and pain. Meditation Chamber utilizes biofeedback sensors to monitor arousal. It then visually changes the virtual environment. Several visualizations have been implemented including setting sun and rising moon and mirroring actions during the progressive muscle relaxation. Results from a controlled study showed that the virtual environment has been more effective than the biofeedback alone.
Virtual Meditative Walk (VMW) [30] is another responsive virtual environment specif-ically designed to teach mindfulness based stress reduction (MBSR). The goal of MBSR is to enable people to reduce stress and improve their health via maintaining and im-proving psychological states. VMW (Fig. 2-6) allows users to walk in a virtual forest. It utilizes finger electrodes for measuring EDA and provides real-time visual and sonic feedback. The fog represents user's EDA levels and fades away when the EDA levels go down. Results from a study with chronic pain patients comparing the virtual environment to the control group were presented. The control users only practiced MBSR but did not interact with the VMW environment. The participants interacting with VMW reported reduced pain levels.
2.2.4
Responsive environments and objects
Recently, more immersive experiences have been created with the goal of cultivating mindfulness about body signals. This ranges from interactive objects to responsive ar-chitectures. Here, we mention the most prominent examples in this area.
Providing a physical responsive manifestation for the internal physiology can help interactive learning about the body states and processes and cultivating mindfulness about
Fig1ure 2-6: VMW virtual environment - As users reach an inferred meditative state, the
fog dissipates and the sounds become more audible and spatial.
Figure 2-7: BodyVis and its evolution though three rounds of prototyping
them. BodyVis 1601, an c-textile interactive shirt designed for children, is an example in
this area (Fig. 2-7). BodyVis has dynamically removable organs that communicate with a Zephyr BioHarness 1651 device and visualizes heart rate and breathing rate of the wearer.
It also has a touchscreen stomach and visualizes eating and digestion process.
SonicCradle 1921 is another example in the form of an interactive environment. It is
a dark and quiet chamber with a hammock chair surrounded by four speakers (Fig.
I
Figure 2-8: SonicCradle diagram and photograph
8). Participants' breathing is measured using Thought Technology sensors 1481 attached
to their abdomen and thorax. Software manipulates sound coming from different spatial directions in real-time using breathing data by changing volume, equalization, and re-verberation. The goal of SonicCradle is to provide a stress-relieving experience through which users gain a heightened breath awareness.
ExoBuilding 1761 is another example of an adaptive architecture which takes
physio-logical data into account. ExoBuilding (Fig. 2-9) utilizes a Mind Media NeXus 10 1591
device and finger electrodes to measure electroencephalogram (EEG), electrocardiogram
(ECG), respiration, and electrodermal activity (EDA). The size of the prototype is mapped
to the occupant's respiration. The embedded LEDs in the fabric blink with the same fre-quency as heartbeat and the speaker system sonifies the heartbeat. Graphics are projected on the fabric and their visibility corresponds to the EDA data. A controlled study compar-ing three conditions of static, regular movement, and biofeedback with ExoBuildcompar-ing sug-gested that the responsive environment condition successfully triggered behavioral and physiological changes such as lower respiration rates and higher respiration amplitudes compared to the other two conditions.
Another recent study applied biofeedback to ambient lighting in a home environment during which users could self-regulate their breathing patterns to improve their HRV 1991. Users wore a pulse sensor that communicated heart rate features to the environment. Light
Figure 2-9: ExoBuilding adaptive architecture: contracted (left) and expanded (right)
Lghtuintnsfty: Perodic Changes of Beat -beat interval LUght Colr Heart Rate Variabkity
Low HRV I V
Pulse sensor
Beat to Beat intervals and HRV value
Bio-Sgnal processing
Figure 2-10: Ambient lighting biofeedback. (a) biofeedback mechanism. (b) Traditional graphical interface. (c) Responsive environment.
intensity periodically changed to resemble beat-to-beat intervals and the light color would represent HRV value. A controlled study showed the effectiveness of the environment compared to a traditional graphical interface. Fig. 2-10 shows the experimental setting.
Chapter 3
BrightBeat: A set of unobtrusive
calming interventions for personal use
3.1
Physiological synchrony
In the previous sections, we mentioned the psychophysiological influences of voluntary breath modification. We also mentioned the role that technology has played in creat-ing meditative experiences and measurcreat-ing and influenccreat-ing respiratory patterns. However, most of these technologies are designed to require full attention of the user and are not designed to work while the user is engaged in everyday life activities (See examples in sections 2.2.1 and 2.2.2 and 2.2.3). Also, many of them primarily rely on user's motiva-tion and ability rather than the fast and automatic mental processes for behavioral change (which Adams et al. refer to as mindless computing [1]). More recent examples have ex-plored peripherally informing users [56]. However, they are still designed to engage the user cognitively rather than automatically influencing him/her. Other examples include creating more immersive experiences to convey biofeedback response to the user in an ambient manner (Section 2.2.4). However, these systems rely on extra resources which make them less scalable. Also, they don't preserve the privacy of the user as they broad-cast and magnify the physiological changes of the user into the physical environment.
Physiological synchrony and emotional contagion are known phenomena [34]. Lev-enson and Ruef have written a chapter in which they have provided several examples when ANS systems synchronize such as between patients and therapists, students and teachers, dyads and groups, mother and infant, spouses, and even in viewing oneself on videotape [46]. These examples show that the synchronization doesn't necessarily require participants to be intimately engaged in a face-to-face interaction, but can also happen across physical (in videotape) or interpersonal (between strangers) distance. This motivates further exploring the role of technology in this mirroring process.
In other contexts such as human circadian rhythm [22], technology has been shown to
affect the body's biological rhythm. Several scholars have studied the effect of evening exposure to LED-backlit displays on circadian physiology which results in delayed sleep (See [18] for example). Solutions such as the f.lux application [26] have evolved to adjust screen blue light emission to address such problems. These examples show technology can be a promising medium to influence biological rhythms for improving wellbeing.
3.2 BrightBeat design
In this regard, we have designed BrightBeat. BrightBeat recreates a rhythmic oscillation similar to a calming breathing signal in the form of visual, auditory, or haptic feedback which overlays what the user sees, hears, or senses. Its goal is to rely more on automatic processes of physiological syncing rather than cognitive effort for reaching a desired state. It comes in the form of a set of unobtrusive interventions to be used on personal elec-tronic devices to facilitate self-regulation while being engaged in other activities. These interventions are designed to require minimal cognitive attention to help self-regulate effortlessly. They utilize primary functionalities of personal electronic devices and are thus, scalable. They respect privacy of the user by providing seamless interventions on a personal level.
1
%140
Figure 3-1: Schematics of BrightBeat systems.
thermal feedback. Each of these components are standalone, but they can also be com-bined. The visual BrightBeat changes the brightness of the screen with the same fre-quency of a calming breathing rate. The brightness changes are barely observable and may not be noticed if the user is deeply focused on another task. The audio BrightBeat oscillates the volume with the same frequency while playing white noise through head-phones. We have chosen white noise in order to remove bias from playing specific type of music. However, the auditory component can also oscillate at ambient sound or music. Again, the minimum and maximum volume are barely audible. The thermal BrightBeat oscillates the temperature of a custom built wristband with the same frequency. The cool and warm temperature limits are minimally perceptible. Fig. 3-1 schematically illustrates an exaggerated version of the three mentioned modules.
In summary, we envisioned BrightBeat as a system that: * measures breathing unobtrusively;
" on a personal level, subtly notifies the user if (s)he is breathing too fast; * is easy to implement and scale;
The next two chapters describe the iterative process of designing BrightBeat interven-tions and their detailed explanainterven-tions through a set of user studies.
Chapter 4
Experiment
1
-
Manual
In order to understand how users respond to BrightBeat and test its efficacy, we developed a prototype with which participants interacted in the context of a lab study. This chapter explains the iterative process of the design of the initial system and the respective data analysis. Note that the focus of this study was to explore the idea of BrightBeat through iterations. As a result, instead of focusing on the functionality and fully automating the process, we rather focused on the design iterations and kept a human in the loop to accel-erate the implementation process. After building a proof-of-concept system and analyzing the initial user data, we found promising results. Thus, we improved the system and ran further studies which are explained in the next chapter.
4.1 Pilot study 1
As introduced earlier, we envisioned BrightBeat as a system that:
" measures breathing unobtrusively;
" on a personal level and in a calming manner, notifies the user if (s)he is breathing
Toward this end, we utilized Spire [85] for measurements. Spire is a stone-shaped wearable device that clips to clothing and measures physical movement, position, and breathing patterns using a pressure sensor. Spire has an iOS consumer app and an API. In terms of raw respiration data, the app interface shows a smoothed plot of breathing waveform. Also, through the API we have access to breathing rate in a given interval.
The first notification mechanism we came up with was mimicking inhalation and ex-halation by brightening and darkening the screen. Consequently, we developed a software with an interface for receiving raw breathing waveform and rate along with two param-eters, minimum (minB) and maximum brightness (MaxB) values. The software would mirror the user's breathing by altering screen brightness between the minimum and max-imum brightness limit. The brightness was matched to raw breathing waveform data.
In order to test the usability of the system, we recruited 3 participants (1 male) to interact with BrightBeat. We explained how the system works and that it's there to give users breathing awareness. We also instructed them to breathe deeply and slowly to self-regulate when stressed. Participants wore a Spire device and a Zephyr BioHarness and spent approximately 3 minutes listening to a calm piano piece of music. Due to un-availability of real-time breathing data by Spire's API, we utilized a wizard-of-oz method where the experimenter looked at the breathing waveform provided by the Spire app and changed the system's response manually. Afterwards, participants read news articles of their choice on a MacBook with BrightBeat installed on it for up to 20 minutes.
All participants mentioned that mirroring exact inhalation and exhalation, which is
usually irregular is stressful. They also mentioned it is hard to know if you are doing the correct thing when you are receiving feedback all the time. However, they liked the idea of being subtly informed about their breathing and preferred a more rhythmic feedback.
A user mentioned: "I knew breathing can calm you down (or at least I thought so). But I
haven't tried controlling it actively. I was surprised how powerful such a simple thing can be."
Based on users' feedback about the initial version of BrightBeat, we decided to up-grade to a rhythmic notification mechanism and test it with a larger group of people in a controlled lab study setting. This section explains the process in detail.
4.1.1
System design
To capture more detailed physiological data, we utilized Zephyr BioHarness [65] instead of Spire. This device is composed of a BioModule and an adjustable chest strap with conductive fabric sensors. It measures respiration (breathing waveform, amplitude, rate),
ECG data (heart rate, heart rate RR, heart rate variability and ECG), motion (3-axis
ac-celerometry, activity), posture, and temperature. The recorded data can be transmitted wirelessly, or downloaded offline via a docking cradle using the "Log downloader" win-dows application that comes with the device. The strap sensor within the chest belt mea-sures the size differential between the expansion and contraction of the thoracic cavity and sends it to BioModule which produces the breathing waveform, estimates amplitude, and breathing rate. To check the quality of Zephyr data, we also used SenseView [53] which is an Android application to visualize sensor readouts in real-time. It supports Zephyr BioHarness, but has access to a limited number of measurements. For example, it has access to breathing rate but neither amplitude nor waveform.
As per pilot participants' request, we turned constant feedback to a feedback that appears only if the user is breathing too fast. In this version, the system would monitor the user during a three-minute relaxation period and set a goal breathing rate (GBR) for each participant. Since breathing rate during cognitive tasks is naturally faster than during a relaxed state, and to account for individual differences in breathing habits, we defined GBR as a linear function of the user's mean breathing rate (MBR) during the relaxation period: GBR = MBR + 2. Whenever the user is breathing faster than GBR, BrightBeat would appear.
Inputs and devices
Exprientr nput tread BrightBeat 0 (brigtess)
Experiment
Zephyr
U'
Self-reported
measures Physiology Context
Logger
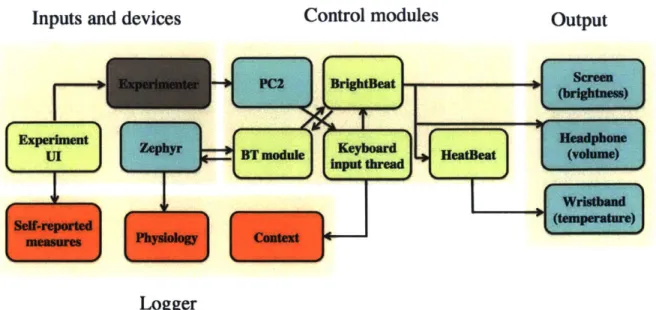
Figure 4- 1: Pilot I - System design. Color codes: blue: hardware module, green: software module, orange: data, grey: experimenter.
exact inhalation and exhalation was more preferred, we slightly modified the BrightBeat software. In this version, BrightBeat was a regular beat starting from minB, going up linearly to maxB, and returning to minB again with the same frequency as GBR. Fig. 4-I depicts the schematic system design.
4.1.2 Study protocol and deployment
In total, N= 13 participants were recruited. Participants were graduate students from two different universities in the Boston area. To compare placebo effect versus BrightBeat ef-fect, participants were randomly assigned to a control or intervention condition. The con-trol group was told that they would receive an imperceptible version of the intervention where the changes were so subtle that they could not be seen consciously. The interven-tion group received the actual BrightBeat. They were told that BrightBeat is there to give them breathing awareness and it oscillates the screen brightness when they are breathing too fast. Due to an error in delivering the BrightBeat intervention for one user and due to an extremely high MBR in another during the relaxation task which resulted in extremely
high overall GBR, two users were dropped from the analysis. The final analysis is based
on N= 11 (4 female) participants consisting of 5 control and 6 intervention users.
The experiment was conducted in a lab setting and lasted between 25 to 35 minutes. It
was composed of relaxation sessions, reading tasks, and quizzes. The experimental flow is shown in Fig. 4-2. First, participants started with a relaxation session and listened to a calming piano piece while sitting and breathing comfortably. Participants were instructed to proceed to the next page after they have reached a relaxed state. Consequently, the
relaxation period ranged from 2 to 5 minutes for different participants. The experimenter
calculated MBR from SenseView readings and set the system's parameters accordingly. Participants interacted with the system and confirmed the parameters, including minB, maxB, and GBR. Afterwards, they did a first reading task followed by a question set. Then, a second reading task was presented, followed by a set of questions. Finally, partic-ipants were told to relax while reading an article. They were informed about the fact that there was no quiz after the "relaxing and reading" task. In the end, the participants filled out a survey and rated their experience with the system along with their self-reported focus and calmness states. In order to elicit stress, which is associated with faster and irregular breathing patterns, participants were told that they would be tested on the tasks and their results would be compared to others. The participants were strictly timed during the tasks and the form would automatically proceed to the next page after the time limit. The experimenter was blind to the condition and only interacted with the participants before the reading tasks and after the session was over, to avoid affecting their breathing response to the system. The intervention group was exposed to BrightBeat during reading tasks and the final relaxation part but not during question sets.
Please refer to Appendix B for the participants' consent form and the experiment material for this round of the study.
R PS T1 Q T, Q, R
group 7SUn~ey
Intervention R, TBB ( Exit
group R
Z
+ 2+ B Q2 2 survey_/
Figure 4-2: Pilot I -Experiment design. Pre XS: Initial survey and experience sampling.
RI: Relaxation while watching video. TI, T2: Reading tasks. Qi, Q2: Quizzes. R2:
Relaxation while reading. Post XS: exit survey and experience sampling. PS: Parameter setting. BB: BrightBeat (which appears whenever the user breathes faster than his/her GBR).
4.1.3
Results
Analysis of physiological measurements
In order to show the effect of the intervention, we present a sample user from the
inter-vention group (Fig. 4-3) and the control group (Fig. 4-4). The green overlay shows
relaxation, red shows parameter setting, white shows reading, grey shows BrightBeat in-tervention, and yellow shows question answering.
As shown in Fig. 4-3, during the first relaxation session, the user is breathing deeply and calmly. During this phase, the breathing rate is mostly lower than GBR. It is also shown how the BrightBeat intervention influenced the user to breathe slowly and deeply. During the first reading task, the user started to breathe fast at the beginning of the task but as soon as he had received two BrightBeat interventions, he began breathing below his GBR for a few minutes. He became stressed near the end of the reading task as the time was going to be over and the BrightBeat appeared to him.
However, Fig. 4-4 shows a user in the control group. Most of the time, he is breath-ing faster than his GBR. At the beginnbreath-ing of the readbreath-ing task, he is more aware of his breathing and is below his GBR. However, the effect soon wears off.
Fig. 4-5 shows the average breathing rate for all the participants during different tasks
in the control and intervention groups with one standard deviation error bars. The red line shows the GBR for each user. As shown in the figure, the control group is usually above their personalized GBR unlike the intervention group. The MBR of each participant is
M2 16 a:12 CT 10 10 20 S 66 - ---64.8 (644 Ii :642 ,, to 64 _ _ _ _ _ _ _ _ _ _ _ _ 0 S IA 20
Time (minutes from offset)
Figure 4-3: Pilot I - A sample user in the intervention group. The red horizontal line is the goal breathing rate (GBR) of 10 BPM. GBR is set 2 BPM above the mean breathing rate of the first relaxation session. When the user breathes faster than his GBR, BrightBeat appears. As plotted, delivering BrightBeat resulted in deep and slow breaths with some lasting influence that wore off only gradually. Color codes: grey: BrightBeat on, green: relaxation, red: parameter setting, white: reading, yellow: question answering.
M1 20/ 00 6 66 ~64 64 0642~ 0:6 6~\ 10 1'6 2 0 20
Time (minutes from offset)
Figure 4-4: Pilot 1 - A sample user in the control group. The red horizontal line is the
goal breathing rate (GBR) of 13 BPM. GBR is set 2 BPM above the mean breathing rate of the first relaxation session. This user is reaching his GBR only at the beginning of the first reading task being more aware of his breathing. Color codes: green: relaxation, red: parameter setting, white: reading, yellow: question answering.
shown above each plot. There is no significant difference between the average MBR of the two groups. Participants in the control and intervention groups are shown by blue and green color respectively.
Fig. 4-6 shows the task-by-task performance of the participants. We show the average difference between the breathing rate and the MBR for each user and each task with one
Q-31M1, MBR=12.0 0 L. 10 U0 RI TI 01 12 02 P 2
Average BR for all participants during different tasks
M8, MBR=15.0 30M9, MBR=1O.0 MJ12, MBR=15.0 -,M13, MBR=11.0 25 25 25 25 20 420 20 2 Is1 * 20 s 10 1]n 10 10 5 5 5 5 0 0 0 0 -RI 1 Q1 7e Q2 R2 Ri1 Ti I1 2 02 2 RI TI 01 T2 02 R2 R I TI 01 1-2 02 R2 M2, MBR= 8.0 M3, MBR= 13.0 M4, MBR= 18.0 M5, MBR= 16.0 M10, MBR= 15.0 M1, MBR= 12.0 03 2 25w 25 C: 20 20 120 20 + 20 20 i0 15 is2. B15 C 10 10 10 10 07 10. .~j 00 L? 0 a 0 Ri T1 6I 1 02 R2 P1 TI Q1 T2 0.- R2 RI Ti Q1 T-2 02 R2 Ri TI 01 1F7 02 R2 Ri 1 - 01 T2 Q2 P02 PI11T 01 3231- 2 R:2
Figure 4-5: Pilot I - The average breathing rate of all the participants during different tasks with one standard deviation error bars. The individual MBRs are written on top of the plots and the red line shows the GBR. Intervention group users tend to reach their GBR more and during wider range of tasks.
standard deviation error bars. We have used MBR in this analysis to have a baseline of zero during the relaxation session. The red line shows zero. Blue and green refer to participants in the control and intervention group respectively. To visualize the difference more clearly, the points in each group are sorted. Overall, the intervention group is lower. This means that the intervention participants have been closer to their relaxed state of
breathing compared to their control counterparts.
In order to measure how the average participant did in the control and intervention group, we calculated the percentage of the time spent below the GBR during each task for each group. Fig. 4-7 shows the results. On average, the control group reached their GBR less than 10% of the time while it was 68% for the intervention group. While answering questions, participants in the intervention group reached their GBR more than 70% of the time even though they did not receive the BrightBeat during that part of the experiment. However, the control group reached their GBR less than I % of the time in the same condition. This hints at a lasting effect of the BrightBeat intervention. The difference
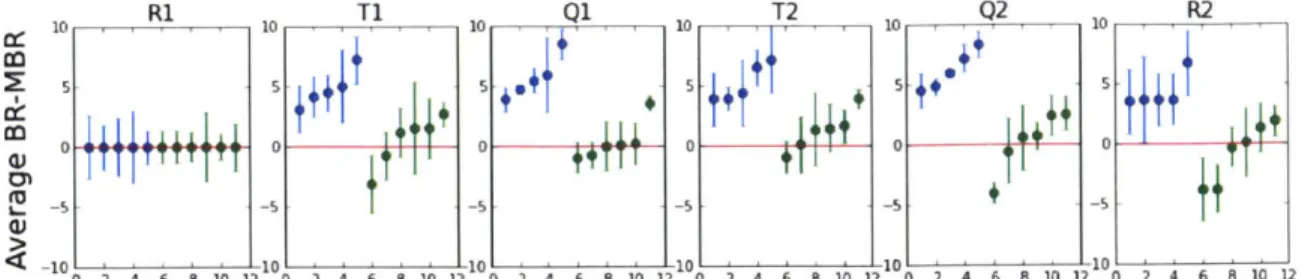
2 4 f- 8 01 2 10 )111
Q1 10 T2 10 Q2 -10 R2__
10 10 -10
2 4 6 8 10 12 0 2 4 6 8 10 12 0 2 4 I'1? G' 2 4 6 8 10 11
Figure 4-6: Pilot I - The task-by-task average difference between the breathing rate (BR) and the MBR with one standard deviation error bars. The red line shows zero. Blue and green points refer to the participants in the control and intervention group respectively and are sorted in ascending order. During the first relaxation task, the average breathing rate is the same as MBR and thus all points fall on the zero line. In the rest of the tasks, the intervention group is lower. This means that the intervention participants have been closer to their relaxed state of breathing compared to their control counterparts.
1 0 0Percentage of the time achieved the GBR
80 60 40 2C O e-Overa I R1 Q 2 - Control Intervention
Figure 4-7: Pilot I - Percentage of the time achieved the GBR in each task. The inter-vention group has achieved its GBR more than the control group during several tasks. Overall: overall except baseline, RI: Relaxing and watching (baseline), T: reading tasks,
Q: answering questions, R2: relaxing and reading. :1) < 0.001.
between control and intervention in T, Q, R2, and overall is significant (p < 0.001).
For the detailed box-plot analysis of breathing rate data, please refer to the appendix
(Fig. A-I). CC 0) Ic a) C (U a-R1
It
T T1Analysis of task performance
While this work focused on changing breathing rate, and did not make any hypotheses about task performance, we did want to examine whether BrightBeat, which could have cost some cognitive load or distraction, might have interfered with task performance. In order to objectively quantify the influence of BrightBeat on cognitive performance, we have looked at the quiz results. Fig. 4-8 shows the bar chart of the average user perfor-mance in each group, across different tasks with one standard deviation error bars. No significant difference was observed between the control and the intervention groups. This shows that BrightBeat did not negatively impact performance. However, it is important to mention that many factors influence task performance including the time of the day, the user's fluency in English, and his/her prior knowledge about the task. Please refer to Appendix B for the content of the reading tasks and quizzes.
Performance score 120 Control Q) 100 Intervention 0 80 -v 60 Q) (3) 40 L-0 U Vf) 20 Q1 Q2 Overall
Figure 4-8: Pilot I - Average performance score of the control and intervention groups.
Analysis of self-reported measurements
Users' self-reported ratings were also aggregated. Table 4. 1 shows the average rating of each group for different survey items and the standard error value. The higher average