Automatic Voice Disorder Recognition using Acoustic Amplitude
Modulation Features
by Nicolas Malyska B.S., Electrical Engineering B.S., Computer Engineering University of Florida, 2000SUBMITTED TO THE DEPARTMENT OF ELECTRICAL ENGINEERING AND
COMPUTER SCIENCE IN PARTIAL FULFILLMENT OF THE REQUIREMENTS FOR THE DEGREE OF
MASTER OF SCIENCE IN ELECTRICAL ENGINEERING
AT THE
MASSACHUSETTS INSTITUTE OF TECHNOLOGY _______
MASSACHU~
OF TE
FEBRUARY 2004 O T
© 2004 Massachusetts Institute of Technology. All rights reserved
[11
LIB
Signature of Author...
Department of Electrical Engineeri and Computer Science February 2, 2004
Certified by ... ... ...
Thomas F. Quatieri Senior Member of Technical Staff; MIT Lincoln Laboratory Faculty of MIT SHBT Program Thesis Supervisor
Accepted by... ...
Prof. A. C. Smith Chair, Department Committee on Graduate Students aent of Electrical Engineering and Computer Science
This work was sponsored by the Air Force Research Laboratory, under Air Force Contract F19628-00-C-0002. Opinions, interpretations, conclusions, and recommendations are those of the author and are not necessarily endorsed by the United States Government.
3ETTS INSTME.r
CHNOLOGY
15
2004
Automatic Voice Disorder Recognition using Acoustic Amplitude
Modulation Features
by Nicolas Malyska B.S., Electrical Engineering B.S., Computer Engineering University of Florida, 2000Submitted to the Department of Electrical Engineering and Computer Science on February 2, 2004 in partial fulfillment of the
Requirements for the Degree of Master of Science in Electrical Engineering
ABSTRACT
An automatic dysphonia recognition system is designed that exploits amplitude modulations (AM) in voice using biologically-inspired models. This system recognizes general dysphonia and four subclasses: hyperfunction, A-P squeezing, paralysis, and vocal fold lesions. The models developed represent processing in the auditory system at the level of the cochlea, auditory nerve,
and inferior colliculus. Recognition experiments using dysphonic sentence data obtained from the Kay Elemetrics Disordered Voice Database suggest that our system provides complementary information to state-of-the-art mel-cepstral features.
A model for analyzing AM in dysphonic speech is also developed from a traditional
communications engineering perspective. Through a case study of seven disordered voices, we show that different AM patterns occur in different frequency bands. This perspective challenges current dysphonia analysis methods that analyze AM in the time-domain signal.
Thesis Supervisor: Thomas F. Quatieri
Title: Senior Member of Technical Staff; MIT Lincoln Laboratory Faculty of MIT SHBT Program
Acknowledgements
First, I would like to thank Tom Quatieri, my thesis advisor, for sharing his time and energy with me for the last year and half. I appreciate that Tom encourages new ideas and paradigms and creates a research environment where we can be creative without getting lost. Tom, I look forward to working with you in the coming months and years-thanks.
I would like to thank Cliff Weinstein and Marc Zissman for allowing me to work with such an inspiring group of teammates at Lincoln Laboratory. I'm excited about continuing into the future as a part of Group 62.
Finally, I would of course like to thank my family and friends for all of their support and encouragement. Thanks for your insistence that I do what it takes to get what I want out of life. Thanks to my dad, for his insightful questions and my mom for always being there to talk. To my brother William, an enlisted Marine: thanks for helping me to keep things in perspective and please come home safely. To Becky: thanks for your encouragement, patience, and caring through the last few months.
Contents
1 Introduction
11
1.1
Thesis O utline ...
12
1.1.1
Chapter 2...
12
1.1.2
Chapter 3 ...
12
1.1.3
Chapter 4 ...
12
1.1.4
Chapter 5 ...
13
1.1.5
Chapter 6 ...
13
1.1.6
A ppendixA ...
13
1.2
Thesis Contributions ...
13
2 Dysphonia
15
2.1
Acoustic and Perceptual Characteristics of Voice Quality ...
15
2.1.1
M odal V oice...
16
2.1.2
Rough Voice...
16
2.1.3
Breathy Voice...
16
2.1.4
V oice w ith Trem or, Flutter, and Spasm s...
17
2.1.5
G lottalized V oice...
17
2.1.6
H arsh V oice...
18
2.1.7
Irregular Voice ...
18
2.1.8
V ocal Fry or Creak...
18
2.1.9
Superperiodic V oice...
19
2.2
Physiological M anifestation of Voice D isorders ...
22
2.2.1
H yperfunction ...
23
2.2.2
Paraly s ...
24
2.2.3
G lottal Tissue Pathology ...
24
2.2.4
N eurological D isorders ...
25
2.2.6
Consequences of Surgery ...
25
2.3
The Connection between Dysphonia and Voice Quality ...
25
2.3.1
Clinical U sage ...
26
2.3.2
Existence of Objective Tools Mapping Acoustics to Dysphonia...26
2.4
The K ay Disordered Voice D atabase ...
27
3 Amplitude Modulation
31
3.1
Amplitude Modulation of Sinusoids ...
31
3.1.1
Synthesis Model for AM Sinusoids ...
32
3.1.2
Analysis Model for AM Sinusoids...
33
3.2
Amplitude Modulations in Voice...
36
3.3
Case Study of AM in Dysphonia...
40
3.3.1
AM Interpretation of Superperiodic Structure ...
41
3.3.2
AM Interpretation of Aperiodic Signals...
48
3.3.3
Transduction of FM to AM ...
52
3.4
C onclusions ...
53
4 Biologically-Inspired Models to Represent Amplitude Modulations
55
4.1
M el-Filtering ...
56
4 .1.1
M odel ...
. 56
4.1.3
Representations of Amplitude Modulations...
59
4.2
DPK Nonlinear Adaptation Model...
62
4 .2 .1
M odel ...
. 62
4.2.2
Representations of Amplitude Modulations...65
4.3
ICC Modulation Filterbank Model...
68
4 .3 .1
M odel ...
. 69
4.3.2
Representations of Amplitude Modulations...72
4.4
C onclusions...
77
5 Automatic Dysphonia Recognition
79
5.1
Feature Extraction ...
80
5.1.1
Mel-Cepstral Feature Extraction ...
80
5.1.2
Dau, PUschel, and Kohlrausch (DPK) Feature Extraction ...
81
5.1.3
Inferior Colliculus (ICC) Feature Extraction ...
81
5.2
Pattern Recognition ...
82
5.2.1
Gaussian Mixture Model (GMM) Classifier...
83
5.2.2
Extension of the GMM to Dysphonia Recognition... 85
5.2.3
Training and Testing Procedure ...
86
5.2
Fusion Techniques...
87
5.4
Dysphonia Recognition Experiment Results...
90
5.5
C onclusions ...
98
6 Conclusions and Future Work
99
6.1
Sum m ary ...
. 99
6.2
Contributions of this Thesis ...
100
A Synthesis of Dysphonic Voices Using the Klatt Synthesizer
101
A .1
Introduction ...
101
A .2
G eneral M ethodology...
102
A .3
Synthesis of Trem or ...
103
A .3.1
Spectral Characteristics ...
104
A .3.2
Tim e-V arying Characteristics ...
104
A .4
Synthesis of a Creaky V oice ...
105
A .4.1
Spectral Characteristics ...
106
A .4.2
Tim e-V arying Characteristics ...
107
A .5
Synthesis of a H oarse V oice ...
108
Chapter
1
Introduction
The ability to recognize characteristic voice qualities is an intriguing human trait. With this ability, we can obtain information such as a speaker's identity, state of health, and degree of fatigue by listening to only several seconds of speech. The acoustic properties that convey these often subtle elements are only starting to be understood. This project is motivated by the desire to develop features which capture these rich voice qualities.
In comparison to the many voice factors that human listeners exploit, the elements used by automatic recognition systems in speech technology are surprisingly limited. It is the hypothesis of this thesis that current automatic recognition systems-in speech, speaker, and language recognition for example-are not designed to take advantage of the rich properties of the human voice. One area of automatic recognition that has only recently begun to emerge is automatic speech disorder, or dysphonia, recognition. A dysphonia is a disorder of the speech production mechanisms in the larynx with perceptual, acoustic, and physical correlates. Examples of these disorders include excessive tension of the laryngeal muscles and the presence of abnormal masses of tissue on the vocal folds.
For the investigation of voice quality features, using dysphonic voices evaluated in an automatic voice disorder recognition system is a natural choice. These voices, which are often distinctly rough, hoarse, or breathy, provide acoustic evidence that a person is not well. The problem of dysphonia recognition is particularly interesting because, unlike the speaker recognition problem, it is largely dependent on speaker differences in the glottal source, rather than differences in the vocal tract resonances. Dysphonic speech also may represent the extremes of acoustic phenomena occurring in normal voices such as the irregular nature of glottalization [38]. At least on a first pass, the baseline for our experiments, mel-cepstral features, are usually not thought to well represent source characteristics [34]. Therefore, the disordered voice recognition task is a challenge to the ability of our models to represent characteristics of the glottal source.
We hypothesize that dysphonic voices will provide examples of acoustic phenomena more subtly present in normal voices. By improving features to represent these nuances, especially periodic fluctuations in the amplitude envelope, or amplitude modulations, we hope to improve the overall representation of both normal and pathological voices in automatic recognition systems. Teager and Titze highlight the importance of understanding the speech signal as a glottal source carrier modulated by physiological inputs such as muscle movements, vortices of air, and the motion of laryngeal tissues. Titze, for example, states that at present "we don't know how to measure or
classify the multiplicity of perturbations and modulations that are observed simultaneously." [46, 47] This thesis explores models that accurately capture a subset of such modulation phenomena.
1.1
Thesis Outline
1.1.1
Chapter 2
This work begins by rigorously defining the term dysphonia-its perceptual and acoustic nature and also its origins in the larynx. We address two main topics (1) the aural perception of a voice disorder and (2) changes in the larynx that create voice disorders. The question of acoustics and perceptual cues are discussed in terms of a review of the literature, building a preliminary taxonomy of voice qualities that are analyzed acoustically for amplitude modulations in chapter 3. Likewise, we organize the physical properties of voice disorders into a hierarchy that describes how the physiology of these patients differs from normal subjects and from one another.
Also in this chapter, voice quality and the physiology of dysphonia are connected. We discuss evidence that certain combinations of acoustic properties correlate with certain physical voice disorders. A review of ideas and methods in clinical practice and engineering design from the literature provides strong motivation for automatic dysphonia recognition. The chapter ends with a discussion of one commercially available dataset, the Kay database [1], for studying dysphonia. We describe how this speech corpus is organized along with several problems that are inherent to its structure.
1.1.2 Chapter 3
As the second chapter defines dysphonia, chapter 3 defines amplitude modulation. The organization is a progression from traditional models of AM synthesis and analysis in communications engineering, to a theoretical relation of these concepts with speech signals, and finally to an analysis of AM in speech. Throughout this chapter, we derive and reinforce the concepts that (1) a bandpass analysis of speech signals is equivalent to demodulation, (2) a band-dependent analysis of speech can yield different patterns of fluctuations at different frequencies, (3) analysis filter bandwidth is critical to the analysis process, and (4) amplitude modulation in speech depends on both frequency and amplitude relationships of spectral components. These points are highlighted by presenting the most extreme cases from an acoustic survey of over 350
dysphonic voices.
1.1.3
Chapter 4
With the concepts of dysphonia and amplitude modulation defined, chapter 4 introduces three biologically-inspired models for the extraction of AM patterns. This chapter addresses the motivation, design, and implementation of each of these approaches, showing that the different models have complementary properties. We compare and contrast the responses of the models using a combination of synthetic signals and real speech.
1.1.4
Chapter 5
Chapter 5 discusses the motivation, design, implementation, and testing of a Gaussian-mixture-model-based dysphonia recognition system. A system capable of recognizing five voice problems-general dysphonia, hyperfunction, anterior-posterior squeezing, and several types of vocal folds lesions-is introduced. Extending the work of chapter 4, we show the process by which features are extracted from the auditory models, how classification is performed with a Gaussian mixture model, and how recognition results are fused. The final portion of the chapter shows the results of recognition experiments with the disordered speech database presented in chapter 2.
1.1.5
Chapter 6
This chapter draws conclusions about AM in speech and our dysphonia recognition system based on these principles. In particular, we discuss key findings of the research with a particular focus to how they may be improved in the future.
1.1.6 Appendix A
The appendix describes a dysphonic speech-synthesis experiment with the Klatt formant synthesizer [23] motivated by a study in the literature [2]. Sustained vowels for three of the patients analyzed in this thesis, DAS10, KAH02, and JAB10 are synthesized and the resulting signals are compared to the original utterances. We discuss differences observed between normal and dysphonic voices that make synthesis challenging.
1.2
Thesis Contributions
There are a number of areas in which this work is different from previous approaches. First, an explicit amplitude modulation detection technique is applied to automatic dysphonia recognition. This research also refines some of the biologically-inspired methods on which it is based [7, 36], aiming to create improved features for AM extraction. While implied by previous research [14, 46, 47], this thesis introduces the first specific use of frequency-band-dependent AM in dysphonic speech. We do not focus on modulations visible in the time-waveform; rather, through bandpass analysis, we view modulations in each frequency band separately.
The dysphonia recognition experiments of this thesis are also different in that we present results for a large range of voice disorders: normal/pathological cases, paralysis, hyperfunction, A-P squeezing, and several types of growths on the vocal folds. The notable exception is work performed on paralysis by [10]. In our work we also present, and attempt to work around, several limitations of the Kay database that we have not found previously discussed in the literature. Since we also rigorously define how our experiments are constructed, a possible spin-off of this work may be a more standard approach selecting data is when testing dysphonia recognition. Finally, with regard to recognition, our results suggest that our biologically-inspired features provide speech characteristics complementary to standard mel-cepstrum. A comparative analysis is presented of the relative performance of the features derived from variations of the auditory
models and also illustrates advantages gained by optimally fusing recognition results from different extracted features.
Chapter 2
Dysphonia
A major part of this work addresses the automatic detection of voice disorders, or dysphonia in speech. A dysphonia is a disorder of the mechanisms of phonation in the larynx caused by elements of diseased tissue, misuse and/or abuse of the speech production mechanisms, and psychological and/or stress factors [30]. Most patients have not only one, but a combination of problems making up to a dysphonia, some of which involve a "vicious cycle" [49] of further complications in the larynx. Voice disorders manifest as a combination of acoustical voice qualities in tandem with physical changes in the larynx.
In this chapter, we first introduce motivation for general acoustic and perceptual voice categories derived from the literature. Then we define different physical voice disorders that affect the larynx including aspects of how they arise, the effect they have on speech production, and how they relate to one another. We provide evidence for a correlated relationship between these two aspects of dysphonia. We also provide background information on the design and contents of the database used in dysphonia recognition experiments.
2.1
Acoustic and Perceptual Characteristics of Voice Quality
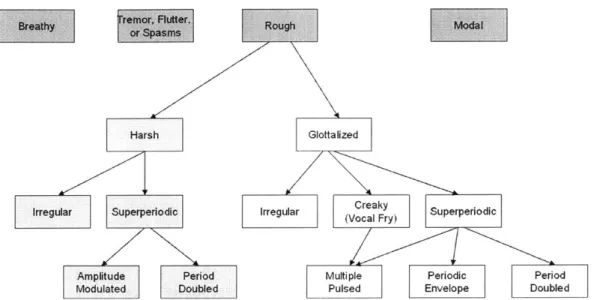
A preliminary taxonomy for voice quality derived from the literature is described below with reference to Figure 2-1. Each section describes a particular term, its synonyms, where it has been studied, and what it means in terms of acoustic and perceptual characteristics. It is important to realize that this taxonomy is only a basic effort to bring together many different terms and fit them together; a well agreed upon taxonomy for the speech community is still very much the subject of ongoing research [14]. There are surely further distinctions beyond the branches of the tree explored (for example encompassing breathy phonation). Also the taxonomy categories should not be taken as too rigorous; many combinations of the categories, for example a mix of modal and breathy speech or the coexistence of breathy and glottalized voice qualities, are possible.
Harsh Irregular Superperiodic I Amplitude Period Modulated Doubled Rough Modal Glottalized
rregular Creaky Superperiodic
(Vocal Fry)
Multiple Periodic Period
Pulsed Envelope Doubled
Figure 2-1. A preliminary taxonomy for voice quality. Note that, although this tree is derived from reports in the literature, a well agreed upon categorization system is still an open problem in the field.
2.1.1 Modal Voice
Modal speech is loosely defined as the "usual or baseline kind of phonation" [14]. It is speech at a normal fundamental frequency for the sex of the speaker, regular in both amplitude and pitch period, and without the nonmodal characteristics defined in the rest of the taxonomy [24]. Normal voices can be described as a mix of varying degrees of modal and nonmodal qualities [27]. Acoustically, "the volume-velocity waveform or area function produced by a modal model is zero during the closed phase, and its first derivative has a discontinuity at the moment that closure occurs"[16]. Also, in the ideal model, "the spectrum falls off at 6 dB/octave" [16].
2.1.2 Rough Voice
Roughness is the percept, or mental state generated by a physical observation, thought to be associated with an "uneven, bumpy quality" [47]. As depicted in Figure 2-1, roughness may be broken down into two perceptual subcategories, harsh and glottalized voice, primarily dependent on the fundamental frequency [27]. As will be shown, acoustically roughness can have many component aspects. Rough speech may contain aspects of all its subcategories, thus making some utterances difficult to describe. It is important to realize that some aspects of roughness may seem "irregular," but we will show that many such signals do, in fact, have a periodic variation.
2.1.3 Breathy Voice
The percept of breathiness has to do with the "sound of breathing (expiration in particular) during phonation" [47]. Acoustically, breathiness manifests as a decreased harmonic energy-to-noise ratio and an increase in the energy of the first harmonic [24] and usually contains a significant
voiced component. The physiology behind such acoustics are relatively well-studied and have to do with the tension of the glottis as well as the area which remains open during the glottal cycle.
2.1.4 Voice with Tremor, Flutter, and Spasms
Acoustically, tremor, flutter, and spasms are low frequency variations in the amplitude of speech on the order of 4-13 Hz [30]. As will be seen in the next section, these sounds are highly linked to several neurological speech disorders that cause periodic and aperiodic variations in the amplitude of the speech waveform. This category is different from the amplitude modulation subcategory of glottalization and harsh voice in that it occurs at much lower frequencies. As we will see in Chapter 3, it is not uncommon to have variation in the fundamental frequency accompany this activity.
2.1.5 Glottalized Voice
Perceptually, glottalized or laryngealized voice includes "salient auditory impressions of glottal gesture, roughness, or creakiness" [38]. Acoustically, its main distinction is that it has a dramatically lower frequency (averaging about 50 Hz) than both modal voicing and harsh voice [5]. Glottalized speech can be broken down into three (primarily acoustic) components-period-to-period irregularity, creak, and superperiodic phonation. Glottalized voices have been shown to consist of varying combinations of these three elements [14, 38].
4b)
Figure 2-2. Examples of the aperiodic category of glottalization from Redi and Shattuck-Hufnagel [38]. Activity is indicated by the region within the angle bracket; the bar indicates
10 Ms.
In the literature, for example, Redi and Shattuck-Hufnagel divide glottalization into four categories: (1) aperiodicity or "irregularity in duration of glottal pulses from period to period,"
(2) creak or "prolonged low fundamental frequency accompanied by almost total damping", (3) diplophonia or "regular alteration in shape, duration, or amplitude of glottal periods", and (4) glottal squeak or "a sudden shift to relatively high sustained ]O, which [is] usually very low
amplitude" [38]. Figures 2-2, 2-4, and 2-6 show characteristic examples of the first three types; each exhibits distinct amplitude fluctuations with time. Note from the taxonomy figure that we include similar subdivisions, using slightly modified names which are defined shortly. For a
complete review of glottalization and different perceptual, acoustical, and physiological correlates as well as other possible categorization schemes, see [15].
2.1.6
Harsh Voice
Harshness is defined by Laver as an unpleasant, rasping quality of speech [27]. Acoustically speaking, it is loosely characterized as having glottal pulses which decay much more quickly than those for modal voices [24]. Harshness is primarily different that glottalization in that it has a significantly higher (close to modal) fundamental frequency [27]. Although subcategories of harshness have not been specifically studied, the taxonomy of rough voice quality with near modal fundamental frequency has been described as including both irregular and superperiodic components [14]. We have thus chosen this term to refer to any roughness at or above the fundamental frequency, but there is no solid motivation for doing so.
2.1.7
Irregular Voice
Acoustically, signals that are irregular vary in amplitude and/or period from one pitch period to the next [38]. This term differs from "superperiodic" in that there is no time pattern to the varying components. Terms for "irregular" in the literature include "aperiodic" [38], "rough" [11], and "creaky" [38], the last two terms having additional meanings in our taxonomy. For harsh voice, irregularity has been shown by [14] as indicated in Figure 2-3.
100 80 60 40 20 0 0 20 40 60 80 100 Time (mg) 0 500 1000 Frequency (Hz) 1500 2000
Figure 2-3. Figure from [14] showing an example of aperiodic behavior in a Observe that there does not exist a clear fundamental and there seems to "interharmonic noise" [14] in the spectrum.
normal voice. be significant
2.1.8
Vocal Fry or Creak
Vocal fry is the element of sharp, short glottal pulses in voicing that creates the perception of low frequency individual pulses in speech [27], [5]. Some authors refer to the entire category of glottalization as vocal fry, but it has been deemed more descriptive to include separate aperiodic and superperiodic components .Creak may also be combined with superperiodicity to create a
80 60 40 20 0
1
multiple pulse behavior whereby there are several pulses in quick succession followed by extended inactivity [14].
>
Figure 2-4. Examples of the creak category of glottalization from Redi and Shattuck-Hufnagel [38]. Activity is indicated by the region within the angle bracket; the bar indicates 10 ins.
2.1.9
Superperiodic Voice
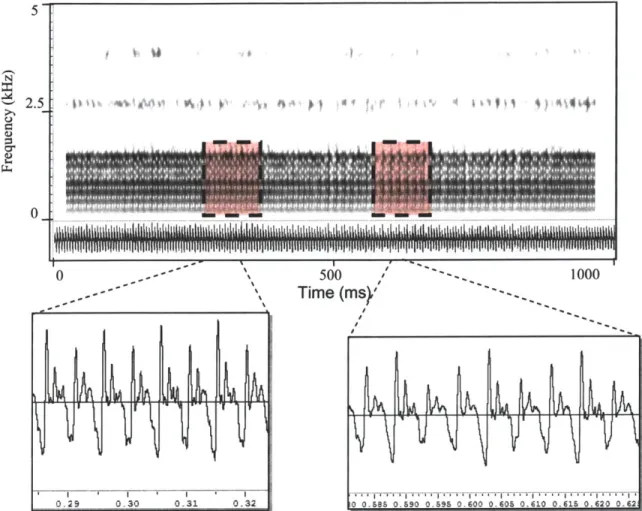
Superperiodic speech is defined as having a "repeating pattern that extends over more than one apparent glottal cycle" [14]. This category is analogous to the diplophonic component of glottalization described in [38] and shown in Figure 2-5. [14] shows an example of further decomposition of superperiodic speech into periodic envelope and period doubling types. Perceptually, these qualities are "described as 'rough' or 'bitonal"'. Other subcategories of superperiodicity include period tripling and quadrupling as well as the multiple pulsing often found in vocal fry [14]. As this category corresponds to clear amplitude variation with time, we will investigate it further in the chapter 3.
-a
Figure 2-5. Example from in a normal voice.
100
80 60 40 20 0 0 10 20 30 40 50 Time (ms)[14] showing an example of superperiodic period-doubling behavior
Figure 2-6. Examples of the diplophonia category of glottalization from Redi and Shattuck-Hufnagel [38]. Activity is indicated by the region within the angle bracket; the bar indicates
10 Ms.
110 100 100 90 '80 80 70
~60
79 60 9650 40 30 20 20 10 ' 0 i0 100 150 200 0 500 1000 1500 2000 Time (Ms) Frequency (Hz)Figure 2-7. Figure from [14] showing an example of superperiodic "periodic envelope" behavior in a normal voice. The right panel shows harmonics of the fundamental frequency along with subharmonics spaced by 44 Hz defining the frequency of the envelope.
Garratt and Kreiman mention that physical evidence exists for a periodic envelope category through the action when "the two vocal folds vibrate at different (but close) frequencies" [14] shown in Figure 2-7. There have also been attempts to model this from a multiple vibrational mode point of view due to nonlinearities in the glottal source mechanism. In a similar fashion, Berry [3] proposes such a model of vocal fold vibration, multiple modes, supported by actual glottal vibration experiments depicted in Figure 2-8. His work supports there being several characteristic frequencies of the vocal folds, which in a normal voice, quickly move towards to one frequency, the fundamental. In nonmodal phonation, however, including superperiodic vibration, he is able to show that the so-called eigenmodes of vibration converge to different frequencies. In period doubling and glottalization, these stable states are multiples of a common frequency, whereas for irregular vibration, the modes are not harmonically related [3]. In other words, Berry is suggesting that the notion of a single fundamental frequency, belonging to a single source is a fallacy and that one can explain more complicated voice types using interacting vibrations.
I
'
(a) (b) (c) (2) (3) (4) (6) (8)
Figure 2-8. Progression of three simultaneous modes (a), (b), and (c) of vocal fold vibration observed in a human larynx removed from a body of work by Berry [3]. Each cross-section is taken in the coronal plane of the layryx with the dots separated by approximately 1 mm. Berry hypothesizes that eigenmodes as in this example combine to produce both modal and nonmodal voice properties.
2.2
Physiological Manifestation of Voice Disorders
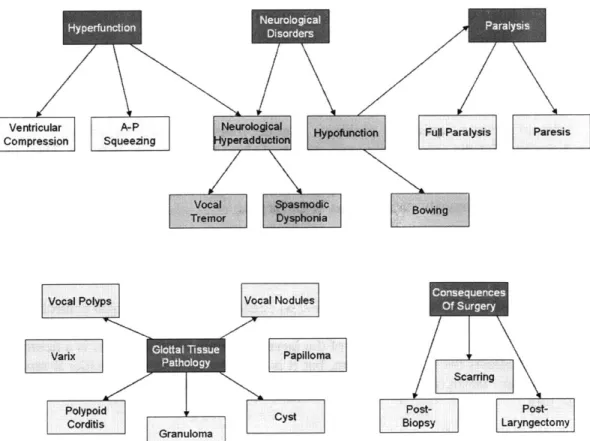
Having introduced how voice qualities, many of which are present with dysphonia, sound and how they are characterized acoustically, this section presents physical aspects of dysphonia. The following describe several major classes of voice disorders, their putative causes, and interrelationships. Our discussion will follow a the schematic of interrelationships between clinical terms shown in Figure 2-9. As with the previous section, this picture is not meant to be rigorous, but it allows visualization of some of the complex interrelationships we will address.
Ventricular A-P Fu# Paralysis aresis
Compression Squeezing peradduti
Vocal Bowingd
Treffr Dyhba Bw
Vocal Polyps Vocal Nodules
Papilloma
Scarring
Polypoid
CystPotPs-Corditis Biopsy Laryngectomy
Granuloma Pplo
Figure 2-9. Organizational chart to guide discussion of the physical aspects of dysphonia. The arrow indicates that the node is well-described as a subclass of its parent.
2.2.1 Hyperfunction
This class of disorder is caused when excessive tension is present in the muscles of speech production, causing primarily the vocal folds to be too forcefully adducted [30]. Clinicians can observe certain specifics about hyperfunction during their stroboscopic investigation: "muscle tension dysphonia can be suspected when excessive glottic and supraglottic contraction can be identified during phonation by video laryngoscopy" [49]. Clinicians may note the general location of the tension-in A-P squeezing, for example, the tension is in a front-back direction, whereas for ventricular compression, the false vocal folds are squeezed together during phonation.
Hyperfunction is not usually considered to be the result of a conscious effort on the part of the speaker. That is, muscle-tension dysphonia is considered a psychogenic voice disorder; it comes about as the result of disordered emotions such as stress [30]. As stated by Wilson et al.: "when long-standing and severe, muscle tension dysphonia can lead to vocal cord structural lesions including vocal cord polyploid change (Reinke's edema), vocal cord polyps, vocal cord ('singer's') nodules, arytenoid ulcers and granuloma." [49]. Even before the development of such lesions, this class of disorders may negatively impact a patient by causing irritation of the larynx, which tends to promote even more tension to produce a normal voice.
One might also link abuse and misuse of the voice such as strained vocal style and screaming into this category. Such voice states differ, though, in that they are under the conscious control of the speaker. It is likely, however, that after the damage caused by initial laryngeal trauma, a subject
will begin to exhibit some hyperfunction in order to compensate for the slight difficulty with phonation. For example, after cheering loudly at a football game, a fan may have slight laryngeal trauma. Instead of resting his voice, he continues to speak and must strain his voice in order to be heard. Such strain, in turn, yields even more trauma. It should be noted that patients with hyperfunction tend to respond well to voice therapy.
Other forms of muscle squeezing problems can be found with the neurological disorders discussed shortly. But the causes and manifestation of these disorders are different. They do not tend to respond in the same way to voice therapy as do stress and misuse caused by hyperfunction. They also tend to be more prone to cause spasms, whereas these hyperfunction disorders seem to cause mostly static tension in the larynx.
2.2.2 Paralysis
Paralysis and its relative, partial paralysis or paresis , causes a loss of positional control of one or both vocal folds [49]. Paralysis is actually best described as a subclass of hypoadduction, the abnormal lack of tension in the structures of the larynx. By definition, paralysis is a neurological disorder since it affects the nervous system, but it is so prevalent that we consider it separately. Minifie notes that "laryngeal nerve paralysis is one of the most common neurological voice disorders" [30].
2.2.3 Glottal Tissue Pathology
These problems manifest as masses, irritation, and/or swelling in the region on and surrounding the vocal folds. Masses, such as nodules, polyps, cysts, granulomas, or tumors, are thought to cause difficulties with phonation by interfering with the proper motion of the vocal cords, often preventing complete closure and also causing irregular vibration. Irritation and swelling, such as that caused by stomach acid reflux disorders, alcohol use, or smoking may also interfere with the proper operation of the vocal fold tissues and may even lead to the creation of more advanced lesions [16, 30, 49]. Misuse/abuse habits such as screaming, cheering, talking loudly, coughing, using a pressed voice are also a problem: "vocal nodules, vocal polyps, and contact ulcers are examples of voice disorders associated with vocal misuse/abuse and vocal hyperfunction" [30]. There exist far too many types of tissue pathology to offer a complete list. However, some of the most prevalent are:
(1) Vocal nodules. Nodules are like calluses on the vocal folds, often occurring bilaterally.
They are due to trauma due to straining and misusing the voice. It is not unusual for nodules to be found in the same patient as hyperfunction, as one tends to lead to the other
[49].
(2) Vocal fold polyps. Polyps are the "focal structural manifestation of chronic vocal cord irritation" [49]. As fluid filled lesions, they appear like blisters on the cords and impede the proper vibration of the vocal folds. A polyp may fill with blood and become hemorrhagic.
(3) Polyploid coditis (Reinke's edema). This disorder leads to severe hoarseness with the vocal folds developing swelling and redness; the cords look "floppy and bag-like" [49]. (4) Cyst. A cyst appears as a round mass on the vocal fold and arises from "an obstructed
(5) Varix. A varix is an enlarged vein on the vocal fold which can impede proper vibration of
the folds.
(6) Papilloma. This disease is viral in origin, forming "a benign, tumor-like condition that may recur throughout childhood" [30].
(7) Granuloma. Granulomas "represent an exuberant focal granular response to laryngeal
truama, such as intubation trauma or chronic microtrauma during phonation in patients with certain vocal styles" [49]. A granular response is defined as one resulting in the build-up of tissue.
2.2.4 Neurological Disorders
These problems are caused by disease at different levels of the nervous system. As a general class of disease, neurological disorders often affect many systems in the body but can specifically "affect the larynx and respiratory system and be reflected in a disordered voice." [30] Neurological disorders can occur at many levels of the speech chain-motor neuron, muscle, and in the brainstem and brain. The causes of the problems can include brain trauma, stroke, or a wide variety of chronic illnesses. As it has a tendency to affect normal movement of the articulators, a neurological disorder is also often an "entire motor speech disorder" [30], or dysarthria. In general, the effects of neurological disorders can be subdivided into abnormal excessive activity,
or hyperadduction, and abnormal lack of activity, or hypofunction.
Paralysis is probably the most common type of hypofunction, although others, such as lack of tone causing bowing of the vocal fold, are also prevalent. Disorders that cause hypofunction often yield a breathier voice quality as attaining full closure of the glottis is difficult. "Hyperadduction occurs in many neurological disorders of phonation" [30]; chorea, tics, and dystonia are common examples of the manifestation of hyperadduction. These disorders are involuntary. Spasmodic dysphonia is a characteristic example of a dystonia causing hyperadduction and appears as a "choked, strain-strangled phonation and, in some cases, vocal tremor" [30]. Another affliction, Parkinson's disease-causes tremor, or low frequency amplitude variations in the voice, as a symptom. "Imprecise articulation and disordered rate are observed in patients with Parkinson's disease" [30]. Tremor is in range of 4-8 Hz. Higher rates (10-13 Hz) exist for some other neurological disorders and are called flutter. [30]
2.2.6 Consequences of Surgery
Surgery involving the mechanisms of voice production may also change a patient's voice dramatically. With cancer, for example, whole sections of the larynx must be biopsied or removed entirely. This can understandably affect voice quality positively or negatively. One complication of surgery for our purposes is that it can repair voice quality while a condition remains. A good example of this is with paralysis on one side, which can be aided by moving the paralyzed vocal fold inward surgically. Thus the patient continues to be diagnosed with paralysis, but with a much improved voice quality [49].
2.3
The Connection between Dysphonia and Voice Quality
Having presented basic overviews of what the rich qualities of speech sound like as well as the types of physical changes that make up voice disorders, the question arises of how to connect the
two areas. A major portion of this thesis centers around the assumption that the two are correlated.
2.3.1
Clinical Usage
Our first indication that speech perception-and consequently acoustics-is useful for predicting dysphonia is that clinicians commonly use the sound of a voice to determine the pathology. In a clinical environment, patient examinations encompass many different aspects including a medical history, video stroboscopic investigation, subjective evaluation of voice quality, and objective acoustic measurements [49]. Often, a change in voice quality is the first indication of a problem, bringing a patient to the clinic for the first time. Perceptual evaluation is so commonly used that most hospitals use forms including scales to describe a patient's voice. For example, the popular GRBAS voice rating scale allows a clinician to listen to a voice and rate it using five perceptual rating scales-general evaluation, roughness, breathiness, asthenicity, and strain [9]. Although there is some debate as to the actual efficacy of scales like this, the fact remains that listening to voice is a large part of the clinical process.
2.3.2
Existence of Objective Tools Mapping Acoustics to Dysphonia
In addition to the link between perceived voice quality and voice disorders, there is a movement to integrate objective acoustic measures into clinical practice. These methods analyze speech automatically and provide the clinician with a numerical value related to the severity of the voice. Although there are many variations available in the literature, a large number of clinically used objective acoustic measurements for dysphonic voices fall loosely into one of two different categories-perturbation measures and glottal noise measures. Perturbation measures such as shimmer and jitter measure the irregularity of the speech signal from one pitch period to the next, usually in the time domain. In contrast, glottal noise measures, such as harmonic-to-noise ratio (HNR), attempt to separate out the speech signal into two components, a harmonic component and a noise component. These latter class of techniques has been attempted in both the spectral and time domains [19, 29]. Three common measures are further described below:
(1) Jitter. Jitter is defined as a "short term (cycle-to-cycle) perturbation in the fundamental frequency of the voice" [47]. Several automatic and hand-assisted techniques exist to measure jitter in sustained phonation [20, 29]. These methods are currently used in both clinical and speech research settings and are of comparable reliability to perceptual methods for normal speakers but less so for pathological speakers [4, 37]. Jitter is usually thought to correspond well with the percept of roughness, but has also been linked with breathy and hoarse phonation types [11].
(2) Shimmer. Shimmer is cycle-to-cycle change in the amplitude of successive voice periods [47]. As with jitter, both automatic and hand-assisted techniques have been created to measure shimmer in sustained phonation [21, 29].
(3) Harmonic-to-Noise Ratio. This measure represents the amount of energy coming from periodic parts of the speech signal compared with the energy of aperiodicity, as coming from aspiration for example. Several specific algorithms exist but all are based on this idea [19, 29]. Although harmonic-to-noise ratio is reviewed more in terms of its
importance for the percept of breathiness [18, 24], it may also be related to roughness [11].
It is also unclear exactly how useful existing automatic techniques are for classifying specific types of dysphonia. Work has been done to produce techniques including the hoarseness diagram described in [12] and the Dysphonia Severity Index [50] which are capable of better combining the three automatic methods described above. These approaches seem to yield numbers that can differentiate physical larynx properties, but the work to date is limited to only certain voice problems such as paralysis and post-surgical recovery. Another limitation as discussed in [32] is that most of the previous work with these objective perturbation features has been done with sustained vowels rather than continuous running speech. Although voiced portions of speech can be extracted prior to processing [12], most perturbation measures are still relatively sensitive, relying on accurate estimates of the fundamental frequency. Thus, there are issues with measuring modulation patterns for even moderately irregular signals, such as those seen with many dysphonic cases.
Overall, it appears probable that there is a connection between the acoustics of the human voice and the condition of the larynx. In later chapters we will work to build features that focus on time variation of amplitude and attempt to use them to predict physical diagnoses.
2.4
The Kay Disordered Voice Database
The clinical voice database being studied in this thesis, called the Kay Disordered Voice Database [1] includes a wide variety of clinical diagnoses and physician comments to accompany each of the speech samples. This database was generated from recordings taken during clinical visits by on the order of 600 patients to the Massachusetts Eye and Ear Infirmary. Both continuously sustained 1 second vowel utterances of /a/ as well as continuous speech in the form of 12-second recordings of the rainbow passage are included. The rainbow passage is a diagnostic sentence which begins "When the sunlight strikes raindrops in the air, they act like a prism and form a rainbow. The rainbow is a division of white light into many beautiful colors. These take the shape of a long round arch...."
The Kay database includes a set of data including patient age, sex, smoking habits, visit date, as well as a group of diagnoses and notes taken by a clinician reviewing the case. Because of the way in which they were created-through physician review of files-the notations range from extremely general to very specific. It is often the case that one note will be a synonym of the others. For example, hyperfunction, the abnormal overuse of the speech production muscles might be noted for the same patient as A-P squeezing, which is a specific type of hyperfunction involving compression in the forward-backward direction.
All Files
Pathological
Directory
Fgr 2- .fp.e aga s eK y .....aa. .Ptet a t. As depi.ted the pa ..r.path...gica..and.a.s...ay.havn m be.. n.rma
Rainbow p
How~... spe i .ean...an .... cei n .c .lsii .ais .n .f .h to a.s At en range, there.a.._.bser.ab.e.physi.a pr.b. ems.whi.h..ither.exist..r.d..n.t
is.
.aa.s.r...a -md a ti.s.u sT.a.s ds
.aeg.
and. a par .... a ....par. y is .r .. .t res.s..ases .the .f .n ... int th sam gr.p At th e
Fingu re 2beharam ofdtins inathea Kays dtabsme Paenee ecean havermultienfilsahfo a~~~~~ difrn vii dat As deice th pain ma be noma or pathological andalo.my.av
Rainbow .. pasg an/o voe reodig fo each. f...
How eanigfu andspeifica crtai voie cassiicaion lsovaris. A on endof.he.rnge there~~~~~~ obeval phsia prblm whc eihe exs or do not. exstfo example. total.ar
paralsis o surgcallyremovd anaomica strutures Ther arelso isodrhihcnb
determined~~~~~~~~~~... with hihcniec.hog.hscleamnto ... u a ifri ereo patholoy. Forexampl, vocalnodule, simiar.to.clluseson.thevocal.flds,.cn.be.dagnose after~~~~~~~~~~~~~. yer or .us .asthy. re.oring.Ufotuntey,.heKa.daabse.eig.seddos.nt.av a~~~~~~~~~~~~~~~~~~~~. goo syte fo iniatn seeiyfrmotcniin.nldn.llcs.ains notesm category~~~~~~~~~~~~~... an al.atilprayior.rsicse.noth.ae.ru..tteote.ndo.h
All Files
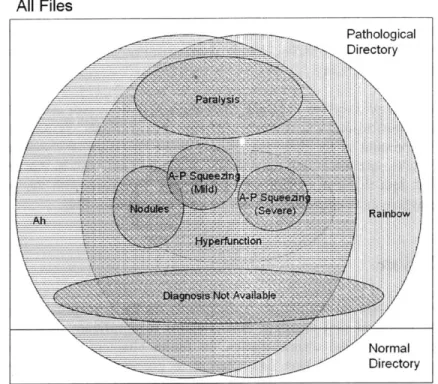
-... Pathological Directory ... . . .... . . . _ _.. ... . ... .... ... .... I Normal DirectoryFigure 2-11. Diagram of showing the typical organization of diagnoses found in the Kay database. Each file can have multiple diagnoses, even to the extent that having one diagnosis implies another one.
Figures 2-10 and 2-11 detail the organization of the database and show the nature of patients and diagnoses within this structure. First, a single patient can have multiple files and each may or may not contain utterances from the rainbow passage and the vowel /a/. The two main pathological and normal directories do not have overlapping patients. As can be seen, diagnoses can overlap extensively, even entirely. Some patients do not have a diagnosis or accompanying information at all and are shown in Figure 2-11 as "Diagnosis Not Available."
For this thesis, we cannot change the methodology used to record the clinical diagnoses and the descriptions in the database. We can, however, take into account the generality and meaning of different disorders when choosing classes for automatic recognition. First, we can keep in mind those general categories used to define voice disorders-hyperfunction, paralysis, tissue pathology, neurological disorders and, surgical results. We can also look to previous recognition research in order to determine what sets of data are most appropriate to study. On the whole, there are a number of characteristics of the Kay database that could affect our study:
(1) Different recording site for normals. Normals are recorded at least partly at different sites than the pathological voices. This introduces the possibility of slight differences in the recording environment and microphones used. Unfortunately, we do not implement a direct control for this possibility, however channel normalization techniques are used.
(2) Not enough cases. Another consideration with the database that there are not enough of them-between 700 and 800 total-recorded to make strong statistical conclusions in dysphonia recognition. The problem is worse for certain voice classes; there are only 53 normal speakers, for example.
(3) Reliability of physician diagnosis. It is not known how reliable physician diagnoses and
comments are for each specific diagnosis category. As discussed above, certain diagnoses also have an inherent gradient which the database indicates poorly, leading to speculation that accurately noting them is difficult. Other diagnoses, such as paralysis, seem easier to diagnose in a formal way.
(4) Large overlap of dysphonia classes. This characteristic is part of the nature of dysphonia
and makes performing experiments difficult. For example, assume that one dysphonia affects 90 percent of the database. Then assume that another dysphonia also affects 90 percent of the data, including the residual of the first data set. In this example, there is no set of test data that lies outside of both groups. Compare with the speaker recognition problem where each utterance belongs to only one speaker [39].
2.5
Conclusion
In this chapter we introduced the nature of dysphonia on the perceptual, acoustic, and physical levels. We also presented one database that contains a significant number of test cases and reviewed its organization and characteristics. In future chapters, we refer extensively to the aspects of dysphonia presented here and attempt to connect them to other ideas. Chapter 3 analyzes several dysphonic voices from the Kay disordered voice database using amplitude modulation theory. We continue this analysis with biologically-motivated designs in chapter 4 and, finally, in chapter 5, we experiment with automatic machine recognition of dysphonia.
Chapter 3
Amplitude Modulation
This chapter serves to define the term amplitude modulation, or AM, as it relates to dysphonia. First we motivate a definition for amplitude modulation in speech from classical sinusoidal AM definitions presented in communications engineering. Specifically, we describe signal synthesis in AM communications systems as well as the corresponding demodulation process. We then present a model for how speech differs from ideal sinusoidal AM and how this complicates the demodulation problem.
In this chapter, we also analyze amplitude modulations in dysphonic speech, showing evidence for their existence and basic nature. First, our study shows that both the frequency spacing and relative amplitudes of sinusoidal spectral components influence amplitude modulations. We find that the frequency of envelope variation often varies with the region of the spectrum being analyzed. We additionally present evidence for two other phenomena-amplitude modulated noise sources and the transduction of frequency modulation to amplitude modulation. This exploration indicates that dysphonic signals often contain a wealth of amplitude modulations. In later chapters, we develop models that better characterize the frequency-band-dependent envelope variations in dysphonia.
3.1
Amplitude Modulation of Sinusoids
Amplitude modulations have been studied from a communications viewpoint as a means to efficiently send signals from one location to another through transmission lines and radio waves. As depicted in 3-1, these systems allow multiple bandlimited signals to be displaced in frequency so that they can share the same transmission channel. This is a form of frequency division
multiplexing, the simultaneous transmission of multiple signals by assigning each a frequency
band. The limited commodity in a communications system is often the total bandwidth, the full spectrum allocated to a specific application. When using frequency-division multiplexing, an AM system allows multiple sources-radio stations for instance-to be broadcast from a source to a receiver at the same time
-- ~
Magnitude Magnitude
Station 1 Station 2
Frequency Frequency
Magnitude Magnitude Magnitude
Frequency Frequency Frequency
Source
.
Transmission
.
Output
Signals Modulation Channel Demodulation Signals
Figure 3-1. Schematic drawing of an AM transmission/receiver system. The idea behind such a system is to allow multiple transmissions to share the same transmission medium, for example radio waves or a wire.
3.1.1
Synthesis Model for AM Sinusoids
In general, the idea behind synthesizing amplitude modulations in a communications system is to take a series of bandlimited signals and transpose their spectra to higher frequencies. This process amounts to modulating the amplitude envelope of a sinusoidal carrier by the source signal [6].
In mathematical form, amplitude modulation of a single bandlimited signal is then defined as [6]:
g(t)= 4 [l+m(t)]
s(t)= A,[l + m(t)] cos(wat)
where g(t) is the envelope multiplied by the cosine carrier with radian frequency w, to create the modulated signal s(t). The bandlimited source signal, m(t), is used to create the envelope by adding it to 1 and scaling the sum by a constant A,. Here m(t) is defined to be between -I and 1
such that g(t) always remains positive. Also, co, is assumed to be no less than twice the highest frequency component of the original signal. The process of synthesizing AM is depicted in Figure 3-2, where a 30 Hz signal is used to modulate a 500 Hz carrier. The envelope of the output fluctuates, or beats, with time at 30 Hz.
90)I
60-00I
0
0.02 0.i . . 0'1 .2 0.14 .16 0.18 0 2 - F (H )
Figure 3-2. 500 Hz sinusoidal carrier modulated by a 30 Hz waveform g(t). The resulting time waveform s(t) beats at 30 Hz, the frequency imposed by the envelope. In the frequency domain, the original spectrum is simply shifted by the carrier frequency.
As can be seen in the figure, this interpretation of amplitude modulation is as a multiplicative envelope on a sinusoidal carrier. Another interpretation of the same waveform is as three line components in the frequency domain-one due to the carrier and the others due to the sidebands. This results from the equivalency of AM to convolution in the frequency domain. In a typical AM system, many modulated signals are summed together to allow them to transmit them on the same channel without frequency overlapping. Figure 3-3 shows both the previous 500-Hz carrier modulated by 30 Hz summed with a 700-Hz carrier modulated by a 50-Hz modulator.
3- -Go-I 2 -40 -- 20---2-2 --3 -W --0 0.02 0. 0.0 6 0.6 0 1 0.12 0.14 0.16 0.18 0.2 - 300 -400 - 00 H00 400 600 t Frequen y (Hz)
Figure 3-3. 30 Hz-modulated 500-Hz sinusoidal carrier summed with a 50-Hz-modulated 700-Hz sinusoidal carrier. Although the time envelopes are obfuscated in the time domain, the original spectra remain separated in the frequency domain.
3.1.2 Analysis Model for AM Sinusoids
A signal can be amplitude modulated then by multiplying it by a sinusoid at a carrier frequency. In order to reconstruct the original carrier signal, one needs to bring the center of the signal spectrum back to zero frequency, also known as demodulating to baseband. In communications systems containing many signals broadcast simultaneously, each modulating a different carrier, the strategy is to (1) isolate all frequencies affected by a certain carrier using one or more
bandpass and lowpass filters and (2) remove the effect of the carrier using one of several methods
of detection [6]. This general approach, depicted in Figures 3-4 and 3-5, assumes that there is no overlap between the spectra of neighboring channels before demodulation.
Sum of Bandpass Low-pass Baseband
Modulated Filter Filter signal
Signals cos(wet) Product Detector Hilbert -,+ -+- Magnitude -Transform
Hilbert Envelope Detector
onlinearity- Low-pass Filter
Envelope Detector
Figure 3-4. Diagram of demodulation of a sum of modulated sinusoids into a baseband signal using a combination of bandpass filter and one of several detector types.
Ideal Bandpass Fler
Frequency Response
Magnitude ---- _/__
Station 1 Station2. Bandpass - -1
-FilterJ
j
L i
--f f(Hz) f(Hz) a f(Hz)
Sum of Modulated Sinusoidal Carriers Bandpass Demodulated
Signal Signal
Figure 3-5. Schematic drawing showing the demodulation of two modulated sinusoidal carriers. As shown in Figure 3-4, there are many types of detection including the product detector, the Hilbert envelope, and even simple rectification and low-pass filtering. The goal of an ideal detector is to perfectly recover g(t) from the bandpass signal s(t) [6]. Certain detectors require finding the correct carrier frequency or knowing it a priori-this is called coherent detection. With the use of a product detector in an AM radio, for example, part of this process of tuning often relies on a human to choose the proper carrier frequency using a frequency dial. Envelope detectors, on the other hand, employ noncoherent detection, whereby the carrier frequency does not need to be known in order to recover the original signal.
Thus, the process of demodulation in general is one of (1) separating by bandpass filtering an interesting portion of the signal and (2) bringing the signal to baseband using a detection scheme. This series of steps should be familiar from many well-studied speech analysis methods,
including the spectrogram. A perspective of the short-time Fourier transform as a series of demodulators is shown in Figure 3-6. This representation is governed by[3 1]:
X[n,2)= E x[n+m]um]e-"' m=-oo
where 0 5 X < 2n denotes the analysis frequency in radians per second and w[m] is the windowing function.
Complex Bandpass Filter Envelope Detector
Analysis 11AI*A
Wndow Magnitude
Sum of
Analysis
-lilt, A2)Sum f WidowMagnitude Sum of f jAII Modulated - --- --- Magnitude Sinusoids Envelopes Analysis 1M A M g Window Magnitude
Figure 3-6. View of the short-time Fourier transform as a series of demodulators. Adapted from [31].
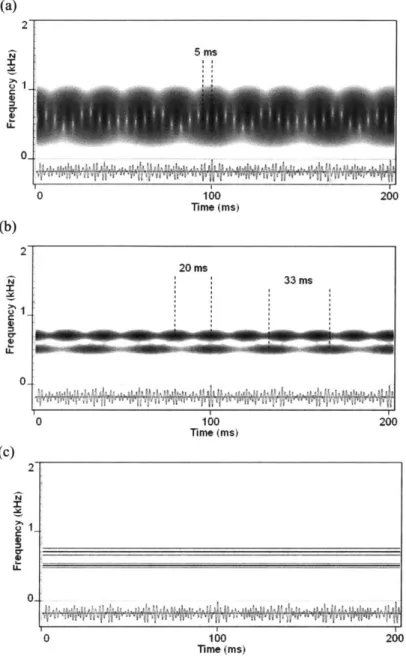
A problem with using such general spectral analysis techniques for the purpose of demodulation is that there is no guarantee that the filters will pass all the sidebands of a particular station. Thus we run into a well-known fundamental tradeoff-long analysis windows improve capturing the sidebands of a signal while short windows allow interference from the sidebands of neighboring channels. Figure 3-7 compares the spectrograms using three different window sizes to demodulate two amplitude-modulated sinusoids. With the longest envelope, the signal is not demodulated as the sidebands are each interpreted as carriers. With the middle envelope, we get demodulation at 30 Hz and 50 Hz as desired. The envelope of the outputs using the shortest window case contains amplitude variations that beat at both the modulation frequencies as well as at the difference frequency between sideband and carrier components of two different stations. This observation is connected to the well known rule-of-thumb that there is beating in the envelope of a signal at differencefrequencies. That is, with overlapping modulation channels, two different types of interactions can produce magnitude variations on the output of an analysis channel. One interaction is due to amplitude modulation of a single sinusoidal carrier as expected from the theory. The other type is due to components of two different stations beating together in a phenomenon we will call artifact AM. From a synthesis point of view, artifact AM is defined as AM not resulting from the application of envelope g(t) to a sinusoidal carrier; instead it results
from summing two amplitude-modulated carriers. From an analysis point of view, the difference
"AM" in the analysis performed in this thesis, regardless of their origin. It is important to realize that time variation of the resulting envelope occurs for both cases.
(a) 2 5 ms Cr 0 0 100 200 Time (Ms) (b) 2 20 ms N 33 ms 0-0 100 200 Time (ms) (c) 2 0-0 100 200 ime (ms)
Figure 3-7. Illustration of the effect of changing the size of the Fourier analysis window on
demodulation performance. Notice that time-variation in the output envelopes can occur at
frequencies other than the two modulation frequencies. From top to bottom, the Hamming window lengths are (a) 5 ms, (b) 16.6 ms, and (c) 200 ms, respectively.
3.2
Amplitude Modulations in Voice
Throughout the discussion of voice thus far, we have been hesitant to use the term amplitude
![Figure 2-3. Figure from [14] showing an example of aperiodic behavior in a Observe that there does not exist a clear fundamental and there seems to](https://thumb-eu.123doks.com/thumbv2/123doknet/14134156.469468/18.918.182.748.597.840/figure-figure-showing-example-aperiodic-behavior-observe-fundamental.webp)
![Figure 2-7. Figure from [14] showing an example of superperiodic "periodic envelope" behavior in a normal voice](https://thumb-eu.123doks.com/thumbv2/123doknet/14134156.469468/21.918.200.723.127.362/figure-figure-showing-example-superperiodic-periodic-envelope-behavior.webp)