Publisher’s version / Version de l'éditeur:
PLoS ONE, 4, 2, pp. 1-7, 2009-02
READ THESE TERMS AND CONDITIONS CAREFULLY BEFORE USING THIS WEBSITE. https://nrc-publications.canada.ca/eng/copyright
Vous avez des questions? Nous pouvons vous aider. Pour communiquer directement avec un auteur, consultez la
première page de la revue dans laquelle son article a été publié afin de trouver ses coordonnées. Si vous n’arrivez pas à les repérer, communiquez avec nous à PublicationsArchive-ArchivesPublications@nrc-cnrc.gc.ca.
Questions? Contact the NRC Publications Archive team at
PublicationsArchive-ArchivesPublications@nrc-cnrc.gc.ca. If you wish to email the authors directly, please see the first page of the publication for their contact information.
NRC Publications Archive
Archives des publications du CNRC
This publication could be one of several versions: author’s original, accepted manuscript or the publisher’s version. / La version de cette publication peut être l’une des suivantes : la version prépublication de l’auteur, la version acceptée du manuscrit ou la version de l’éditeur.
For the publisher’s version, please access the DOI link below./ Pour consulter la version de l’éditeur, utilisez le lien DOI ci-dessous.
https://doi.org/10.1371/journal.pone.0004421
Access and use of this website and the material on it are subject to the Terms and Conditions set forth at
Cepred : Predicting the co-expression patterns of the human intronic
microRNAs with their host genes
Wang, Dong; Lu, Ming; Miao, Jing; Li, Tingting; Wang, Edwin; Cui, Qinghua
https://publications-cnrc.canada.ca/fra/droits
L’accès à ce site Web et l’utilisation de son contenu sont assujettis aux conditions présentées dans le site LISEZ CES CONDITIONS ATTENTIVEMENT AVANT D’UTILISER CE SITE WEB.
NRC Publications Record / Notice d'Archives des publications de CNRC:
https://nrc-publications.canada.ca/eng/view/object/?id=63d17938-38d9-425d-a1f4-0ae8385fa124
https://publications-cnrc.canada.ca/fra/voir/objet/?id=63d17938-38d9-425d-a1f4-0ae8385fa124
Human Intronic microRNAs with Their Host Genes
Dong Wang1,2, Ming Lu1,2, Jing Miao3, Tingting Li4, Edwin Wang5, Qinghua Cui1,2*
1Department of Medical Informatics, Peking University Health Science Center, Beijing, China, 2 MOE Key Laboratory of Molecular Cardiology, Peking University, Beijing, China, 3 Department of Pediatrics, Peking University First Hospital, Beijing, China, 4 MOE key laboratory of Bioinformatics, Tsinghua University, Beijing, China, 5Computational Chemistry and Biology Group, Biotechnology Research Institute, National Research Council Canada, Montreal, Que´bec, Canada
Abstract
Identifying the tissues in which a microRNA is expressed could enhance the understanding of the functions, the biological processes, and the diseases associated with that microRNA. However, the mechanisms of microRNA biogenesis and expression remain largely unclear and the identification of the tissues in which a microRNA is expressed is limited. Here, we present a machine learning based approach to predict whether an intronic microRNA show high co-expression with its host gene, by doing so, we could infer the tissues in which a microRNA is high expressed through the expression profile of its host gene. Our approach is able to achieve an accuracy of 79% in the leave-one-out cross validation and 95% on an independent testing dataset. We further estimated our method through comparing the predicted tissue specific microRNAs and the tissue specific microRNAs identified by biological experiments. This study presented a valuable tool to predict the co-expression patterns between human intronic microRNAs and their host genes, which would also help to understand the microRNA expression and regulation mechanisms. Finally, this framework can be easily extended to other species.
Citation:Wang D, Lu M, Miao J, Li T, Wang E, et al. (2009) Cepred: Predicting the Co-Expression Patterns of the Human Intronic microRNAs with Their Host Genes. PLoS ONE 4(2): e4421. doi:10.1371/journal.pone.0004421
Editor:Raya Khanin, University of Glasgow, United Kingdom
ReceivedOctober 20, 2008; Accepted January 8, 2009; Published February 10, 2009
Copyright: ß2009 Wang et al. This is an open-access article distributed under the terms of the Creative Commons Attribution License, which permits unrestricted use, distribution, and reproduction in any medium, provided the original author and source are credited.
Funding:This research was supported by the National Basic Research program of China (2007CB512100) and the 985 project of Peking University (No. 985-2-108-121). The funders had no role in study design, data collection and analysis, decision to publish, or preparation of the manuscript.
Competing Interests:The authors have declared that no competing interests exist. * E-mail: cuiqinghua@bjmu.edu.cn
Introduction
MicroRNA (miRNA) is a class of small non-coding RNAs (,22 nt) identified in recent years. They usually function as the negative regulators for certain genes at the post-transcriptional level by binding to the 39UTRs of the target mRNAs through base pairing, resulting in the target mRNAs cleavage or translation inhibition [1,2,3]. It has been newly shown that miRNAs may also function as positive regulators [4,5]. It is estimated that 1–4% of the genes in human genome are miRNAs, a single miRNA can regulate more than 200 targets [6], and the miRNAs preferentially regulate duplicated genes in mammals [7]. Increasing evidences suggest that the miRNAs play crucial roles in nearly all the important biological processes, such as cell growth, proliferation, differentiation, development, and apoptosis [6]. It has been reported that miRNAs also participate in the cellular signaling networks[8] and the gene regulatory networks [9], as well as the cross-species gene expression variation[10] and pathways [11]. Hereby, the miRNAs might be associated with various diseases [12].
To get a more comprehensive understanding of the miRNAs, it becomes important to identify the tissues in which a miRNA is expressed, which would promote not only the understanding of the miRNA biogenesis and expression mechanisms but also the prediction of their functions. However, it is difficult to identify the tissues in which a miRNA is expressed because great limitations exist in the current large-scale expression profile detecting techniques, such as the microarray [13]. For example, it is difficult to detect the expression levels of those miRNAs in rare cells or expressed at low levels [13]; the amount of miRNAs contained in a
microarray chip is relatively limited comparing to the total amount of miRNAs in the human genome. Moreover, microarray experiments are both time and cost consuming. Most importantly, detecting the miRNA expressions of human directly is more difficult than other species since the lack of tissues. Therefore, it becomes critical to develop new approaches to decipher the expression of miRNAs.
miRNAs show a very biased distribution in genomes. More than 36% (196/533) of the human miRNAs are within the introns (referred as the intronic miRNA here) of protein-coding genes (the host genes, miRBase Version 10, October 2007). The enrichment of the intronic miRNAs in human genome triggered researchers to wonder whether the intronic miRNAs and their host genes have special connections in terms of expression and regulation. Indeed, several groups have reported that many intronic miRNAs show significantly correlated expression profiles with their host genes [14,15,16,17]. One possible explanation for this phenomenon is that (1) the intronic miRNAs may be co-transcribed with their host genes by inclusion introns of their pre-mRNAs [17]; (2) the intronic miRNAs and their host genes may share common regulatory elements, such as common promoters [18]. By performing a comparison between the known miRNA expression profiles [19] and the RT-PCR expression profiles of the host genes, Rodriguez et al. found perfect correlations between the expression profiles of the investigated intronic miRNAs and their host genes [17]. These findings seemed to provide us a chance to uncover the tissues in which an intronic miRNA is expressed by associating with the expression profiles of its host gene. However, there are some intronic miRNAs which are low co-expressed with
their host genes [14], which makes the problem much more complicated. Therefore, the first step to infer the expression tissues of the intronic miRNAs in this way is to identify which intronic miRNAs show high co-expression with the host genes and which do not.
In this study, we established a machine learning based approach to predict whether an intronic miRNA is high co-expressed with its host gene. We tested our method by the leave-one-out cross validation scheme, a novel independent dataset, and tissue specific miRNAs. Finally, we applied our approach to all the human intronic miRNAs.
Results
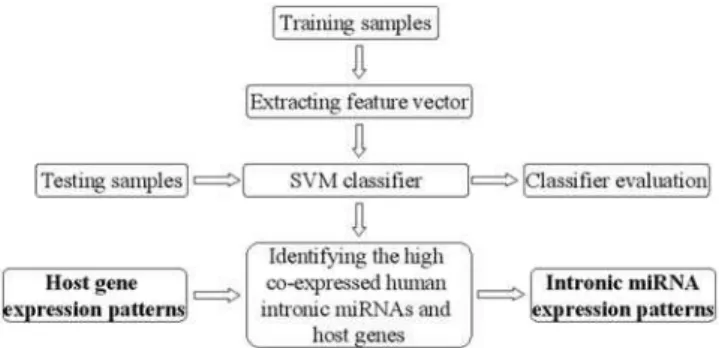
The co-expression dataset of Baskerville et al. [14] was employed as the training dataset. We first calculated the feature vectors for each sample in the training dataset, which was used to train a classifier. The performance of the classifier was then evaluated. Finally, we applied the classifier to all the human intronic miRNAs. As a result, all human intronic miRNAs showing high co-expression with host genes are identified and then the expression profiles of these miRNAs are inferred by identifying the expression profiles of the host genes. The complete flowchart of our framework is shown in Figure 1.
Genomic features of the human intronic miRNAs
In this study, the different co-expression patterns of the intronic miRNAs with their host genes triggered us to explore what the reasons are. Zhou et al. reported that the miRNA hosting introns have a 59-biased relative position distribution compared to all the other introns in human and mouse genomes, suggesting that the
cis-signals within the 59UTRs of the host genes may interfere the transcription and regulation of the intronic miRNAs to certain extent [20]. Moreover, this finding suggests that the relative positions of the intronic miRNAs in their host genes is not completely random and may have functional significance. Therefore, here we present four feature vectors, which reflect the positional characteristics of the intronic miRNAs in their host genes to train the classifier (Table 1). These four features describe the position of miRNA hosting intron, the position of miRNA, the length of the miRNA hosting intron, and the ratio of the length of miRNA to that of the host gene.
Support vector machine training and predicting
A support vector machine (SVM) based classifier was imple-mented to predict the co-expression levels between the intronic miRNAs and their corresponding host genes. The dataset from Baskerville et . [14] was adopted as the training set. The feature vectors (Table 1) for each sample were computed and are listed in Table 2. As shown in Table 2, columns ‘‘1’’, ‘‘2’’, ‘‘3’’, and ‘‘4’’ list the values of these four features for each miRNA; column ‘‘co-expressions’’ lists the correlation coefficients of the miRNA and host gene expression profiles; column ‘‘ER’’ lists the co-expression patterns of miRNA and host gene identified by biological experiments, in which ‘‘+’’ represents high co-expression and ‘‘2’’ represents low co-expression. A leave-one-out cross valida-tion scheme was employed to evaluate the performance of this SVM classifier. For each round of the leave-one-out experiments, one sample was eliminated from the training set and the remaining samples were used to train the SVM classifier. The prediction was made on the uncovered sample with the well-trained model. Each sample was left out for one time and the prediction results for all the samples are listed in the column ‘‘PR’’ of Table 2. The results of this experiment revealed that our approach achieves an accuracy of 79% and shows good sensitivity and specificity (Table 3), which indicates that the co-expression patterns are predictable using SVM and these four features. The accuracy is calculated as the ratio of the number of the samples that are predicted correctly to the number of the whole samples. The sensitivity of high/low co-expression class is calculated as the ratio of the number of the samples that are predicted as high/low expression correctly to the total number of true high/low expression samples, respectively. The specificity of high/low co-expression class is calculated as the ratio of the number of the samples that are true high/low co-expression to the number of the samples that are predicted as high/low co-expression, respectively. In order to confirm the results, we further test our method on an independent dataset. This testing dataset is combined from one set of mRNA microarray data and two sets of miRNA microarray data from three separated labs (see Materials and Methods). There are 5 and 16 intronic miRNAs which showed high or low co-expression patterns with their host genes, respectively (Table 4), in which we evaluated the co-expression patterns of miRNA and host
Figure 1. The framework works as follows: A support vector machine (SVM) classifier is trained based on the feature vector extracted from the training samples.And then the performance of this classifier is evaluated by the testing samples. The classifier is further used to identify the human intronic miRNAs that are high co-expressed with their host genes. Finally, the expression profiles of the identified human intronic miRNAs are predicted by inferring that of their host genes.
doi:10.1371/journal.pone.0004421.g001
Table 1.The feature vector of samples used in training the SVM.
Index Description
1 Distance from the transcription start position of the host gene to the start point of the host intron 2 Distance from the transcription start position of the host gene to the start point of the microRNA 3 Length of the host intron
4 Length of the microRNA/length of the host gene doi:10.1371/journal.pone.0004421.t001
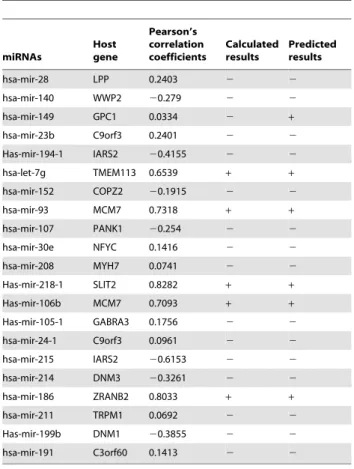
gene by calculating the Pearson’s correlation coefficient of miRNA and host gene expression profiles. In this case, we trained the SVM classifier with all samples in Baskerville et al.’ data and then applied it on this independent testing dataset. As a result, 20 out of the 21 predicted results turned out to be accordance with the experimental results. More specifically, all the 5 experimental high expressed intronic miRNAs, as well as 15 out of the 16 low co-expressed intronic miRNAs were correctly predicted. The missing one was hsa-mir-149, which showed low co-expression in the experimental results but was predicted as high co-expressed by our classifier. Finally, we got a total accuracy of 95% in this validation, which indicates that our approach is robust (Table 3).
Identifying the tissues in which the human intronic miRNAs are expressed
Using the 29 miRNA-host gene pairs of Baskerville et al., we have constructed a SVM based classifier to predict whether an
intronic miRNA is high co-expressed with its host gene. Here we applied this classifier on the rest 178 human intronic miRNAs reported in miRBase database[21] to predict whether they are high co-expressed with their host genes. Finally, 64 and 112 of them were predicted to be high or low co-expressed with their host genes, respectively (Supplementary Text S1). Together with the 12 high co-expressed intronic miRNA-host gene pairs in the training dataset, we obtained 76 high co-expressed intronic miRNA-host gene pairs. The expression profiles of these intronic miRNAs could be estimated by associating with the expression profiles of their host genes. By examining the expression profiles of the host genes across 79 human tissues [22], we obtained the expression profiles of 71 miRNAs in these 79 human tissues (Supplementary Text S2).
Validation through tissue-specific miRNAs
Among the high tissue-specific miRNAs identified by Landgraf et al. based on small RNA library sequencing [23], 12 of them are Table 2.The training dataset and the leave-one-out validation results on Baskerville et al.’ data [14].
microRNAs Host gene Training dataset*
1 2 3 4 co-expressions ER PR hsa-mir-9-1 C1orf61 9933 0.0035 182.716 143.205 0.999 + + hsa-mir-139 PDE2A 33502 0.00068 580.925 486.716 0.99 + + hsa-mir-1-1 C20orf166 11323 0.00345 55.0571 45.9 0.968 + + hsa-mir-95 ABLIM2 24504 0.00041 499.888 228.05 0.96 + + hsa-mir-338 AATK 1412 0.00398 138.167 125 0.921 + + hsa-mir-126 EGFL7 619 0.00862 91.3452 88.1071 0.888 + + hsa-mir-25 MCM7 771 0.0092 9.39759 7.48193 0.838 + + hsa-mir-204 TRPM3 43567 0.00128 239.523 3.77982 0.796 + + hsa-mir-190 TLN2 12893 0.00043 2100.1 2060.25 0.663 + + hsa-mir-153-1 PTPRN 3451 0.0045 50.4157 21.3371 0.626 + + hsa-mir-98 HUWE1 2461 0.00097 198.585 187.542 0.503 2 2 hsa-mir-153-2 PTPRN2 5119 0.00008 410.163 377.105 0.499 2 2 hsa-mir-26b CTDSP1 629 0.01229 38.0526 34.8816 0.453 2 2 hsa-mir-30c-1 NFYC 4874 0.0011 746.761 700.875 0.406 2 2 hsa-let-7f-2 HUWE1 2461 0.00068 297.585 269.878 0.379 2 2 hsa-mir-99a C21orf34 69554 0.00019 4308.89 4288.26 0.335 2 2 hsa-mir-125b-2 C21orf34 69554 0.00021 4498.4 3898.42 0.297 2 2 hsa-mir-103-2 PANK2 1620 0.00226 359.468 353.701 0.27 2 2 hsa-mir-101-2 RCL1 10574 0.00114 736.718 727.141 0.226 2 2 hsa-let-7c C21orf34 69554 0.0002 4162.05 4133.27 0.067 2 2 hsa-mir-199a-1 DNM2 7602 0.00061 1419.26 1347.13 0.02 2 2 hsa-mir-32 C9orf5 12165 0.00066 450.652 333.087 20.22 2 2 hsa-mir-26a-1 CTDSPL 3524 0.00062 1410.88 1390.86 20.285 2 2 hsa-mir-128a R3HDM1 13938 0.00042 1652.9 1603.47 0.856 + 2 hsa-mir-103-1 PANK3 2235 0.00321 68.4675 45.8831 0.638 + 2 hsa-mir-15b SMC4 7415 0.00282 41.5464 40.6804 0.509 2 + hsa-mir-16-2 SMC4 7415 0.00233 52.3375 49.325 0.504 2 + hsa-mir-128b ARPP-21 48416 0.00055 1230.36 1224.2 0.444 2 + hsa-mir-335 MEST 1633 0.00655 43.172 36.8387 0.442 2 +
*Once again, kicking one sample out as the testing sample, the rest 28 samples are the training dataset.
The four features (columns ‘‘1’’, ‘‘2’’, ‘‘3’’, and ‘‘4’’) of each miRNA are calculated based on the genomic coordinates of the miRNA, the miRNA hosting intron, and the host gene.
ER represents the experimental results and PR represents the prediction results. The symbol ‘‘+’’ means high expression and the symbol ‘‘2’’ means low co-expression.
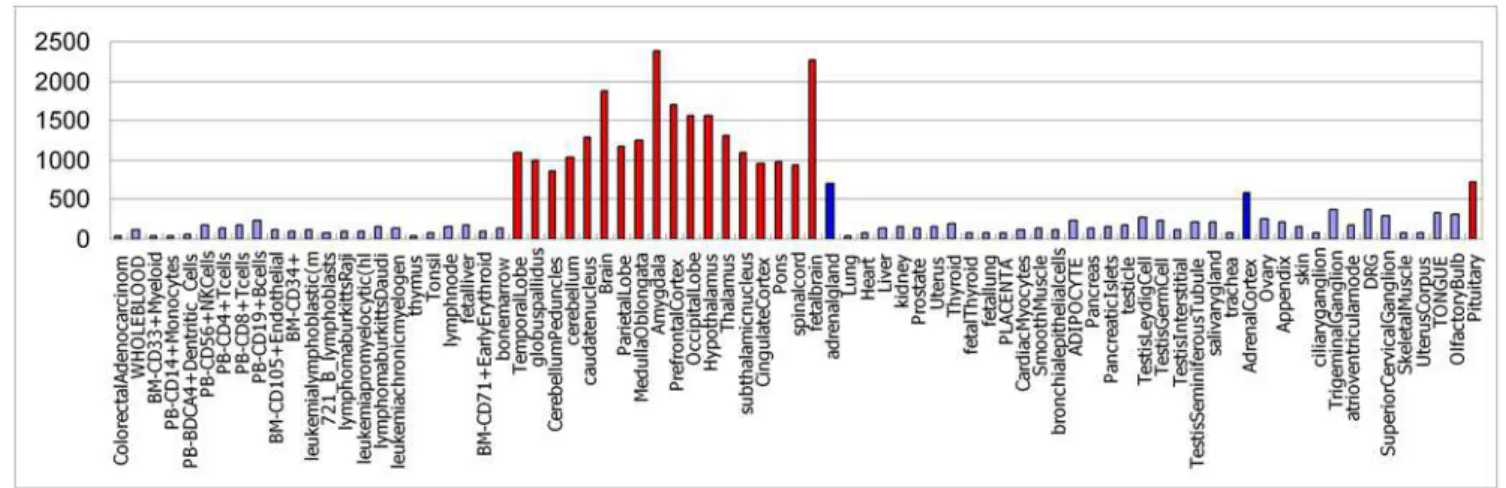
intronic miRNAs and show high co-expression with host genes in our prediction. Table 5 lists the specific tissues identified by prediction and biological experiments for these 12 miRNAs, respectively. As a result, 11 of the 12 overlaps were successfully predicted (Table 5), in which mir-302 cluster contains mir-302a, mir-302b, mir-302c, mir-302d, and mir-367. For example, we predicted that hsa-mir-488 is high expressed in the amygdala, temporal lobe, globu spallidus, cerebellum peduncles, cerebellum, caudate nucleus, whole brain, parietal lobe, medulla oblongata, prefrontal cortex, occipital lobe, hypothalamus, thalamus, subtha-lamic nucleus, cingulated cortex, pons, spinal cord, fetal brain, adrenal gland, adrenal cortex and pituitary, which mainly belong to nervous systems except the adrenal gland and adrenal cortex
(Figure 2). As shown in the Figure 2, each bar represents one tissue; the height of the bar represents the expression level of has-mir-488 in that tissue. The tissues with high expression level are highlighted in red and blue color, in which red bars represent tissues of nervous systems.
The exception is mir-1-1, which was reported to be heart specific by Landgraf et al. and was predicted to show high specificity in skeletal muscle in our study. However, mir-1 was also reported to show high specificity in both heart and skeletal in several other studies, which indicates that all the above 12 predictions in our study are right [24,25].
Furthermore, we also predicted that hsa-mir-208b shows high specificity in heart, skeletal muscle and tongue (Figure 3). As shown in the Figure 3, each bar represents one tissue; the height of the bar represents the expression level of has-mir-208b in that tissue. The tissues with high expression level are highlighted in red. However, hsa-mir-208b was not identified as tissue specific miRNA by Landgraf et al. [23]. It was reported that hsa-mir-208b show high heart-specificity by Liang et al. [24] and is associated with various cardiovascular diseases [12]. These results indicate that our prediction can provide us valuable assistance in identifying the tissue specific miRNAs.
Discussion
In summary, we presented a machine learning based approach to predict the co-expression patterns of the human intronic miRNAs and their host genes, which show a high accuracy and Table 3.Classification performance of the SVM classifier on two testing datasets.
Testing datasets Type Size Accuracy (%) Sensitivity (%) Specificity (%) Baskerville et al.’ co-expression data + 12 79 83 71
2 17 76 87
The combined data* + 5 95 100 83
2 16 94 100
*the combined data is the consistent part of Baskerville et al’s miRNA profile data/Su et al.’ mRNA profile data and Barad et al.’ miRNA profile data/Su et al.’ mRNA profile
data.
The symbol ‘‘+’’ means high co-expression and the symbol ‘‘2’’ means low co-expression. doi:10.1371/journal.pone.0004421.t003
Table 4.The prediction results on the combined testing data.
miRNAs Host gene Pearson’s correlation coefficients Calculated results Predicted results hsa-mir-28 LPP 0.2403 2 2 hsa-mir-140 WWP2 20.279 2 2 hsa-mir-149 GPC1 0.0334 2 + hsa-mir-23b C9orf3 0.2401 2 2 Has-mir-194-1 IARS2 20.4155 2 2 hsa-let-7g TMEM113 0.6539 + + hsa-mir-152 COPZ2 20.1915 2 2 hsa-mir-93 MCM7 0.7318 + + hsa-mir-107 PANK1 20.254 2 2 hsa-mir-30e NFYC 0.1416 2 2 hsa-mir-208 MYH7 0.0741 2 2 Has-mir-218-1 SLIT2 0.8282 + + Has-mir-106b MCM7 0.7093 + + Has-mir-105-1 GABRA3 0.1756 2 2 hsa-mir-24-1 C9orf3 0.0961 2 2 hsa-mir-215 IARS2 20.6153 2 2 hsa-mir-214 DNM3 20.3261 2 2 hsa-mir-186 ZRANB2 0.8033 + + hsa-mir-211 TRPM1 0.0692 2 2 Has-mir-199b DNM1 20.3855 2 2 hsa-mir-191 C3orf60 0.1413 2 2 The combined data is described as Table 3.
The symbol ‘‘+’’ means high expression and the symbol ‘‘2’’ means low co-expression.
doi:10.1371/journal.pone.0004421.t004
Table 5.Tissue-specific miRNAs that are also found in our predictions.
miRNAs *Tissues [23] miRNAs
Predicted tissues mir-1 Heart mir-1-1 Skeletal Muscle mir-488 Nervous system mir-488 Nervous system mir-218 Nervous system mir-218-2 Nervous system mir-449a Reproductive System mir-449a Ovary mir-9 Nervous system mir-9-1 Nervous system mir-128a Nervous system mir-128a Nervous system mir-153 Nervous system mir-153-1 Nervous system mir-302 cluster Embryonic tissue
and cell lines
mir-302 cluster
lymphoblasts
*The specific tissues listed in this column are identified by biological
experiments [23].
doi:10.1371/journal.pone.0004421.t005
validation and could be further extended to other species. We further applied this approach to all the human intronic miRNAs and predicted the tissues in which the miRNAs are expressed for the miRNAs showing high co-expression pattern with their host genes. We also tested the validation of our method by predicting tissue specific miRNAs and performed a comparison with tissue specific miRNAs identified by biological experiments. As a result, our predictions are confirmed to be right. However, limitations exist in our current approach, which could be improved in the future study. We know that the process of miRNA and gene transcription is very complex and could be affected by lots of factors. Therefore, in order to improve the accuracy of the classifier, it will be very important to find better features that are associated with the expression of the intronic miRNAs and their host genes, for example the trans-action elements. For the machine learning methodology, currently we assigned the intronic miRNA-host gene pairs into high co-expression ones and low co-expression ones based on the correlation coefficients between the profiles of the intronic miRNAs and their host genes. This treatment could miss some detailed information, which may be useful in accurately predicting the correlations of the expression profiles between novel
intronic miRNAs and their host genes. A regression model may provide more details in this situation. For the sample dataset, the current training dataset is small, which may affect the reliability of the classifier. Therefore, the prediction accuracy could be improved when more training samples become available. Furthermore, the current approach can only deal with the miRNAs that are within the introns of protein-coding genes. Developing computational approaches that can be used to predict the co-expression patterns for other kinds of miRNAs is also important. In a conclusion, our method can provide help in not only the understanding of miRNA expression and regulation but also the function of miRNAs, which can be further used to infer the miRNA-associated diseases.
Materials and Methods
The genome coordinate data of human miRNAs
We downloaded the genome coordinate data of the human miRNAs from the miRBase [21] on August 2007 (gff-version 2). This database records 528 items of genome coordinates of human miRNAs. The genome coordinates were used to discriminate
Figure 2. The predicted expression profile of mir-488, which indicates that mir-488 mainly show high expression values in central nervous system.Red and Blue bars represents high expression tissues, in which the red bar represents central nervous system tissues and the blue bar represents adrenal gland and adrenal cortex, respectively.
doi:10.1371/journal.pone.0004421.g002
Figure 3. The predicted expression profile of mir-208b, which indicates that mir-208b mainly show high expression values in heart, skeletal muscle, and tongue.Red bars represent high expression tissues. From the left to the right, the three red bars represent heart, skeletal muscle, and tongue, respectively.
whether one miRNA locates within the intron of a protein-coding gene or not.
The genome coordinates of human protein-coding genes
We obtained the genome coordinates data of known human RefSeq genes through the UCSC (University of California Santa Cruz) Table Browser (http://genome.ucsc.edu/, assembly: Mar. 2006, database: hg18, group: Genes and Gene Prediction Tracks, track: RefSeq Genes, table: refGene) [26]. Each item in this table lists one reference gene and its supplementary information, such as name, chromosome number, strand, transcription start position, transcription end position, coding region start position, coding region end position, number of exons, exon start positions, exon end positions etc. The genome coordinate data of protein coding genes together with that of miRNAs were used to determine whether a miRNA locates within the intron of a protein-coding gene.
Calculating the genome features of human miRNAs
The four feature vectors for the SVM classifier were calculated from the above genome coordinate data. We first mapped the genome coordinates of human miRNAs and protein-coding genes using Galaxy tool (http://g2.trac.bx.psu.edu/). We then calculat-ed the lengths of all intronic miRNAs, the lengths of miRNA-hosting introns, the lengths of miRNA-miRNA-hosting genes, the distance from the transcription start position of one host gene to its intronic miRNA, and the distance of the transcription start position of one host gene to the host intron. These parameters will be used as the features of the samples (the miRNA-host pairs).
The dataset used in training and leave-one-out cross validation
Baskerville et al. performed a human miRNA microarray experiment across 30 normal tissues and investigated the co-expression patterns of 29 pairs of intronic miRNAs and host genes. Some pairs show high expression but some others show low co-expression. In the dataset, we set a cutoff of correlation coefficient at 0.6 to discriminate high co-expression and low co-expression. We also performed a leave-one-out cross validation on this dataset.
The testing dataset
In order to test the generalization power of our approach, we validated the method on an independent testing dataset containing miRNA expression profiles as well as mRNA expression profiles. It has been reported that microarray data from different platforms or laboratories often show great differences. Therefore, to improve the reliability and the persuasion of the results, we adopted two sets of miRNA microarray data. One miRNA microarray dataset was presented by Baskerville et al. [14], the other was obtained from Barad et al. [27]. We downloaded the host gene expression profile from Su’s mRNA microarray data which are across 79 normal human tissues [22]. The intronic miRNAs in Baskerville et al.’s dataset and Barad et al.’s dataset were mapped to the host genes in Su’s dataset, respectively. We then calculated the Pearson’s correlation coefficients between the intronic miRNA
expression profiles and their host gene profiles for both miRNA microarray datasets. Only those intronic miRNA-host gene pairs that showed consistent correlation patterns in both two miRNA microarray datasets was reserved for further analysis. As a result, we obtained 21 intronic miRNA-host gene pairs, in which there are 5 high co-expression pairs and 16 low co-expression pairs, respectively (Table 5).
Support vector machine
Support vector machine (SVM) was introduced by Vapnik [28], and has a comprehensive applications in many classification and regression problems. The goal of SVM is to construct a classifier from well-labeled data (the training data) that can be used to classify the incoming unlabeled data (the testing data). For a binary classification problem, for a given dataset, xirepresents the feature
vector, while yirepresents the class labels (i = 1,2,…N, where N is
the number of samples), where xi[Rd, yi[fz1,{1g. Here, for the intronic miRNA and host gene co-expression prediction problem, the input vector dimension is 5 (d = 5). The class label +1 represents the high co-expression class, while21 represents the low co-expression class. Once the SVM was trained, it can be used to predict the class label (high or low co-expression) for a new sample (a new intronic miRNA and host gene pair). In this study, the LibSVM package[29] was used to train the SVM intronic miRNA and its host gene co-expression classifier and make predictions in the test dataset. We chose the Radial Basic Function (RBF) as the kernel function and tuned the parameters using the grid search strategy in LibSVM.
Software availability
We implemented our approach as a web server which is free for the scientific and technical community (http://cmbi.bjmu.edu.cn/ cepred/). The ‘‘cepred’’ software in linux and windows are also available for the scientific and technical community when requesting.
Supporting Information
Text S1 the predicted co-expression patterns of intronic miRNA
with their host genes
Found at: doi:10.1371/journal.pone.0004421.s001 (0.02 MB XLS)
Text S2 The predicted expression profiles of 71 miRNAs in 79
human tissues.
Found at: doi:10.1371/journal.pone.0004421.s002 (0.09 MB XLS)
Acknowledgments
We thank Prof. Xuegong Zhang at Tsinghua University for valuable advices and Ms. Meihan Gai for language corrections.
Author Contributions
Conceived and designed the experiments: QC. Performed the experiments: DW QC. Analyzed the data: DW. Contributed reagents/materials/ analysis tools: DW ML. Wrote the paper: DW JM TL EW QC.
References
1. Ambros V (2004) The functions of animal microRNAs. Nature 431: 350–355. 2. Bartel DP (2004) MicroRNAs: genomics, biogenesis, mechanism, and function.
Cell 116: 281–297.
3. Meister G, Tuschl T (2004) Mechanisms of gene silencing by double-stranded RNA. Nature 431: 343–349.
4. Jopling CL, Yi M, Lancaster AM, Lemon SM, Sarnow P (2005) Modulation of hepatitis C virus RNA abundance by a liver-specific MicroRNA. Science 309: 1577–1581.
5. Vasudevan S, Tong Y, Steitz JA (2007) Switching from repression to activation: microRNAs can up-regulate translation. Science 318: 1931–1934.
6. Esquela-Kerscher A, Slack FJ (2006) Oncomirs - microRNAs with a role in cancer. Nat Rev Cancer 6: 259–269.
7. Li J, Musso G, Zhang Z (2008) Preferential regulation of duplicated genes by microRNAs in mammals. Genome Biol 9: R132.
8. Cui Q, Yu Z, Purisima EO, Wang E (2006) Principles of microRNA regulation of a human cellular signaling network. Mol Syst Biol 2: 46.
9. Cui Q, Yu Z, Pan Y, Purisima EO, Wang E (2007) MicroRNAs preferentially target the genes with high transcriptional regulation complexity. Biochem Biophys Res Commun 352: 733–738.
10. Cui Q, Yu Z, Purisima EO, Wang E (2007) MicroRNA regulation and interspecific variation of gene expression. Trends Genet 23: 372–375. 11. Gusev Y (2008) Computational methods for analysis of cellular functions and
pathways collectively targeted by differentially expressed microRNA. Methods 44: 61–72.
12. Lu M, Zhang Q, Deng M, Miao J, Guo Y, Gao W, Cui Q (2008) An analysis of human microRNA and disease associations. PLoS ONE 3(10): e3420. doi:10.1371/journal.pone.0003420.
13. Krutzfeldt J, Poy MN, Stoffel M (2006) Strategies to determine the biological function of microRNAs. Nat Genet 38 Suppl: S14–19.
14. Baskerville S, Bartel DP (2005) Microarray profiling of microRNAs reveals frequent coexpression with neighboring miRNAs and host genes. RNA 11: 241–247.
15. Lagos-Quintana M, Rauhut R, Lendeckel W, Tuschl T (2001) Identification of novel genes coding for small expressed RNAs. Science 294: 853–858. 16. Lau NC, Lim LP, Weinstein EG, Bartel DP (2001) An abundant class of tiny
RNAs with probable regulatory roles in Caenorhabditis elegans. Science 294: 858–862.
17. Rodriguez A, Griffiths-Jones S, Ashurst JL, Bradley A (2004) Identification of mammalian microRNA host genes and transcription units. Genome Res 14: 1902–1910.
18. Kim VN, Nam JW (2006) Genomics of microRNA. Trends Genet 22: 165–173. 19. Sempere LF, Freemantle S, Pitha-Rowe I, Moss E, Dmitrovsky E, et al. (2004) Expression profiling of mammalian microRNAs uncovers a subset of brain-expressed microRNAs with possible roles in murine and human neuronal differentiation. Genome Biol 5: R13.
20. Zhou H, Lin K (2008) Excess of microRNAs in large and very 59 biased introns. Biochem Biophys Res Commun 368: 709–715.
21. Griffiths-Jones S (2004) The microRNA Registry. Nucleic Acids Res 32: D109–111.
22. Su AI, Wiltshire T, Batalov S, Lapp H, Ching KA, et al. (2004) A gene atlas of the mouse and human protein-encoding transcriptomes. Proc Natl Acad Sci U S A 101: 6062–6067.
23. Landgraf P, Rusu M, Sheridan R, Sewer A, Iovino N, et al. (2007) A mammalian microRNA expression atlas based on small RNA library sequencing. Cell 129: 1401–1414.
24. Liang Y, Ridzon D, Wong L, Chen C (2007) Characterization of microRNA expression profiles in normal human tissues. BMC Genomics 8: 166. 25. Zhao Y, Samal E, Srivastava D (2005) Serum response factor regulates a
muscle-specific microRNA that targets Hand2 during cardiogenesis. Nature 436: 214–220.
26. Karolchik D, Hinrichs AS, Furey TS, Roskin KM, Sugnet CW, et al. (2004) The UCSC Table Browser data retrieval tool. Nucleic Acids Res 32: D493–496. 27. Barad O, Meiri E, Avniel A, Aharonov R, Barzilai A, et al. (2004) MicroRNA
expression detected by oligonucleotide microarrays: system establishment and expression profiling in human tissues. Genome Res 14: 2486–2494. 28. Vapnik V (1998) The nature of statistical learning theory. New York: Springer. 29. Chang CC, Lin CJ (2001) LIBSVM: a library for support vector machines.