Publisher’s version / Version de l'éditeur:
Nature Materials, 9, 4, pp. 299-303, 2010-03-01
READ THESE TERMS AND CONDITIONS CAREFULLY BEFORE USING THIS WEBSITE.
https://nrc-publications.canada.ca/eng/copyright
Vous avez des questions? Nous pouvons vous aider. Pour communiquer directement avec un auteur, consultez la première page de la revue dans laquelle son article a été publié afin de trouver ses coordonnées. Si vous n’arrivez pas à les repérer, communiquez avec nous à PublicationsArchive-ArchivesPublications@nrc-cnrc.gc.ca.
Questions? Contact the NRC Publications Archive team at
PublicationsArchive-ArchivesPublications@nrc-cnrc.gc.ca. If you wish to email the authors directly, please see the first page of the publication for their contact information.
NRC Publications Archive
Archives des publications du CNRC
This publication could be one of several versions: author’s original, accepted manuscript or the publisher’s version. / La version de cette publication peut être l’une des suivantes : la version prépublication de l’auteur, la version acceptée du manuscrit ou la version de l’éditeur.
For the publisher’s version, please access the DOI link below./ Pour consulter la version de l’éditeur, utilisez le lien DOI ci-dessous.
https://doi.org/10.1038/NMAT2715
Access and use of this website and the material on it are subject to the Terms and Conditions set forth at
Spatially homogeneous ferromagnetism of (Ga, Mn)As
Dunsiger, S. R.; Carlo, J. P.; Goko, T.; Nieuwenhuys, G.; Prokscha, T.; Suter,
A.; Morenzoni, E.; Chiba, D.; Nishitani, Y.; Tanikawa, T.; Matsukura, F.;
Ohno, H.; Ohe, J.; Maekawa, S.; Uemura, Y. J.
https://publications-cnrc.canada.ca/fra/droits
L’accès à ce site Web et l’utilisation de son contenu sont assujettis aux conditions présentées dans le site LISEZ CES CONDITIONS ATTENTIVEMENT AVANT D’UTILISER CE SITE WEB.
NRC Publications Record / Notice d'Archives des publications de CNRC:
https://nrc-publications.canada.ca/eng/view/object/?id=af9eecf0-33a3-485c-a7b1-31adcc2f1b50
https://publications-cnrc.canada.ca/fra/voir/objet/?id=af9eecf0-33a3-485c-a7b1-31adcc2f1b50
Spatially homogeneous ferromagnetism of
(Ga, Mn)As
S. R. Dunsiger
1,2, J. P. Carlo
1, T. Goko
1,3, G. Nieuwenhuys
4, T. Prokscha
4, A. Suter
4, E. Morenzoni
4,
D. Chiba
5,6, Y. Nishitani
6, T. Tanikawa
5,6, F. Matsukura
5,6, H. Ohno
5,6, J. Ohe
7,8, S. Maekawa
7,8and Y. J. Uemura
1*
Mn-doped GaAs is a ferromagnetic semiconductor1,2, widely studied because of its possible application for spin-sensitive ‘spintronics’ devices3,4. The material also attracts great interest in fundamental research regarding its evolution from a paramagnetic insulator to a ferromagnetic metal5,6. The high sensitivity of its physical properties to preparation conditions and heat treatments7,8and the strong doping and temperature dependencies of the magnetic anisotropy9,10have generated a view in the research community that ferromagnetism in (Ga, Mn)As may be associated with unavoidable and intrinsic strong spatial inhomogeneity. Muon spin relaxation (µSR) probes magnetism, yielding unique information about the volume fraction of regions having static magnetic order, as well as the size and distribution of the ordered moments11–13. By combining low-energy µSR, conductivity and a.c. and d.c. magnetization results obtained on high-quality thin-film specimens, we demonstrate here that (Ga, Mn)As shows a sharp onset of ferromagnetic order, developing homogeneously in the full volume fraction, in both insulating and metallic films. Smooth evolution of the ordered moment size across the insulator– metal phase boundary indicates strong ferromagnetic coupling between Mn moments that exists before the emergence of fully itinerant hole carriers.
Since the 1990s, efforts to overcome an equilibrium chemical solubility limit of <0.1% Mn per formula unit in bulk (Ga, Mn)As have led to fabrication of thin films with higher Mn concentrations in pursuit of higher ferromagnetic Curie temperature (TC) values1,2. Such specimens, grown under conditions far from thermodynamic equilibrium, however, show high sensitivity of physical properties to preparation and heat-treatment methods, as demonstrated by a nearly 50% increase of TC by annealing metallic specimens7,8. This feature has raised serious questions about the spatial homogeneity of the system. Large peaks in the a.c. magnetic susceptibility observed well below the ferromagnetic TC values have been ascribed by Hamaya et al.9 to successive ferromagnetic transitions of different regions having widely different TC values. A recent µSR study14 reported that ferromagnetism develops only in about half of the sample volume in a film with
TC∼120 K. Such inhomogeneities, if intrinsic, will have major negative impacts on device applications involving magnetization manipulation2,15and polarized spin injection3. Spatial homogeneity
1Department of Physics, Columbia University, New York, New York 10027, USA,2Physik Department, Technische Universität München, D-85748 Garching,
Germany,3TRIUMF, 4004 Wesbrook Mall, Vancouver, British Columbia, V6T 2A3, Canada,4Paul Scherrer Institut, Laboratory for Muon Spin Spectroscopy, CH-5232 Villigen PSI, Switzerland,5ERATO Semiconductor Spintronics Project, Japan Science and Technology Agency, Sanban-cho 5,
Chiyoda-ku, Tokyo 102-0075, Japan,6Laboratory for Nanoelectronics and Spintronics, Research Institute of Electrical Communication, Tohoku University,
2-1-1 Katahira, Sendai 980-8577, Japan,7Institute for Materials Research, Tohoku University, Sendai 332-0012, Japan,8CREST, Japan Science and Technology Agency (JST), Sanbancho, Tokyo 102-0075, Japan. *e-mail: tomo@lorentz.phys.columbia.edu.
is also an important factor in better understanding the evolution from paramagnetic insulator to ferromagnetic metal at a few per cent Mn doping.
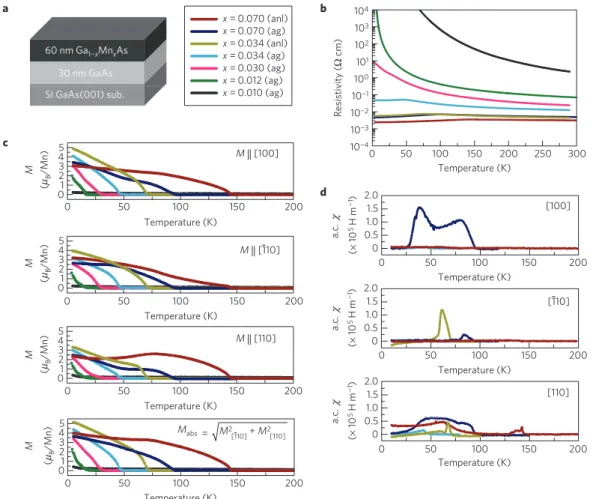
Unlike susceptibility and anomalous Hall effect measurements, which reflect ferromagnetic moments integrated over the sample volume, µSR produces distinguishable signals from magnetically or-dered and para/non-magnetic volumes, where the signal amplitudes are proportional to the respective volume fractions. We carried out µSR measurements using the special low-energy µSR beamline at the Paul Scherrer Institute (PSI), where muons with extremely reduced velocity can be implanted into thin-film specimens and stopped with a controllable depth with an uncertainty of 10–20 nm (ref. 16). Principles and instrumentation of the low-energy µSR method are described in Supplementary Information A. High-quality specimens of (Ga, Mn)As films with seven different levels of doping/heat treatment have been prepared at Tohoku University using molecular beam epitaxy (MBE). Each specimen has typical dimensions of 18 mm × 20 mm × 60 nm (Ga, Mn)As layers, as illustrated in Fig. 1a and shown in Fig. 2e. In the present low-energy µSR measurements, we adopted an incident muon momentum of 5 keV, which results in an average muon implantation depth of ∼30 nm with a spread (half-width at half-maximum) of ∼10 nm. In all of the figures in this letter, we adopt the colour-coding scheme in Fig. 1a to distinguish these specimens. Preparation meth-ods and heat-treatment conditions are described in Supplemen-tary Information B.
Figure 1b shows the resistivity curves of the specimens. As-grown (ag) films of Ga1−xMnxAs with x = 0.010, 0.012 and
0.03 show insulating or semiconducting behaviour, whereas the remaining as-grown and annealed (anl) samples of x = 0.034 and 0.07 show metallic behaviour. These metallic films show kinks in resistivity at the ferromagnetic ordering temperature. Results of d.c.- and a.c.-magnetization measurements are shown in Fig. 1c and d, respectively. The directional dependence of the d.c. results indicates significant magnetic anisotropy. Peaks in a.c. response are seen well below TCin some specimens. Similar behaviour previously observed was interpreted with two conflicting pictures based, respectively, on (1) mixed magnetic phases having different TC values9and (2) spin reorientation owing to temperature-dependent anisotropy direction10. Supplementary Information B, Table S1 shows TC estimated from resistivity and magnetization. The film
LETTERS
NATURE MATERIALS
DOI: 10.1038/NMAT2715 Temperature (K) [100] [110] [110] Mabs Temperature (K) Temperature (K) Temperature (K) Temperature (K) M2 [110] + M2[110] = M || [110] M || [100] M || [110] ( µB /Mn) ( µB /Mn) ( µB /Mn) M M M M ( µB /Mn) x =0.070 (anl) x =0.070 (ag) x =0.034 (anl) x =0.034 (ag) x =0.030 (ag) x =0.012 (ag) x =0.010 (ag) Resistiv ity ( a.c . Ω c m) Temperature (K) Temperature (K) Temperature (K) 2.0 1.0 1.5 0 0.5 2.0 1.0 1.5 0 0.5 (× 10 5 H m ¬1) (× 10 5 H m ¬1) b a c d 30 nm GaAs 60 nm Ga1¬xMnxAs SI GaAs(001) sub. 4 5 01 23 3 4 5 01 2 3 45 0 1 2 3 4 5 01 2 0 50 100 150 200 0 50 100 150 200 0 50 100 150 200 0 50 100 150 200 104 102 103 100 101 10 χ a.c . χ (× 10 5 H m ¬1) a.c . χ ¬2 10¬1 10¬4 10¬3 0 50 100 150 200 250 300 2.0 1.0 1.5 0 0.5 0 50 100 150 200 0 50 100 150 200 0 50 100 150 200 µ µ µ µFigure 1|Magnetization and resistivity of film specimens. a, Schematic view of thin-film specimens of Ga1−xMnxAs, having dimensions of
20 mm × 18 mm in surface area grown on a semi-insulating (SI) substrate, and colour-coding scheme of specimens with different Mn concentrations x and heat-treatment conditions: as grown (ag) and annealed (anl). b–d, Resistivity (b), remanent d.c. magnetization M (c) and a.c. susceptibility χ (d) of the specimens. Remanent mangetization values are normalized by using the nominal Mn concentration x. The absolute value of the magnetization Mabsin c
indicates a moment size of ∼4 µBper (nominal) Mn in the ferromagnetic state at T → 0. The a.c.-susceptibility peaks are seen well below TCin d.
with the lowest Mn concentration (x = 0.010) did not show ferromagnetic order above T = 5 K.
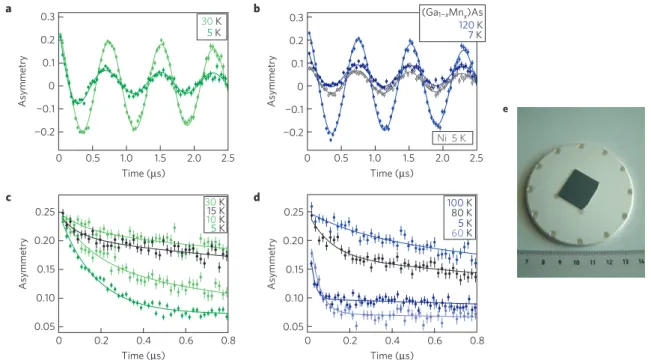
Figure 2a,b shows µSR time spectra obtained in a weak transverse field (WTF) of 100 G on films with x = 0.012 (ag) (TC∼15 K) and x = 0.07 (ag) (TC∼90 K). A marked damping of the signals seen at T = 5 K is due to inhomogeneous internal fields from ordered Mn moments. We also notice a long-lived component with slower relaxation persisting with a significantly reduced amplitude. The specimens were mounted on a silver sample holder, as shown in Fig. 2e, and exposed to a beam spread over a centrosymmetric area of 2.0–2.5 cm in diameter. The long-lived signal at T = 5 K is due mostly to muons that miss the (Ga, Mn)As film and stop in the silver plate. Figure 2c,d shows µSR time spectra in zero field obtained on the x = 0.012 (ag) and 0.07 (ag) films. The increase of the zero-field relaxation rate with decreasing temperature below TC is due to build-up of random static internal fields from ordered Mn moments. The faster damping of the signal at T = 5 K in Fig. 2d, as compared with that in Fig. 2c, indicates an increase of static internal fields with increasing Mn concentration x. The observed relaxation in zero field can be fitted well to an exponential decay exp(−Λt ) shown by the solid lines in Fig. 2c,d. Fitting methods adopted for data analyses of these spectra are described in Supplementary Information C.
The long-lived component in the WTF signal represents muons in a non- or paramagnetic environment. The amplitude of this signal is shown in Fig. 3a,b. The background signal level is calibrated by means of WTF measurements on a thin ferromagnetic Ni plate
(see Fig. 2b) having the same areal dimension as the (Ga, Mn)As films, which yields the estimate shown by the dashed line in Fig. 3a. The coloured dashed lines in Fig. 3b indicate background levels estimated for different (Ga, Mn)As films, according to their respective colour codings, having slightly different dimensions. The background estimate in Fig. 3b may be subject to a small systematic error of ∼0.01 in asymmetry, because we do not have Ni plate data at exactly the same beam tuning conditions for the samples shown in Fig. 3b. The full signal from the non-/paramagnetic environment was calibrated by a dry run on a silver plate without a (Ga, Mn)As film, and is indicated by filled triangles in Fig. 3a. Figure 3a,b demonstrates that all of the metallic films show transitions from a full paramagnetic volume to a nearly full volume of static magnetism, with a rather sharp onset at TC.
The amplitude of the paramagnetic signal above TCin insulating samples (x = 0.012 (ag) and 0.03 (ag)) is about 10% (0.02 in asymmetry) smaller than those in metallic films, whereas the insulating x = 0.01 (ag) film, which remains paramagnetic down to
T = 5 K, shows a slightly larger amplitude (Fig. 3b). We do not know
the origin of this behaviour. Other than that, however, the results on the insulating films indicate that they achieve static magnetism in nearly the full volume below TC, as in the metallic films. The onset of static order is rather sharp in the x = 0.03 (ag) film, whereas the
x = 0.012 (ag) film shows a more gradual increase of the ordered
volume fraction as the temperature is decreased through TC. This suggests percolating and inhomogeneous features near the onset of ferromagnetism at very low Mn doping near the para–ferro
Time (µs) Asymmetry 30 K 5 K 0.3 0.2 0.1 0 ¬0.1 ¬0.2 Time (µs) 2.5 2.0 1.5 1.0 0.5 0 Time (µs) Ni 5 K Asymmetry 0.3 0.2 0.1 0 ¬0.1 ¬0.2 2.5 2.0 1.5 1.0 0.5 0 Asymmetry 0.25 0.20 0.15 0.10 0.05 0.8 0.6 0.4 0.2 0 Asymmetry 0.25 0.20 0.15 0.10 0.05 Time (µs) 0.8 0.6 0.4 0.2 0 a b e c d 120 K 7 K (Ga1¬xMnx)As 30 K 15 K 10 K 5 K 100 K 80 K 5 K 60 K
Figure 2|µSR time spectra. a,b, µSR time spectra observed in a WTF of 100 G in a Ga1−xMnxAs film with x = 0.012 (ag) (TC= 16 K) (a) and a (Ga, Mn)As
film with x = 0.07 (ag) (TC∼ 90 K) and in a Ni plate that has the same dimension as the (Ga, Mn)As specimens (b). Long-lived precession signals
observed at T = 5 and 7 K in a and b are due to muons that missed the specimens and landed in a silver backing plate. c,d, The time spectra observed in zero field at several different temperatures in x = 0.012 (ag) (c) and 0.070 (ag) (d) samples. The increase of the relaxation rate with decreasing temperatures is due to build-up of static random local field from Mn moments. e, A photo of a sample film mounted on a backing plate made with silver. The error bars in a–d are statistical errors.
phase boundary. Such phase separation behaviour has also been found by µSR in the quantum para to helical (or ferro) evolution of the itinerant ferromagnets MnSi and (Sr,Ca)RuO3 (ref. 11) as well as in the spin-gap to antiferromagnetic phase evolution of a frustrated J1–J2spin system12.
The relaxation rate Λ of the main signal in zero field (after subtraction of the non-relaxing component mainly resulting from the background) increases below TC, as shown in Fig. 3c. This relaxation is caused by static and inhomogeneous local fields at the muon site from ordered Mn moments. The dilute and random substitution of Ga sites by Mn creates a situation for muons similar to the case of dilute-alloy spin glasses CuMn or AuFe (ref. 13). We found a monotonic and nearly linear relationship between TCand Λ(T → 0) as shown in Fig. 3d. Note the smooth evolution without anomaly between insulating and metallic films.
The internal field at the muon site is due to dipolar interaction. As described in Supplementary Information D, we simulate the local field using the Ewald–Kornfeld summation method, for Mn atoms randomly substituted at the Ga sites, having a static ferromagnetic moment of 4 Bohr magnetons each (consistent with the remanent magnetization shown in Fig. 1c). The half-width at half-maximum 1B of the resulting Lorentzian field distribution is shown in Fig. 3e, for the ˆx and ˆy components of the local field responsible for spin relaxation. The width 1B does not depend on the muon site location in the dilute limit, which may be justified for x < 0.08, where 1B depends linearly on x. The demagnetization field is negligible for the thin-film specimens magnetized parallel to the film surface. The simulation results in Fig. 3e and Supplementary Fig. D1 show a small dependence of 1B on the angle θ between the initial muon spin direction (ˆz) and the magnetization M direction. Although M is known to be parallel to the film surface, its precise direction and domain structure is not known in the present µSR studies in which the ferromagnetic state was achieved by cooling in zero field. For θ = 0, 1Bˆx=1Bˆybecause
of symmetry, and this width can be compared to experimental
results. For θ 6= 0, the root-mean-square average of 1Bˆxand 1Bˆy
gives an effective width of the field distribution.
The muon spin relaxation rate Λ observed in zero field corresponds to 1.33γµ1Bˆx,ˆy, where γµis the muon’s gyromagnetic ratio (see Supplementary Information C). Figure 3e includes the experimental results for x = 0.034 (anl) and 0.07 (anl), converted into the field width using this factor. We note that the real Mn concentration of the annealed films may be slightly reduced from the nominal starting value x, as the annealing process is known to remove interstitial Mn (ref. 8). The satisfactory agreement of ex-perimental and simulation values of 1B in Fig. 3e, however, would not be altered by these small uncertainties related to θ and Mn concentration. Good fits of the observed zero-field time spectra to a single exponential decay verify the Lorentzian distribution of local fields expected from dilute and randomly located Mn moments. These features in the width and shape of the field distribution rule out microscopic clustering or segregation of Mn moments.
These results clearly demonstrate that ferromagnetism in (Ga, Mn)As develops homogeneously in the full volume fraction, up to x = 0.07, when specimens are prepared appropriately, and give strong encouragement to reliable application of (Ga, Mn)As in spin-sensitive devices. The signature of spatial inhomogeneity was found only in the x = 0.012 (ag) film, near the para–ferro phase boundary, around a very reduced TC∼15 K. There is no change of ordered volume or µSR line shape at temperatures corresponding to the peaks in a.c. susceptibility in the x = 0.07 and 0.034 films ((ag) and (anl)) well below TC shown in Fig. 1d. This rules out the interpretation based on inhomogeneity9. Recent atom probe analyses, with a spatial resolution of 10 nm × 10 nm × 0.1 nm, found a homogeneous distribution of Mn atoms in (Ga, Mn)As with x = 0.037 (ref. 17). The Methods section discusses spatial and time resolutions of µSR measurements and comparisons with measurements using other probes.
The earlier µSR results14, which reported static magnetic order
LETTERS
NATURE MATERIALS
DOI: 10.1038/NMAT2715 Asymmetry Temperature (K) x = 0.01 (ag) Asymmetry Temperature (K) Silver Background (Ni) ( µ s ¬1) Temperature (K) (Ga1-xMnx)As ZF ZF Mn concentration x (%) Ref. (14) 0.25 0.20 0.15 0.10 0.05 0 250 200 150 100 50 0 Λ x = 0.070 (anl) x = 0.070 (ag) x = 0.034 (anl) x = 0.034 (ag) x = 0.030 (ag) x = 0.012 (ag) 0.25 0.20 0.15 0.10 0.05 0 150 100 50 0 100 80 60 40 20 0 0.8 0.6 0.4 0.2 0 150 100 50 0 TC (K) Λ (T → 0) ( µ s ¬1) 8 6 4 2 0 Δ Bx, y , z (kG) 0.6 0.4 0.2 0.8 0 y (0) x y (π/2) y (π/4) x y z θ µ M a b d e c 80 60 40 20 0 160 120 80 40 0Figure 3|Volume fractions and internal fields. a,b, Muon precession asymmetry, representing muons in para- or non-magnetic environments, observed
in a WTF of 100 G. The background level, estimated by placing a Ni plate at the sample position, is shown by the dashed line. The slightly different sizes of the specimens in b result in different levels of expected background, as indicated by dashed lines coded with the same colours for each specimen. The
x = 0.034 (ag) and (anl) films have the same dimensions, and consequently the same background level. c,d, Muon spin relaxation rateΛ observed in zero field. The right vertical axis in d shows the corresponding width 1Bˆx,ˆy,ˆzof the static random local field. The open circle shows the result reported in ref. 14
for an x = 0.06 (anl) film. e, The results of the simulation described in Supplementary Information D for the width 1B of the distribution of dipolar field from ordered Mn moments, where the ˆx and ˆydirections are defined in the inset and θ denotes the angle between the muon spin direction (ˆz) and the magnetization M direction. The simulation results show satisfactory agreement with the width derived from the observed relaxation rate Λ. The error bars in a–e are statistical errors.
the same low-energy µSR instruments and specimens larger than the present films. The difference between the results must be due partly to a subtle difference in preparation methods and/or growth condi-tions of the specimens. In Fig. 3d, we included the zero-field relax-ation rate Λ reported in ref. 14 for an x = 0.06 (anl) film (TC∼110 K)
by an open circle, which is about a factor two smaller than the trend of the present results for films with comparable TCvalues. The
d.c. magnetization M of the x = 0.06 (anl) film shown in Fig. 2b of ref. 14 corresponds to ∼2.0 Bohr magnetons per Mn, which is significantly smaller than the moment size in Fig. 1c obtained for the present specimens. These results imply that both Λ and M can be useful indicators of the sample quality and homogeneity of (Ga, Mn)As films. Note that we also found significant inhomogeneity by µSR in a separate x = 0.049 film prepared under a different and less ideal MBE growth condition (see Supplementary Information B).
Storchak et al.14used the slowly relaxing asymmetry in zero-field µSR to estimate the paramagnetic volume fraction. As discussed in Supplementary Information C, such a signal in zero-field µSR generally includes a contribution from muons that stopped in sites where the static local fields from the ordered moments are parallel to the initial muon polarization. WTF results allow more reliable estimates of para-/non-magnetic volume fractions, as demonstrated in the present work. The use of zero-field results probably led to an overestimate of the paramagnetic volume in the earlier report14. This may be another factor contributing to different conclusions between the earlier and present µSR studies.
The ferromagnetic exchange interaction between Mn moments was initially explained by a model with itinerant hole carriers
in the valence band provided by Mn impurities, that is, the
p–d Zener model5. More recently, a picture with carriers in the Mn impurity band has been proposed on the basis of optical and other studies6,18. For ferromagnetism in insulating films, recent theoretical proposals19,20 involve the hybridization of locally polarized valence band states and Mn impurity states where the Fermi level lies between the impurity bound states and the valence band.
The present results demonstrate that homogeneous ferromag-netism develops smoothly across the metal–insulator transition point. The resistivity values of semiconducting x = 0.030 (ag) and metallic 0.034 (ag) films in Fig. 1b differ by more than a factor of 200 at T = 2 K, whereas their TCvalues differ by only a factor of 1.5, and essentially identical responses are observed by µSR and magnetization. This feature implies that a sizable exchange inter-action between Mn moments can be mediated by holes before they become fully itinerant, and that the existence of the metallic state is not a precondition for formation of a homogeneous ferromagnetic state. This information should help development of future models regarding interplay between conduction (charge) and magnetic (spin) behaviours in the quantum evolution of the ground state.
After we submitted this letter, Sawicki et al.21 reported measurements of magnetization M on a very thin (4 nm thick)
x = 0.07 (Ga, Mn)As film carried out by varying hole density as a
function of gate voltage VG. The authors interpreted a continuous and monotonic dependence of M on VG to be inconsistent with the impurity-band picture. Although continuous variation of M is consistent with the present work, the gate-voltage study covers a
rather high-x yet low-TC sample near the two-dimensional limit having a wide spread of gated carrier concentrations, without obtaining direct information on the magnetically ordered volume fraction. This is a situation significantly different from that of the present study.
Methods
In general, µSR experiments detect magnetic order through a build-up of static internal field (mainly dipolar fields) with the time window given as tw∼1/γµBinst. The instantaneous field Binstis often comparable in magnitude to the static internal fields from ordered moments observed at T → 0. In the present case of (Ga, Mn)As,
twranges between 10 and 100 ns. As a real-space probe, µSR results do not contain much information about details of spatial spin correlations.
The spatial resolution of µSR can be inferred from the distance by which the magnetic dipolar field from a Mn atom decays into a level comparable to nuclear dipolar fields (∼5 G or less). The dipolar field from a static magnetic moment of 1 Bohr magneton is about 10 kG at a distance of 1 Å, and 10 G at 10 Å. Therefore, the internal field from a Mn moment of 4 Bohr magnetons becomes comparable to a typical magnitude of nuclear dipolar fields by the distance of 20–30 Å. If there is no frozen/ordered Mn moment within this distance, the implanted muon spin finds its environment equivalent to those in para- or non-magnetic systems.
These aspects, in addition to possible differences in preparation conditions of films, should be taken into account when the present results are compared with those from other methods. In particular, X-ray or Raman studies are sensitive to much shorter time windows and contain complementary information on long- and short-range correlations of the lattice and spin systems.
Received 17 August 2009; accepted 28 January 2010; published online 21 March 2010
References
1. Ohno, H. Making nonmagnetic semiconductors ferromagnetic. Science 281, 951–956 (1998).
2. Ohno, H. Ferromagnetic semiconductor heterostructures. J. Magn.
Magn. Mater. 272–276, 1–6 (2004).
3. Zutic, I., Fabian, J. & Das Sarma, S. Spintronics: Fundamentals and applications.
Rev. Mod. Phys. 76, 323–410 (2004).
4. Maekawa S. (ed.) in Concepts in Spin Electronics (Oxford Univ. Press, 2006). 5. Dietl, T., Ohno, H., Matsukura, F., Cibert, J. & Ferrand, D. Zener model
description of ferromagnetism in zinc-blende magnetic semiconductors.
Science 287, 1019–1022 (2000).
6. Burch, K. S., Awschalom, D. D. & Basov, D. N. Optical properties of III–Mn–V ferromagnetic semiconductors. J. Magn. Magn. Mater. 320, 3207–3228 (2008). 7. Potashnik, S. J. et al. Effects of annealing time on defect-controlled
ferromagnetism in Ga1−xMnxAs. Appl. Phys. Lett. 79, 1495–1497 (2001).
8. Jungwirth, T. et al. Prospects for high temperature ferromagnetism in (Ga, Mn)As semiconductors. Phys. Rev. B 72, 165204 (2005).
9. Hamaya, K., Taniyama, T., Kitamoto, Y., Fujii, T. & Yamazaki, Y. Mixed magnetic phases in (Ga, Mn)As epilayers. Phys. Rev. Lett. 94, 147203 (2005). 10. Wang, K.-Y. et al. Spin reorientation transition in single-domain (Ga, Mn)As.
Phys. Rev. Lett. 95, 217204 (2005).
11. Uemura, Y. J. et al. Phase separation and suppression of critical dynamics at quantum phase transitions of MnSi and (Sr1−xCax)RuO3. Nature Phys. 3, 29–35 (2007).
12. Uemura, Y. J. et al. Quantum evolution from spin-gap to antiferromagnetic state in the frustrated J1–J2system Cu(Cl,Br)La(Nb,Ta)2O7. Phys. Rev. B 80, 174408 (2009).
13. Uemura, Y. J., Yamazaki, T., Harshmann, D. R., Senba, M. & Ansaldo, E. J. Muon spin relaxation in AuFe and CuMn spin glasses. Phys. Rev. B 31, 546–563 (1985).
14. Storchak, V. G. et al. Spatially resolved inhomogeneous ferromagnetism in (Ga, Mn)As diluted magnetic semiconductors: A microscopic study by muon spin relaxation. Phys. Rev. Lett. 101, 027202 (2008).
15. Chiba, D. et al. Magnetization vector manipulation by electric fields. Nature
455,515–518 (2008).
16. Morenzoni, E., Prokscha, T., Suter, A., Luetkens, H. & Khasanov, R. Nano-scale thin film investigations with slow polarized muons. J. Phys. Condens. Matter
16,S4583–S4601 (2004).
17. Kodzuka, M., Ohkubo, T., Hono, K., Matsukura, F. & Ohno, H. 3DAP analysis of (Ga, Mn)As diluted magnetic semiconductor film. Ultramicroscopy 109, 644–648 (2009).
18. Burch, K. S. et al. Impurity band conduction in a high temperature ferromagnetic semiconductor. Phys. Rev. Lett. 97, 087208 (2006).
19. Ohe, J. et al. Combined approach of density functional theory and quantum Monte Carlo method to electron correlation in dilute magnetic semiconductors.
J. Phys. Soc. Jpn 78, 083703 (2009).
20. Bulut, N., Tanikawa, K., Takahashi, S. & Maekawa, S. Long-range ferromagnetic correlations between Anderson impurities in a semiconductor host: Quantum Monte Carlo simulations. Phys. Rev. B 76, 045220 (2007).
21. Sawicki, M. et al. Experimental probing of the interplay between ferromagnetism and localization in (Ga, Mn)As. Nature Phys. 6, 22–25 (2009).
Acknowledgements
We acknowledge financial support from US NSF DMR-05-02706 and DMR-08-06846 (Material World Network, Inter-American Materials Collaboration Program) and DMR-0213574 (MRSEC) at Columbia; and Grant-in-Aids from MEXT/JSPS, the GCOE Program at Tohoku University, the Research and Development for Next-Generation Information Technology Program (MEXT) and NAREGI Nanoscience Project at Tohoku. This work was carried out partially at the Swiss Muon Source SµS, PSI, Villigen, Switzerland. We also thank M. Sawicki for assistance in magnetization measurements.
Author contributions
Y.J.U. and E.M. proposed the present study and organized the research project with H.O. and S.M. The Low-Energy MuSR instrument at PSI was designed, tested and maintained by E.M., T.P., A.S. and G.N. Specimens of (Ga, Mn)As were made by using the MBE method at the laboratory of H.O. by D.C., Y.N., T.T., F.M. and H.O., who also obtained the results of susceptibility and resistivity of the specimens. S.R.D., T.G., J.P.C., G.N., A.S., E.M., D.C. and Y.J.U. worked on MuSR data acquisition at PSI, and S.R.D., T.G. and Y.J.U. analysed the MuSR spectra. J.O. and S.M. carried out calculation of internal field at the muon site. The main text was drafted by Y.J.U. after input from H.O., F.M. and S.M. on current models and understandings of electronic structures of (Ga, Mn)As. Supplementary Information A was drafted by G.N., B by D.C., C by S.R.D. and D by J.O. All authors subsequently contributed to revisions of the main text and Supplementary Information.
Additional information
The authors declare no competing financial interests. Supplementary information accompanies this paper on www.nature.com/naturematerials.Reprints and permissions information is available online at http://npg.nature.com/reprintsandpermissions. Correspondence and requests for materials should be addressed to Y.J.U.