Publisher’s version / Version de l'éditeur:
Physics in Medicine and Biology, 55, 8, pp. 2317-2331, 2010-04-01
READ THESE TERMS AND CONDITIONS CAREFULLY BEFORE USING THIS WEBSITE.
https://nrc-publications.canada.ca/eng/copyright
Vous avez des questions? Nous pouvons vous aider. Pour communiquer directement avec un auteur, consultez la
première page de la revue dans laquelle son article a été publié afin de trouver ses coordonnées. Si vous n’arrivez pas à les repérer, communiquez avec nous à PublicationsArchive-ArchivesPublications@nrc-cnrc.gc.ca.
Questions? Contact the NRC Publications Archive team at
PublicationsArchive-ArchivesPublications@nrc-cnrc.gc.ca. If you wish to email the authors directly, please see the first page of the publication for their contact information.
NRC Publications Archive
Archives des publications du CNRC
This publication could be one of several versions: author’s original, accepted manuscript or the publisher’s version. / La version de cette publication peut être l’une des suivantes : la version prépublication de l’auteur, la version acceptée du manuscrit ou la version de l’éditeur.
For the publisher’s version, please access the DOI link below./ Pour consulter la version de l’éditeur, utilisez le lien DOI ci-dessous.
https://doi.org/10.1088/0031-9155/55/8/013
Access and use of this website and the material on it are subject to the Terms and Conditions set forth at
Added soft tissue contrast using signal attenuation and the fractal
dimension for optical coherence tomography images of porcine arterial
tissue
Flueraru, C.; Popescu, D. P.; Mao, Y.; Chang, S.; Sowa, M. G.
https://publications-cnrc.canada.ca/fra/droits
L’accès à ce site Web et l’utilisation de son contenu sont assujettis aux conditions présentées dans le site LISEZ CES CONDITIONS ATTENTIVEMENT AVANT D’UTILISER CE SITE WEB.
NRC Publications Record / Notice d'Archives des publications de CNRC: https://nrc-publications.canada.ca/eng/view/object/?id=261c8bbb-6090-4792-a1c8-351ec1e4b554 https://publications-cnrc.canada.ca/fra/voir/objet/?id=261c8bbb-6090-4792-a1c8-351ec1e4b554
Added soft tissue contrast using the signal attenuation and
the fractal dimension for optical coherence tomography
images of porcine arterial tissue
C Flueraru1, D P Popescu2, Y Mao1, S Chang1 and M G Sowa2
1 Institute for Microstructural Sciences, National Research Council of Canada 1200 Montreal Road, Ottawa, ON, K1A 0R6, CANADA
2 Institute for Biodiagnostics, National Research Council of Canada 435 Ellice Avenue, Winnipeg, MB, R3B 1Y6, CANADA Email: costel.flueraru@nrc-cnrc.gc.ca
Abstract: Optical coherence tomography (OCT) images of left-descending coronary tissues harvested from three porcine specimenswere acquired with a home-build swept-source optical coherence tomography setup. Despite the fact that OCT is capable of acquiring high resolution circumferential images of vessels, many distinct histological features of a vessel have comparable optical properties leading to poor contrast in OCT images. Two classification methods were tested in this report for the purpose of enhancing contrast between soft-tissue components of porcine coronary vessels. One method involved analyzing the attenuation of optical coherence tomography signal as a function of light penetration into tissue. We demonstrated that by analyzing the signal attenuation in this manner we were able to differentiate two media sub-layers with different orientations of the smooth muscle cells. The other classification method used in our study was fractal analysis. Fractal analysis was implemented in a box counting (fractal dimension) image processing code and was used as a tool to differentiate and quantify variations in tissue texture at various locations in the OCT images. The calculated average fractal dimensions had different values in distinct regions of interest within the imaged coronary samples. When compared to the results obtained by using the attenuation of the OCT signal, the method of fractal analysis demonstrated a better classification potential for distinguishing amongst the tissue regions of interest.
PACS: 42.30.Wb, 61.43.Hv, 87.85.Pq, 85.57.cj
1. Introduction
The build-up of plaque within arteries, atherosclerosis, is the common root of many cardiovascular afflictions with stroke and heart attacks being the most prominent. The disease was once exclusively thought of as an occlusive disease where plaque accumulation resulted in the narrowing of the lumen of peripheral, coronary or cerebral arteries leading to diminished blood flow to regions of the periphery, brain or heart. Our understanding of atherosclerosis has evolved significantly and nowadays there is interest in understanding the biology occurring at the vascular wall and the composition of plaque rather than strictly focusing on luminal narrowing (Libby 2006).
Minimally invasive, catheter – based, intravascular imaging has been routinely used to help determine the severity of vascular disease in patients, localize obstructions and culprit vascular lesions and assess the success of interventions or treatments aimed at resolving vascular complications. X-ray angiography, used for decades, has been shown to be a safe and effective method for detecting narrowed or blocked vessels. However, the technique can only visualize the diameter of the lumen of the vessel and provides no other structural or anatomical information. Given our evolving understanding of atherosclerosis, alternative techniques have been sought that enable imaging of the vessel wall. Intravascular ultrasound (IVUS) was introduced in the 70’s and produces circumferential tomographic images thereby providing anatomical information of the vessel wall (Bom et al 1972). In IVUS a transducer emits ultrasound between 20 – 40 MHz and then receives the ultrasound that is backscattered by the surrounding tissue. While the operating acoustical frequency of the device dictates the upper limit on the spatial resolution of the IVUS images, 40 – 20 µm for 20 – 40 MHz transducers respectively, practically the resolution of IVUS is usually poorer than 100 µm. This method relies on abrupt changes in the acoustical impedance that produce strong back reflections of ultrasound thus providing the contrast observed in IVUS images. For example, the leading edges of the intima and the blood – filled lumen of an artery have a strong acoustical impedance mismatch and this boundary is well visualized by ultrasound. However, different anatomical features of the vascular wall and plaque have comparable echogenicity and thus are poorly distinguished based on the amplitude of backscattered ultrasound. The limitations in resolution and contrast of various soft-tissue components that make-up the vessel wall and plaque have lead to two milestones in intravascular imaging. Optical coherence tomography (OCT) was developed because it offered higher resolution (~10 µm) over the established IVUS technology (Zysk et al 2007, Farooq et al 2009). In the same time, the detailed features of the backscattered ultrasound were analyzed to improve the soft-tissue contrast of IVUS (Nair et al 2002, Murashige et al 2005, Kawasaki et al 2001). The reliability and clinical utility of improving soft-tissue contrast using autoregressive, Fourier and wavelet methods of modeling of the backscattered ultrasound signal are being actively investigated with several groups reporting improved accuracy and reproducibility of IVUS for measuring tissue properties compared to conventional IVUS images based solely on the amplitude of the backscattered ultrasound signal (Nasu et al 2006, Mehta et al 2007, Honda and Fitzgerald 2008). Concurrent with these developments in IVUS, OCT has evolved rapidly as a high resolution intravascular imaging methodology.
Intravascular OCT is based on the interferometric detection of low-coherence light backscattered from tissue. OCT has an axial resolution that is determined by the coherence length of the superluminiscent diode used as light source or by the scanning range for swept sources, which are usually smaller than 10 µm. This resolution offers the possibility to investigate details of the morphology of the arterial wall not resolved by IVUS. Brezinsky et al (1996) demonstrated the ability of OCT to image, in detail, vascular anatomy and vascular pathology based on changes of the optical refraction index occurring within the sample. Despite its advantage in resolution OCT, similar to IVUS, has also limited soft-tissue contrast. Therefore it seems likely that there will be
a clinical need to develop a reliable procedure for enhancing the soft-tissue contrast in OCT images. While, without doubt, the image itself can provide important diagnostic information, there are also new methods of tissue characterization that have been developed through spectroscopic OCT and quantitative OCT. Spectroscopic OCT investigates the spectral response while the quantitative OCT extends the investigation to non-spectral parameters. Analyzing the spectroscopic features can enhance the contrast by differentiating tissue using spectral information such as the spectral center of mass of the detected spectrum at each pixel in the image (Morgner et al 2000).
In order to go beyond the raw information provided by an intravascular OCT image, reliable quantitative parameters need to be identified for the purpose of improving the sensitivity and the specificity in detecting and distinguishing vascular pathologies. For achieving this purpose, the presented study will be focused on correlating the attenuation coefficient with depth of the OCT signal and the fractal dimensions of various regions of interest that correspond to the known morphology and texture of arterial tissue.
2. Experimental setup and ultra-small optical probe
Among the multitude of OCT technologies available, the swept-source Fourier-domain OCT offers higher imaging speed and better signal-to-noise performance. The OCT setup reported here uses a commercially available fast swept laser with a scanning frequency of 20 kHz, a spectral range of 110 nm centered at 1320 nm with a source power of 10 mW (SANTEC, Japan). Light from the source is directed through a 2 x 2 fiber coupler on the reference mirror and the sample arm. The back reflected signals from both mirror and sample are input into a second 2 x 2 fiber coupler configured in a Michelson geometry. Its two outputs become input for a balanced detector (New Focus). The balanced detection output is recorded with a digitizer (Alazartech) at a 100 MHz sampling rate. Based on the time duration of the laser sweep about 3200 measurement points per A-scan were recorded with a 14-bit resolution. The records were re-sampled to equal frequency intervals and subjected to an inverse Fourier transform. The result is a depth profile (scan) of the sample reflectance. The standard B-scan image used for this study contains 900 A-scans. The resolution of the setup is 7 µm in the axial direction. The sample arm includes an optical probe mounted on a galvo-scanner, which focuses the light on the sample through a home-built fiber ball lens. The OCT setup has a measured sensitivity of 107 dB.
Typically, in turbid environments, OCT has an imaging penetration of a few millimeters because of the absorption and the scattering of light. Despite the limited penetration depth, OCT technology proves its utility as a catheter based imaging method to study the vascular wall where atherosclerotic plaques form and develop. Therefore it is critical to develop an ultra-small optical probe that could fit into the narrow lumen of major arteries without damaging the vessel wall. Good control of the beam intensity profile, spot size, working distance, optical aberrations and losses, are also crucial for ensuring the quality of the OCT images. The design and fabrication of such an ultra-small optical probes used for this work was described in previous
publications
(Mao et al 2007, Mao et al 2008).
There is a trade-off between the depth of the field and the beam spot size. A large depth of field unavoidably results in a large diameter spot size due to the constraints imposed by Gaussian optics. For this application, the optimal depth of field is in the range of 0.8-1.5 mm in the air and yields a spot diameter in the range of 26-35 µm at 1300 nm wavelength. The optical probe used in the sample arm of the OCT system was fabricated at the end of a single mode optical fiber (SMF). A fiber spacer with a homogeneous refractive index and of specific length had to be added after the SMF in order to act as a beam expander prior to beam focusing in order to achieve a
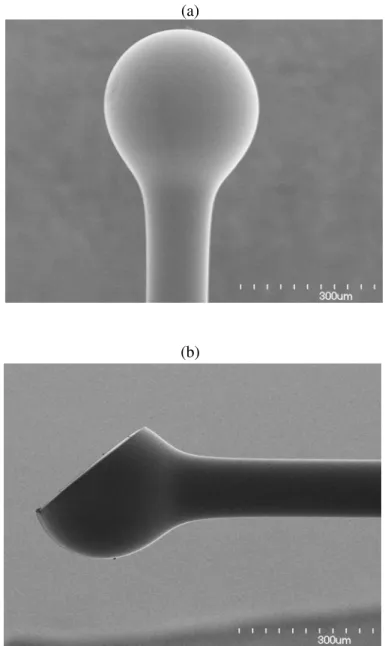
suitable working distance. For the ball lens probe, a fiber spacer with a 250-µm outer diameter was fusion-spliced via arc welds to the SMF-28 fiber and then accurately cleaved to the required length. An extra length of core-less fiber is used to fabricate the ball. The tip of the fiber spacer was fused via arc welds to the ball shape by selecting a specific fusion setting. Fig.1a shows the ball shape. The side view is achieved by polishing the ball at a certain angle (see figure 1b). In this report we used a forward view probe with a ball lens (figure 1a) for acquiring OCT images of
ex vivo pieces of porcine coronary left descending arteries.
(a)
(b)
Figure 1 Ultra-small probe with ball lens. a) used for forward view and b) used for side view.
3. Methods and materials
Segments of coronary left descending artery from three porcine specimens were snap-frozen and stored at -80 C after they were harvested. After a short period of thawing at the room temperature the arterial samples were cut open to expose their luminal surface to the OCT beam. The
acquisition of images was conducted at room temperature.
The probe in the OCT sample arm used to acquire OCT images was a ball lens fiber with the following specifications: working distance 1.1 mm, depth of field 0.9 mm and spot size 28.2 µm. The catheter was used in the forward view geometry with the arterial sample placed in a horizontal position with lumen exposed to the probing beam.
In order to obtain an accurate quantitative estimation of the optical properties of the arterial tissue being studied, the effect of the axial point spread function (PSF) of the sample arm must be considered. Adifference in the position of the confocal and coherence gate leads to significant error in determining the attenuation coefficient of the sample (Izzat et al 1996). The scattering properties of sample can change the PSF shape with an additional negative impact on the quantitative determination of the optical parameters. Different models for the axial PSF of the sample arm have been proposed (van Leeuwen 2003).
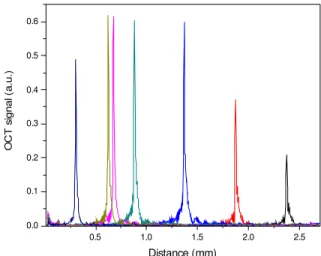
The axial PSF's of the optical probes used in the sample arm were measured for different positions using a mirror as a sample. Results are plotted in fig. 2. The shape of PSF is almost identical over one millimeter depth of field distance that also corresponds to the Rayleigh length for which the optical probe was designed. Therefore if the investigated depth within the sample is bracketed inside this range then the coherence gate is matched with the confocal gate and the axial PSF correction can be set to 1. If the confocal and coherence gates are shifted then the decay in the A-scan signal could be partially attributed to the fact that part of the optical power back-reflected from the sample in the focal spot is not collected by the detection system.
0.5 1.0 1.5 2.0 2.5 0.0 0.1 0.2 0.3 0.4 0.5 0.6 O C T s ig n a l ( a .u .) Distance (mm)
Fig
ure 2 The axial PSF of the OCT system measured with a mirror positioned at different locations in the sample arm. A constant axial PSF is measured over 1mm distanceThe porcine arterial samples used in this study were from healthy animals where the arterial wall anatomy is well characterized and consists of three layers: intima, media and adventitia that are easily distinguishable in a standard histological preparation. The intima is the layer inside the blood vessel that also contains the endothelial layer. The media follows the intima and consists of elongated muscle cells and elastin fibers. The outer layer, the adventitia, is largely composed of collagen fibers with the role to protect and to anchor the vessel to the surrounding structures.
Image acquisition was performed in two directions: parallel and perpendicular to the direction of the blood flow. Available were samples of coronary left descending arteries harvested from three porcine specimens and for each sample there was a set of ten OCT images collected from different locations.
4. Quantitative analysis
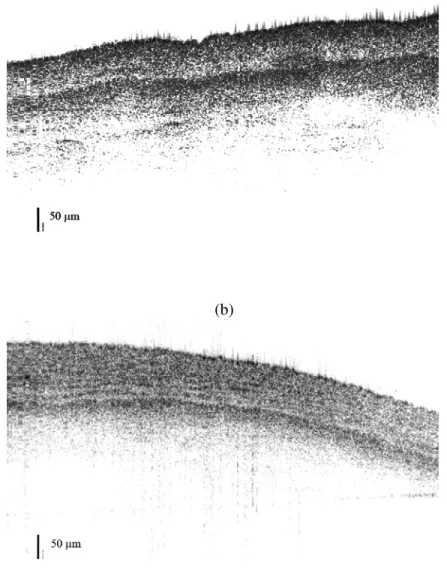
The specificity of the OCT measurements is in general based on the variation of gray levels within OCT images. An overview of the acquired images demonstrates that OCT as a direct method can be used successfully to identify various anatomical features of arterial wall. Figures 3a and 3b show the OCT images (B-scans) obtained after scanning both parallel and perpendicular to the direction of blood flow. The OCT images acquired during this study from porcine arterial samples clearly display the three layers: intima, media and adventitia.
(a)
(b)
Figure 3 OCT images (B-scans) of porcine arterial tissue acquired using a forward view ball lens while scanning a) along the blood flow and b) perpendicular to the blood flow. Differences in texture are observed between the two images.
The intima layer shows up as a bright layer on the top of a darker media layer. Nevertheless it is difficult to evaluate the precise thickness of intima because it does not have a clear demarcation from the media. However, further differentiation of soft tissue structures is highly desirable. A proper quantification of local tissue optical properties and texture could provide new classification parameters to further distinguish anatomical features within the vessel wall and help in the detection of vascular pathologies using OCT imaging. A parameter tested in this report is the attenuation coefficient of the recorded OCT signal measured at different depths into the tissue. Previously, quantitative analysis based on the optical attenuation coefficient of the OCT signal demonstrated its potential for discriminating between plaque and arterial wall components (Van der Meer et al 2005, Van der Meer et al 2005).
4.1. Attenuation coefficient
Each A-scan of an OCT image represents the dependence on depth of the detected OCT signal that is due to the backscattered light from within the sample. The OCT signal is attenuated due to scattering and absorption of light within the turbid medium. The attenuation coefficient can be calculated by fitting the experimental A-scan with model based on single or multiple light scattering. In a single scattering model it is assumed that only light backscattered once contributes to the OCT signal. Thrane et al (2000) proposed a model of the OCT signal that considers multiple scattering. Faber et al (2004) discussed in detail single versus multiple scattering models used in the analysis of OCT signals. We compared the single scattering and multiple scattering models with recorded OCT signals by evaluating the goodness-of-fit for both models (Thrane et al 2000). In the case of the single scattering model, the fit parameter is the attenuation coefficient, while in the case of the multiple scattering there were two parameters used: attenuation coefficient and root-mean-square scattering angle. The goodness-of-fit for both models was evaluated by comparing the correlation coefficient R2 between the model prediction and the experiment A-scans. The single scattering model consistently gave a higher correlation with the experimental A-scans. This finding is not surprising since during imaging the confocal and the coherence gates were purposely overlapped in order to reduce the contribution from multiple scattering to the OCT signal. We therefore concluded that a single scattering model offers an accurate description of our OCT data and that it is suitable to model for the OCT signals acquired in this study. In this model, the mean photo-detector current recorded along the sample beam axis is directly related to the OCT signal generated at the corresponding depths within the sample and it can be approximated by the following relation:
( )
z
h
( )
z
exp
(
2
z
)
i
∝
⋅
−
µ
a (1)In this relation i(z) represents the dependence on depth of the photo-current, h(z) is the axial PSF of the sample arm and µa is the attenuation coefficient of the OCT signal.
In order to obtain a smooth profile that ensures a reliable estimation of the attenuation coefficient, a summation of all 900 A-scans that compose our standard B-scan image is performed thus obtaining a compounded profile (fig. 4 a and b). Preceding the summation, a procedure to align the pixels corresponding to the air/sample interface in each A-scan was performed on every image. This procedure compensated for the non-horizontal sample surface. The attenuation coefficient of the compounded profile is calculated using the single scattering model with fixed focus geometry described by equation (1). Only fits with correlation coefficient R2 higher than 0.85 are considered reliable and used in this report. The attenuation coefficients of the OCT signal calculated for each layer and averaged over ten OCT images are shown in table 1. The first layer (tunica intima) is too thin so the number of data points available along A-scans that can be used to calculate the attenuation coefficient for this layer is small therefore the fitting procedure generates
larger errors. 250 500 750 -35 -30 -25 -20 -15 Adventitia OCT sig nal (a.u.) Optical Distance (µm) a Media 250 500 750 -35 -30 -25 -20 -15 Adventitia Media O C T signal ( a .u.) Optical Distance (µm) b
Figure 4 Example of a compounded profile resulted by
averaging 900 A-scans of arterial tissue acquired while scanning: a) along the blood flow b) perpendicular to the blood flow. Arrows indicate the interface locations.
In the medial layer we identified two sub-layers (see the figure 4a and figure 4b) with different textures, each associated with a different value of an OCT attenuation coefficient. The arrows from figure 4a and figure 4b approximately indicate where the interfaces of each sub-layer are located. The first sub-layer corresponds to a region of smooth muscle where the cells are aligned
predominately along the arterial circumference. The OCT signal corresponding to this sub-region has a higher attenuation coefficient when scanned parallel to the direction of blood flow compared to the attenuation obtained when the signal is acquired perpendicular to the direction of flow.
Table 1 Attenuation coefficient of porcine arterial tissue determined from OCT images by a single scattering model.
Along the blood
flow (mm-1)
Perpendicular to the blood flow (mm-1)
Intima 15.88 ± 2.07 14.04 ± 1.72
Media 4.60 ± 0.29 1.59 ± 0.19
5.63 ± 0.05 8.31 ± 0.09
Adventitia 1.19 ± 0.02 1.36 ± 0.03
As it can be seen in the OCT images, this first sub-layer of the media is composed of circular smooth muscle fibers that are crossed by the laser beam when scanning in the direction of blood flow. When scanned in the transverse direction to blood flow, the laser beam scans along the muscle fiber, the light encounters fewer interfaces therefore scattering is reduced and the signal attenuation is lower. The attenuation coefficient for the OCT signal corresponding to the second sub-layer of the media shows a reversed trend with respect to the scan direction. In this section of the media, the smooth muscle fibers are oriented in the direction of blood flow. Therefore, each of the two sub-layers previously identified as part of media leaves its characteristic fingerprint within the recorded OCT signal. The orientation of the coronary muscle fibers in the media leads to a directional anisotropy of the optical properties of the media that is visible in our OCT images and can be quantified by the attenuation coefficient of the OCT signal. Using histological staining , Seidel (1997) identified the same change in orientation of the smooth muscle cells versus depth in tunica media from cells aligned predominately along the arterial circumference (the inside sub-layer) to along perpendicular to the arterial circumference (the outside sub-sub-layer).
The directional dependence of the OCT attenuation coefficient was only observed in the media. The attenuation coefficient of OCT signal that propagates within the adventitia does not depend on the scanning direction. This indicates an isotropic texture for this layer of the artery.
Figure 5 shows the histological image of an H&E stained piece of porcine left descending coronary artery. The intima, media and adventitia are indicated and the white lines mark the interface between adjacent layers. The media has two sub-layers, each showing a different texture. The first sub-layer located close to intima shows smooth muscle texture oriented circumferentially (along the white arrow). The second sub-layer of the media, which makes the transition from the media to the adventitia, shows a smooth muscle texture which is oriented along the direction of blood flow (perpendicular to the page).
Analysis of the attenuation of the back-reflected OCT signal correlates with the gross and detailed morphology of the vessel that has been revealed by histological staining and microscopic analysis. Yet OCT has also the capability of providing such detailed morphological information during in-vivo measurements. Nevertheless, the challenges posted by in-vivo acquisition of intravascular OCT images restrict the amount of data that could be safely acquired during a clinical situation. Therefore there is a need for supplementary parameters that could be used to compensate for the information lost due to a smaller acquired data set.
Fig. 5 Optical microscopy of an H&E stained piece of porcine left descending coronary artery. The intima, media and adventitia are indicated. The media contains two sub-layers and their boundary is marked with a white line. The smooth muscle in the sub-layer adjacent to the intima is oriented circumferentially (white arrow oriented along the circumference) while the muscle fibers in the other sub-layer are along the direction of blood flow (direction perpendicular to the page).
4.2. Fractal analysis of texture
An important feature that can be used to differentiate various regions of the same sample is texture. Texture refers to the physical appearance of a region and it is extensively used in light (Yogesan et al 1996) or fluorescence (Atlamazoglou et al 2001) microscopy images to probe different structures in cancer diagnostics. The texture of an OCT image should also contain, embedded within its speckle, information about the physical nature of the sample. There are three approaches for texture analysis: statistical, spectral and through structural technologies. The potential of the third method, also known as the fractal approach, was tested to extract information from OCT data.
The axial resolution of OCT images acquired with a swept laser source is determined by the sweep range. Transverse resolution is equated roughly with the diameter of the probing beam of the low coherence light source. Generally, fractal analysis of two-dimensional texture starts by scaling the images to obtain the same spatial resolution in both directions. In this work, the analysis is performed exclusively along individual A-scans implying that no correction of the transverse resolution is needed. The first texture analysis of OCT images was proposed by Gossage et al (2003) Natural parameters that can be associated with texture are the standard deviation and the variance from the mean value of the A-scan. However, only in the case when the sample does not have a significant variation of its homogeneity canthe small deviations of the A-scan profile be attributed solely as a result of speckle and texture morphology.
Standard deviation and variance from the mean are used in statistical analysis approaches and have a correspondence in measurements of roughness. In this work, we calculated these
parameters as quantitative measures of the roughness of all the A-scan profiles contained within the regions of interest (ROI) where differences in tissue morphology were visibly apparent. It has been found that this approach did not reliably differentiate between the various known soft tissue types that make up the layers of a porcine artery. It has been also previously shown that the aforementioned roughness parameters do not adequately describe the morphology of very irregular surfaces (Flueraru et al 1997).
A parameter that could better extract arterial morphology from an OCT A-scan is the fractal roughness. Fractal roughness represents the fractal dimension of the profile investigated. An interesting aspect of fractals is their property of self-similarity meaning that every part of a curve is similar to the curve as a whole except for a scaling factor. Natural fractals do not show a geometric self-similarity as the term was previously defined, but instead they present what has been called a statistical self-similarity (also called self-affinity). This means that the subsets are scaled down from the original and identical in statistical terms with original. As an example, an important class of statistically self-similar fractals is the fractional Brownian functions (Mandelbrot and van Ness 1968).
In our study, fractal analysis was carried out on each A-scan that was part of an ROI. The general definition of fractal dimension was given by Mandelbrot and van Ness (1968). In this type of analysis the fractal dimension is not the only indicator; there are a few other parameters that can be applied, such as: the Hurst coefficient, the Minkowski index, box-counting dimension and others (for a review of methods used to calculate Hurst coefficient and Minkowski index see Verhoeven and Thijssen (1993)). Often due to practical reasons, the fractal dimension is identified with box-counting dimension. The box-counting dimension is widely used in physics and other sciences because it can be easy computed. It was also demonstrated that the box-counting dimension is greater or equal to the Hausdorff dimension (Mandelbrot and van Ness 1968).
In order to calculate the box-counting dimension for our particular application we have used the following algorithm: (i) the A-scan portion part of an ROI was “covered” with a uniform set of boxes of side length li; (ii) the non-empty boxes Ni, i.e. the boxes containing a portion of the
A-scan profile, corresponding to box size li are counted; (iii) the first two steps are repeated for
different box sizes while the box sides are decreased by a factor of two; (iv) the box-counting dimension is the slope of the line obtained by plotting the number of non-empty boxes Ni against
box side length li on a log-log scale.
There is a maximum and a minimum box size used in calculating the fractal dimension. In this report the minimum box size is half of the coherence length. The maximum box size is given by the largest value between maximum roughness of the A scan (i.e. the vertical distance between the highest “mountain” and deepest “valley”) and the A-scan length. In the OCT images the surface irregularities are smaller than the penetration depth. A large difference between the maximum and the minimum box size translates into a larger number of points used for the calculation of the fractal dimension. While investigating the fractal dimension of metallic fracture surfaces Kotowski (2006) demonstrated that the fractal roughness (dimension) shifts as the length of the surface profile increase. By plotting the fractal dimension versus length of surface profile he found a plateau called the characteristic fractal dimension. In the case of OCT images the length corresponding to the surface profile is the depth of the A-scan quantity, as it is defined in Verhoeven and Thijssen (1993). Since the penetration depth of OCT is limited a similar analysis with one proposed by Kotowski (2006) is not applicable. This indicates that the characteristic fractal dimension regime may not be reached however by keeping the same length (in this case A-scan depth) a comparison of the fractal dimension between different regions is relevant (Kotowski 2006). Therefore the fractal dimension of any A-scan profile can be any fractional
number between one – the fractal dimension of a straight line and two which constitutes the fractal dimension of a flat plane.
For the fractal analysis, the transition from optical distances was done by using a refractive index of 1.4 recently measured for porcine arteries (Kim et al, 2006). In this report the minimum ROI depth was in the range of 60-70 µm which yields a minimum of five points for the calculation of the fractal dimension for each A-scan. In the case of a deeper ROI, the region was divided in “image blocks” each having a depth of about 60-70 µm. The analysis was repeated for each “image block”. In this way the number of points required for calculating the fractal dimension of each A-scan was the same. Repeating this analysis for each “image block” within the ROI yielded a larger statistical ensemble of fractal dimensions. This report investigates the relative change of the fractal dimension obtained from different ROIs.
The algorithm described above was applied to the portions of all scans that were part of selected ROIs. The original size of B-scan images used in this report was 1024 x 900 pixels and the selected ROI's contained the available 900 A-scans. The results are plotted in the form of a histogram plot showing the frequency of occurrence of a fractal dimension versus the fractal dimension.
As it was indicated in the previous section, different regions were identified and assigned according to the known blood vessel wall anatomy. For example regions A and B from fig.6 are within the media corresponding to depths of 70 µm and 120 µm respectively, roughly overlapping with the sub-regions identified in section 4.1.
Figure 6 OCT image of porcine arterial tissue indicating the position of the regions A, B and C that correspond to the first and second sub-layers of media and to the adventitia, respectively. The scanning was done along the direction of blood flow.
In region A the histogram is plotted for 900 A-scans (or in other words, for 900 calculated fractal dimensions each dimension corresponding to a portion from one A-scan). Furthermore the B region was divided into two “image blocks”, each block spread along a scanning distance of 60 µm thereby doubling in the number of calculated fractal dimensions. Using this procedure, one thousand eight hundred fractal dimensions were calculated and used as input for the histogram plot for region B. Region C is assigned to part of adventitia and it is about 240 µm deep. Therefore this region was split into four “image blocks” and a similar calculation to that performed for region A was done with an appropriate overlap between image blocks so the depth
or number of points for fractal dimension calculation was constant. For region C three thousand six hundred fractal dimensions were used for the histogram plot (corresponding to four “image blocks”). The histograms corresponding to each region are plotted in fig. 7. These histograms were based on the OCT images scanned in the direction of blood flow through the vessel. The probability density function for the statistics of fractal dimension seems to follow a Gaussian distribution for each region but with a different central position.
1.0 1.1 1.2 1.3 1.4 1.5 0 20 40 60 80 100 120 Region C Region B p robab il y di s tr ob ut io n o f f ra c ta l di m en s io n fractal dimension Region A
Figure 7 The histograms of fractal dimension for region A, B, and C as
indicated in fig.5: a) first layer of media; b) second layer of media; c) adventitia
To summarize the data, table 2 includes the central position of the fractal dimension in each region, which we call the average fractal dimension, the width of Gaussian distribution of the fractal dimension and the correlation coefficient of the fit to a Gaussian distribution for each ROI. The correlation coefficient is high, equal or over 0.93, showing high quality fit of the calculated fractal dimensions for each ROI to a Gaussian profile. It was observed that the central position of the Gaussian distribution moves to higher values of average fractal dimension when the ROI moves from media to adventitia while the width of Gaussian distribution reduces.
Table 2 Average fractal dimension, width of Gaussian distribution and the correlation coefficient for arterial tissues scanned along the blood flow.
Average fractal dimension Width of Gaussian distribution R2 Region A 1.194 0.0854 0.96 Region B 1.267 0.0662 0.93 Region C 1.277 0.0541 0.93
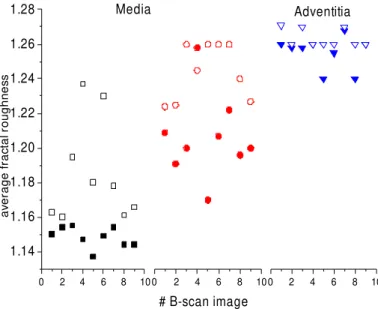
The fractal analysis was repeated for several OCT images of different arterial segments with the beam scanning occurring both parallel and perpendicular to the direction of blood flow in the vessel. The overall results were plotted in fig. 8. The first media sub-layer showing the circular smooth muscle structure has a lower average fractal dimension than the next sub-layer for images acquired in both scanning directions. The texture differences clearly visible between the two scanning directions may be correlated with a different average value of fractal dimension. The average fractal dimension of the first sub-layer is systematically larger and seems to wider spread for OCT images acquired parallel to the direction of blood flow. The calculated average fractal dimension associated with the second media sub-layer shows a smaller difference between the two scanning directions. The average fractal dimension of adventitia shows no difference between the images scanned parallel and the ones perpendicular to the blood flow direction and this constitutes another indication of an isotropic tissue.
0 2 4 6 8 10 1.14 1.16 1.18 1.20 1.22 1.24 1.26 1.28 0 2 4 6 8 100 2 4 6 8 10 Adventitia av er ag e f rac tal r ou ghn es s # B-scan image Media
Figure 8 Fractal roughness of media and adventitia for several OCT
images along (empty symbol) and transversal (full symbol) to the
blood flow
5. Conclusions
It seems likely that further developments of OCT image analysis will go beyond just acquiring high-quality images. Biological and morphological variations in arterial tissues generate changes in the optical properties of tissue, such as light scattering, absorption and refractive index, which in turn affect the OCT signal. The analysis tools presented in this report, the attenuation coefficient of the OCT signal and the average fractal dimension of specific ROIs obtained from B-scan images, could distinguish the subtle anatomical details of porcine left descending coronary artery. The attenuation coefficient of the OCT signal correlates with the gross anatomical features of the artery wall, such as the media and adventitia, but also can distinguish the sub-layers of the tunica media where the smooth elastin fibers have different orientations. In addition, an algorithm for the calculation of fractal dimensions in selected ROIs from within the OCT images was proposed. We have shown that fractal analysis also provides another parameter that can be used for soft-tissue differentiation. The average fractal dimensions are different for different sub-layers of the media and adventitia. Although more studies are needed, there is a strong indication that fractal analysis could be used to further refine the classification of various
regions within OCT images acquired from arterial tissues leading to improved soft-tissue contrast.
References
Atlamazoglou V, Yova D, Kavavtzas N and Loukas S 2001 Texture analysis of fluorescence microscopic images of colonic tissue sections, Med. Biol. Eng. Comput 39(2) 145-51
Bom N, Lancee C T and Van Egmond F C 1972 An ultrasonic intra-cardiac scanner. Ultrasonics 72-6
Brezinsky M E, Tearney G J, Bouma B E, Izatt J A, Hee M R, Swanson E A, Southern J F and Fujimoto J G 1996 Optical Coherence Tomography for optical biopsy – properties and
demonstration of vascular pathology Circulation 93 1206-13
Faber D J, van der Meer F J, Aalders M C and van Leeuwen T G 2004 Quantitative measurement of attenuation coefficients of weakly scattering media using optical coherence tomography
Optics Express 12 4353-65
Farooq M U, Khasnis A, Majid A and Kassab M Y 2009 The role of optical coherence tomography in vascular medicine Vascular Med. 14 63-71
Flueraru C, Nastase S and Iovan S 1997 Fractal study for describing surface morphology from atomic forge microscopy images, Semiconductor Conference CAS '97 Proceedings IEEE 2 557-600
Gossage K W, Tkaczyk T S, Rodriguez J J and Barton J K 2003 Texture analysis of optical coherence tomography images: feasibility for tissue classification J Biomed. Opt 8(3) 570-5 Honda X Y and Fitzgerald P J 2008 Frontiers in intravascular imaging technologies 2008
Circulation 117 2024-37
Izatt J A, Kulkarni M D, Wang H W, Kobayashi K and Sivak Jr. M V 1996 Optical Coherence tomography and microscopy in gastrointestinal tissues IEEE J. Select. Topics Quantum
Electron. 2 1017-28
Kawasaki M, Takatsu H, Noda T, Ito Y, Kunishima A, Arai M, Nishigaki K, Takemura G, Morita N, Minatoguchi S and Fujiwara H. 2001 Noninvasive quantitative tissue characterization and two-dimensional color-coded map of human atherosclerotic lesions using ultrasound
integrated backscatter: comparison between histology and integrated backscatter images J Am
Coll. Cardiol. 38 486–92
Kim J, Dave D, Rylander C, Oh J and Milner T, 2006 Spatial refractive index measurement of porcine artery using differential phase optical coherence microscopy, Laser in Surgery and
Medicine, 38, 955-9
Kotowski P 2006 Fractal dimension of metallic fracture surface Int. J. Fract. 141 269-86 Libby P 2006 Atherosclerosis: Disease Biology Affecting the Coronary Vasculature”, Am. J.
Mandelbrot B and van Ness J 1968 Fractional Brownian Motions, Fractional Noises and Applications SIAM review 10 422-37
Mao Y, Chang S, Sherif S and Flueraru C 2007 Graded-index fiber lens proposed for ultra-small probes used in biomedical imaging Applied Optics 46(24) 5887-94
Mao Y, Chang S, Sherif S and Flueraru C 2008 Design and implementation of fiber lenses for ultra-small probes used in biomedical imaging, Proceedings SPIE vol. 6826 68261A
Mehta S K, McCrary J R, Frutkin A D, Dolla W J and Marso S P 2007 Intravascular ultrasound radiofrequency analysis of coronary atherosclerosis: an emerging technology for the assessment of vulnerable plaque Eur Heart J. 28(11) 1283-8
Morgner U, Drexler W, Kartner F X. Li X D, Pitris C, Ippen E P and Fujimoto J G 2000 Spectroscopic optical coherence tomography Opt. Lett. 25 111-3
Murashige A, Hiro T, Fujii T, Imoto K, Murata T, Fukumoto Y and Matsuzaki M. 2005 Detection of lipid-laden atherosclerotic plaque by wavelet analysis of radiofrequency intravascular ultrasound signals: in vitro validation and preliminary in vivo application J Am Coll. Cardiol.
45 1954–60
Nair A, Kuban B D, Tuzcu E M, Schoenhagen P, Nissen S E and Vince D G 2002 Coronary plaque classification with intravascular ultrasound radiofrequency data analysis Circulation
106 2200–6
Nasu K, Tsuchikane E, Katoh O, Vince D G, Virmani R, Surmely J-F, Murata A, Takeda Y, Tatsuya I, Ehara M, Matsubara T, Terashima M and Suzuki T. 2006 Accuracy of In Vivo Coronary Plaque Morphology Assessment: A Validation Study of In Vivo Virtual Histology Compared With In Vitro Histopathology J Am Coll. Cardiol. 47(12):2405-12
Seidel C L 1997 Cellular Heterogeneity of the Vascular Tunica Media – Implication for Vessel Wall Repair Arteriosclerosis, Thrombosis, and Vascular Biology, 17 1868-71
Thrane L, Yura H T and Andersen P E 2000 Analysis of optical coherence tomography systems based on the extended Huygens Fresnel principle J. Opt. Soc. Am. A 17 484-90
Van der Meer F J, Faber D J, Perree J, Pasterkamp G, Baraznji Sassoon D and Van Leeuwen T G 2005 Quantitative optical coherence tomography of arterial wall components Lasers in Med
Science 20 45-51
Van der Meer F J, Faber D J, Baraznji Sassoon D, Aalders M C , Pasterkamp G and Van Leeuwen T J 2005 Localized measurement of optical attenuation coefficients of atherosclerotic plaque constituents by quantitative optical coherence tomography IEEE Trans on Med Imaging 24 1369-76
van Leeuwen T G, Faber D J and M.C. Aalders 2003 Measurement of the axial point spread function in scattering media using single-mode fiber-based optical coherence tomography
IEEE J. Select. Topics Quantum Electron. 9 227-33
echographic images Ultrasonic Imaging 15 304-23
Yogesan K, Jorgensen T, Albergtsen F, Tveter K J and Danielsen H E 1996 Entropy-based texture analysis of chromatin structure in advanced prostate cancer Cytometry,24(3) 268-76
Zysk A M, Nguyen F T, Oldenburg A L, Marks D L and Boppart S A 2007 Optical coherence tomography: a review of clinical development from bench to bedside J. Biomed. Opt. 12, 051403