HAL Id: hal-00964820
https://hal.archives-ouvertes.fr/hal-00964820
Submitted on 31 May 2020
HAL is a multi-disciplinary open access
archive for the deposit and dissemination of
sci-entific research documents, whether they are
pub-lished or not. The documents may come from
teaching and research institutions in France or
abroad, or from public or private research centers.
L’archive ouverte pluridisciplinaire HAL, est
destinée au dépôt et à la diffusion de documents
scientifiques de niveau recherche, publiés ou non,
émanant des établissements d’enseignement et de
recherche français ou étrangers, des laboratoires
publics ou privés.
Rémy Merret, Bruno Moulia, Irène Hummel, David Cohen, Erwin Dreyer,
Marie-Béatrice Bogeat-Triboulot
To cite this version:
Rémy Merret, Bruno Moulia, Irène Hummel, David Cohen, Erwin Dreyer, et al.. Monitoring the
regulation of gene expression in a growing organ using a fluid mechanics formalism. BMC Biology,
BioMed Central, 2010, 8 (Article 18), pp.1-13. �10.1186/1741-7007-8-18�. �hal-00964820�
M E T H O D O L O G Y A R T I C L E
Open Access
Monitoring the regulation of gene expression in a
growing organ using a fluid mechanics formalism
Rémy Merret
1†, Bruno Moulia
2†, Irène Hummel
1†, David Cohen
1, Erwin Dreyer
1, Marie-Béatrice Bogeat-Triboulot
1*Abstract
Background: Technological advances have enabled the accurate quantification of gene expression, even within single cell types. While transcriptome analyses are routinely performed, most experimental designs only provide snapshots of gene expression. Molecular mechanisms underlying cell fate or positional signalling have been revealed through these discontinuous datasets. However, in developing multicellular structures, temporal and spatial cues, known to directly influence transcriptional networks, get entangled as the cells are displaced and expand. Access to an unbiased view of the spatiotemporal regulation of gene expression occurring during development requires a specific framework that properly quantifies the rate of change of a property in a moving and expanding element, such as a cell or an organ segment.
Results: We show how the rate of change in gene expression can be quantified by combining kinematics and real-time polymerase chain reaction data in a mechanistic model which considers any organ as a continuum. This framework was applied in order to assess the developmental regulation of the two reference genes Actin11 and Elongation Factor 1-b in the apex of poplar root. The growth field was determined by time-lapse photography and transcript density was obtained at high spatial resolution. The net accumulation rates of the transcripts of the two genes were found to display highly contrasted developmental profiles. Actin11 showed pulses of up and down regulation in the accelerating and decelerating parts of the growth zone while the dynamic of EF1b were much slower. This framework provides key information about gene regulation in a developing organ, such as the location, the duration and the intensity of gene induction/repression.
Conclusions: We demonstrated that gene expression patterns can be monitored using the continuity equation without using mutants or reporter constructions. Given the rise of imaging technologies, this framework in our view opens a new way to dissect the molecular basis of growth regulation, even in non-model species or complex structures.
Background
Understanding time-course changes in gene expression and their complex interplay is a major challenge in gene regulation networks [1,2]. Attention has been shifted from mRNA steady-state levels towards rates of changes in transcript abundance and their regulation [3-5]. These dynamic of gene expression become even more complex when dealing with the developmental biology of multicellular bodies. Indeed, the fact that both tem-poral and positional cues are known to directly influ-ence transcriptional networks [6] creates the need for a
spatiotemporal specification of the changes in gene expression. Coordinated gene expression in tissue (or cells) at different stages of development has been revealed using technologies such as microarray analyses [7,8], mutant screening [9,10] and novel imaging techni-ques [11,12]. However, these approaches only provide snapshots of gene expression at given times or develop-mental stages. In these widespread cases, gene expres-sion is mapped in an Eulerian specification, using spatial coordinates at a given time. In developing multicellular structures, changes in gene expression occur alongside changes in organ size, shape and anatomy. Cell positions thus vary continuously due to cell movements, cell growth and cell death [13,14]. It is thus relevant to fol-low a cell during its movement over time in the growing
* Correspondence: triboulo@nancy.inra.fr † Contributed equally
1INRA, Nancy Université, UMR1137 Ecologie et Ecophysiologie Forestières, IFR
110 EFABA, F-54280 Champenoux, France Merret et al. BMC Biology 2010, 8:18
http://www.biomedcentral.com/1741-7007/8/18
© 2010 Merret et al; licensee BioMed Central Ltd. This is an Open Access article distributed under the terms of the Creative Commons Attribution License (http://creativecommons.org/licenses/by/2.0), which permits unrestricted use, distribution, and reproduction in any medium, provided the original work is properly cited.
tissue to assess gene expression along the developmental trajectory through a material or Lagrangian specifica-tion. Despite evidence of important gene regulations fol-lowing cell movements [15], there has so far been little research into quantitatively monitoring the rates of changes in expression levels over time and position dur-ing the developmental movements.
The question of how cell expansion and cell displace-ment both influence organ growth and gene expression can be addressed using mechanistic models that con-sider an organ as a continuum [13,15]. Quantifying rates of change in moving elements has been a longstanding issue in continuum mechanics. This approach requires a detailed characterization of the motion velocity field v(x, t) which can be monitored using video or time-lapse photography [15,16]. Based on the conservation of mass in a deforming continuum, the continuity equation properly quantifies the rate of change of a property in a moving element [17]. For instance, if the concentration of compound A varies across a growing tissue but not with time (that is, A(t) is steady but A(x) is not con-stant), then the local rate of change∂A/∂t at any posi-tion x is zero. However, there has necessarily been a change in the concentration of compound A in the moving element to match the change between A(x) and A(x+v.dt) (convective changes). By the same token, if the element volume has increased between t and t+dt, then a constant A over time means that net synthesis has occurred and compensated the dilution due to volu-metric growth. The continuity equation is able to take into account not only the local rate of change but also the consequences of movement and of possible changes in volume on the rate of change of the property [18].
The use of the continuity equation and the underlying kinematic analyses for growth studies was developed in the 1950’s [19-21]. It was then introduced to a wider audience [22,23] and reviewed in [18,24]. Plant tissues can easily be considered as a continuum: since plant cells are stuck together by their middle lamella, shear between cells is usually infinitesimal. Consequently, cell motion in a growing organ is due to the elongation of other cells pushing it [24]. To date, the continuity equa-tion has mainly been applied to gain insights into the physiology of both growth and development of elongat-ing organs. For example, the continuity equation frame-work has revealed overwhelming convective components of the rate of change of uronide deposition in growing roots [25]. It has also been used to assess the effects of stresses on growth [26,27].
Surprisingly, this framework has not yet been applied to gain a spatiotemporal description of the rates of change in gene expression and provide molecular devel-opmental information in growing tissue. In the present work, changes in the rate of gene expression in the apex
of poplar roots growing under optimal conditions were quantified at high spatial resolution with real-time poly-merase chain reaction (real-time PCR). We assessed the developmental regulation of two genes: Actin11 and Elongation Factor 1-b. These two genes are widely used as internal controls in real-time PCR [28]; yet both may be under transcriptional regulation in time and/or space in an actively growing organ. We show that the rate of change in gene expression can be quantified in time and space by combining kinematics and the continuity equa-tion with real-time PCR. The resulting fields of expres-sion rate revealed highly contrasted profiles for the control of Actin11 and Elongation Factor 1-b during the developmental movement. We highlighted the impor-tance of the convective component for monitoring changes in gene expression. These results underline that careful attention must be paid to growth and its possible alteration induced by changes in the environment before drawing any conclusions from raw transcript profiling in growing organs [29]. We demonstrate that the regula-tion of gene expression can be evidenced in growing tis-sues without using mutants or reporter constructions. Consequently, the proposed framework also constitutes in our view a useful bypass for in-depth analysis of the molecular basis of growth regulation in a wide range of non-model species.
Results
Trajectory, velocity and relative elemental growth rate along the growth zone
The growth-velocity profile (velocity of cell movement away from the root tip) was determined in 6 roots aged from 5 to 11 days (Figure 1A). As shown by the very low variability around the average profile, neither root age nor the time of the observation along the night (from 1 h to 6 h after light shutting, see Additional File 1: Figure S1A) induced significant changes in the growth profiles. A side experiment comparing root growth dur-ing the light phase and the night phase did not reveal any change due to direct light signaling or possible nycthemeral rhythm (see Additional File 1: Figure S1B). Growth was thus assumed to be steady for a few days in the following. The spatial derivative of velocity - that is, the relative elemental growth rate measuring relative elongation per unit time of elements along the axis, had a skewed bell-shaped distribution peaking at 4.5 mm from the root tip (Figure 1B). The first 2 mm, which include the root cap and the meristematic zone, dis-played low velocity. Velocity increased with distance from the root tip, reaching a plateau of 0.026 mm min-1 at approximately 9 mm, corresponding to the elongation rate of the whole root. Given the assumption of steady state, the growth trajectory - that is, the mapped posi-tion on the root of a meristem-derived tissue element as
a function of time was calculated from velocity data. It was found highly non-linear (Figure 1C). A tissue ele-ment crossed the growth zone in about 2800 min (about 2 days), but spent more than 2300 min (over 38 h) in the 1-3 mm section - over 80% of total growth duration.
Transcript density along the growth zone
As the growth zone shows highly heterogeneous local velocity and relative elemental growth rate (Figure 1A and 1B), the spatial distribution of molecular entities was analysed at high spatial resolution. The transcript
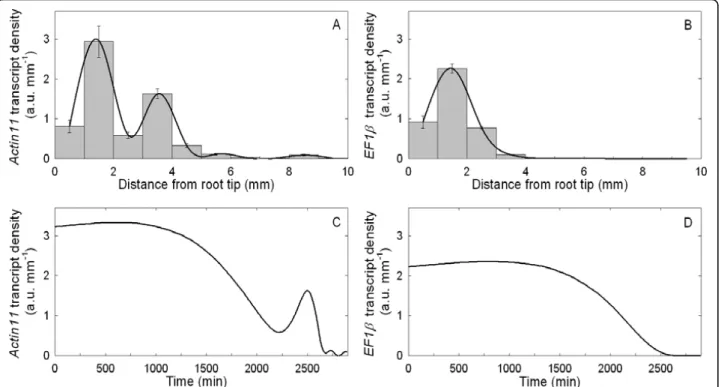
densities of Actin11 and a putative Elongation Factor 1-b (EF1b) were plotted against the current segment position on the root axis (Eulerian specification, Figure 2A and 2B). The Actin11 density profile displayed two peaks at 1.5 and 3.5 mm from the root tip with similar spans, but decreasing intensity, and low values in more distal segments. The EF1b density profile differed from that of Actin11, displaying a single peak at 1.5 mm and very low levels in all the more distal segments.
No time trend of the RNA profiles can be suspected (see Additional File 2: Figure S2A), suggesting a
Figure 1 Velocity, relative elemental growth rate and growth trajectory along the root apex. (A) Displacement velocity profile along the root apex (reference point is the root tip). Mean ± standard error of mean (SEM; n = 6). (B) Relative elemental growth rate (spatial derivative of displacement velocity) along the root apex. Mean ± SEM (n = 6). C: Growth trajectory of a meristem-derived element initially located at 1 mm from the root tip - the time at which it reached a given distance from the tip along its developmental movement away from the meristem. Growth trajectory was calculated from mean velocity data. It was drawn only from 1 mm onwards, since velocity was almost nil in the apical first mm, making the calculated displacement time uncertain.
Merret et al. BMC Biology 2010, 8:18
http://www.biomedcentral.com/1741-7007/8/18
temporal stability of the RNA profiles whatever the age of the root, or the time of the observation during the night phase. Consistently with the steadiness of growth, the profiles of transcript density were thus assumed to be steady for a few days in the following (see also Addi-tional File 2: Figure S2B for addiAddi-tional indirect argu-ments). Assuming steady growth and steady transcript density, the developmental time-course of the transcript density in a tissue element initially positioned at 1 mm from the root tip (Lagrangian specification, Figure 2C and 2D for Actin11 and EF1b, respectively) was calcu-lated by combining transcript density (Figure 2A and 2B) with growth trajectory (Figure 1C). Due to non-lin-ear changes in local velocity, the actual time-course of transcript density in a given tissue element was quite different from what could be expected intuitively from Figures 2A and 2B. For Actin11 (Figure 2C), the first peak lasted almost five times longer than the second peak, indicating that the first changes in Actin11 were smooth and long-lasting, whereas the second peak was a transient shift (8 h). However, even these transcript den-sity profiles (Figure 2) cannot be analysed for regulation of gene expression simply by considering position-to-position variations, since as time goes on, each element not only moves but also expands (Figure 1B). While the Lagrangian specification of transcript density considers
the movement of the tissue element, only the continuity equation gives an unbiased view of gene expression dur-ing growth, takdur-ing into account both cell movement and cell volume expansion.
Regulation of gene expression
The material derivative of transcript density D (expressed in arbitrary unit mm-1min-1) was calculated from the continuity equation. D corresponds to the net accumulation rate of transcripts in each element along the root. In other words, D reveals the regulation of gene expression resulting from the balance of transcrip-tion and decay along the root, corrected for the posi-tional and dilutive effects of growth (if D = 0, then transcript level remains constant). From equation (3), it is possible to plot the two components of D, namely the convective and the dilutive components. Under the assumption of steady transcript density, the local rate of change in gene expressionδr/δt is null. The convective rate of change, v.δr/δx, corresponds to the variation in transcript density in an element moving to a region further away from the root tip (Figure 3A and 3B). The dilutive component,r.δv/δx (Figure 3C and 3D) assesses potential compensation of the dilution of transcript abundance during expansive growth through net transcript synthesis (that is, if r.δv/δx = 0, then net
Figure 2 Spatial and temporal specifications ofActin11 and EF1b transcript density. Actin11 (A) and EF1b (B) transcript density (a.u. mm-1) in 1 mm-long segments of the primary root. Mean ± standard error of mean (SEM; n = 3). The black line corresponds to the cubic spline interpolation of the means. Actin11 (C) and EF1b (D) transcript density as a function of time in an element moving across the growth zone. Mean ± SEM (n = 3).
transcript synthesis just compensates for the expansion-driven dilution).
Figures 3E and 3F illustrate these net accumulation rates along the root growth zone (Eulerian specification) for the Actin11 and EF1b transcripts, respectively. For both genes, the profile of the net accumulation rate of transcripts in tissue elements D was highly dynamic in the zone of increasing relative elemental growth rate (Figure 1B). In the distal part of the growth zone (5-9 mm), D was generally not significantly different from zero, indicating that the transcript level remained almost constant for both genes. There was an active accumula-tion of Actin11 transcripts peaking at 3.25 mm in cells undergoing growth acceleration, followed by a negative peak of almost the same amplitude at 4.25 mm (Figure 3E) in cells just starting to decelerate their growth (Fig-ure 1B). Significant peaks of smaller amplitude were observed, showing that Actin11 transcripts accumulate in cells at 1.5 mm from the root tip (probably sitting in
the division zone) and in cells that were poised to enter post-growth cell differentiation at 8.5 mm. In compari-son, the EF1b expression is up-regulated closer to the root tip, at 1.5 mm (Figure 3F). As for Actin11, this accumulation phase was followed by a phase during which the decay rate overcame the transcription rate. For Actin11, the absolute value of D was clearly mainly attributable to the convective component whereas for EF1b the relative contribution of the convective and dilutive components was balanced (Figure 3), meaning that synthesis rates were unequal for both transcripts. Note also that net transcript synthesis overreached dilu-tion in the first 5 mm - the zone of increasing relative elemental growth rate (Figure 3C and 3D). Beyond 5 mm, the dilutive effect was just compensated.
Since the density of nuclei and presumably the cellular activity are heterogeneous along the root growth zone [29,30], the net accumulation rate of total RNA was used as a control. The total RNA content varied
Figure 3 Material derivative ofActin11 and EF1b transcript densities. Convective (A, B) and dilutive (C, D) components of the material derivative (E, F) - the net accumulation rate of Actin11 and EF1b transcripts, respectively - as a function of the distance from the root tip (Eulerian specification). The material derivative and its components are expressed in arbitrary unit mm-1min-1. The black lines were calculated
from the mean values of each parameter using equation (3). Box-and-whisker plots are the distribution of 1000 replicates (obtained by random resampling). The central mark is the median, the edges are the 25th and 75th percentiles, and the whiskers extend to 10th and the 90th percentiles.
Merret et al. BMC Biology 2010, 8:18
http://www.biomedcentral.com/1741-7007/8/18
significantly along the growth zone, with a lognormal distribution and a peak at 1.5 mm from the tip (Figure 4A). The net accumulation rate of total RNA, calculated using the same formalism as above, was positive in the 1-3 mm range and showed a flat and near null profile thereafter (Figure 4B). The simulated distribution of D, shown by box-and-whiskers plots, included zero, mean-ing that the mean value of D can be null by chance. In other words, the net accumulation rate of total RNA can not be considered as strictly different from zero beyond the 3 mm mark (Figure 4B). This location of total RNA accumulation adds to the evidence for a high cellular activity of a meristematic zone.
Given the calculation of temporal variations using the growth trajectory (as in Figure 2C and 2D), net accumu-lation rates were plotted in space and time (Figure 5, Additional Files 3, 4, 5: Movie1, Movie2 and Movie3). In other words, variations of net accumulation rate were tracked in a tissue element which was originally located at 1 mm from the root tip and moved through the growth zone away from the meristem. This spatiotem-poral mapping enables to equally perceive kinetic and positional cues. The Lagrangian specification is shown here for a single element, but as long as growth and development are steady, all the elements display the
same developmental fate [18]. Figure 5 highlights that the variations in net accumulation rate of Actin11 and EF1b transcripts differed markedly from the dynamics of total RNA, thus strengthening the conclusion of a tight regulation of gene expression in any cell crossing the growth zone. Given that total RNA accumulation rate did not significantly differ from zero beyond the 3 mm mark (or 3400 min, Figure 4B), its dynamics appear more stable than the sharper dynamics of Actin11. Both transcripts appeared to be under distinct control. The dynamics of EF1b were much slower than the dynamics of Actin11, which varied very rapidly in the ageing cell. However, both were maintained at an almost constant rate of net accumulation for approximately 1500 min-utes (25 hours) at the very tip of the root. These results offer novel insights into the developmental analysis of gene regulation in growing plant organs.
Discussion
Specification of space, time and age in the study of dynamic processes
The present work focuses on the combination of two dynamic processes: expansive growth and gene expres-sion. The analysis of both processes is influenced by the way space, time and age are considered. This stands as a
Figure 4 Total RNA density and its material derivative. (A) Total RNA density (ng mm-1) in 1 mm-long segments of the primary root. Mean ±
standard error of mean (n = 3). The black line corresponds to the cubic spline interpolation of the means. (B) Material derivative - the net accumulation rate, of total RNA (ng mm-1min-1). The black line was calculated from the mean values of each parameter using equation (3). Box-and-whisker plots are the distribution of 1000 replicates (obtained by random resampling). The central mark is the median, the edges are the 25th and 75th percentiles, and the whiskers extend to 10th and the 90th percentiles.
Figure 5 Spatio-temporal mapping of gene regulation. Lagrangian representation of Actin11 (A), EF1b (B) transcript accumulation rate (a.u. mm-1min-1) and total RNA accumulation rate (C) (ng mm-1min-1) along the primary root apex and with time. Net accumulations rates (Z axis) are plotted along the growth trajectory of an element (curve in the XY, see Figure 1C). Computed on Matlab software.
Merret et al. BMC Biology 2010, 8:18
http://www.biomedcentral.com/1741-7007/8/18
pivotal point, since it shapes every experimental design and, therefore, drives conclusions. Dynamic analyses necessarily involve considering the rates of change in a biological structure (a cell, a piece of tissue or a segment of an organ). Whereas growth studies usually consider the rates of change (relative elemental growth rate), many investigations into the control of gene expression are based on the quantification of mRNA transcript levels, which are shaped by a dynamic interplay between the rates of synthesis and decay [3,5]. In mature tissues, where cells no longer move nor enlarge irreversibly, the transcriptional regulation of gene expression (for exam-ple environmental induction) is revealed by the temporal derivative of local transcript density. However, a further step is needed in order to capture gene regulation in growing structures by considering movement and expansion, which are taken into account by the input of the partial derivatives and the growth velocity field into the continuity equation [18]. The present work is, to our knowledge, the first study to apply this framework to transcript density, providing an unbiased view of the spatiotemporal regulation of gene expression (Figure 4E and 4F). In a steady growing structure, constant patterns of activity are displayed while material flows through it [31,32]. The developmental changes in net rates of gene expression were revealed by the convective and dilutive partial derivatives, two terms that are usually not con-sidered in typical molecular studies of development.
We studied growth kinematics and gene expression under steady conditions of growth (window of stable growth rate, dark phase and constant temperature). In these conditions both the growth velocity and transcript density of housekeeping genes were assumed to be time invariant. When transcript density and/or velocity vary (ies) over time and are properly quantified at each time step, equation (1) has to be used [instead of simplified equation (3)]. Quantification of material derivative through equation (1) requires a larger experimental effort but is still straightforward (see for example [33]). Vital imaging of growth and gene expression, as well as high throughput quantitative analyses of gene transcript abundance, will greatly support such measurements in the near future, enlarging the potential uses of the method presented here.
In the present work, mean trends were established from the mean value of three independent measurements of r (transcript density or total RNA density) at every position. RNA extraction from very small samples is destructive and missing values prevented analysis at the individual root level. However, the advent of imaging techniques which provide accurate positioning and quan-titative measurement of transcript level [11,12] will enable more detailed analyses of individual organs using the continuity equation. This could be a major breakthrough,
as the analysis of single roots have revealed a steep rela-tive elemental growth rate gradient between the meristem and the elongation zone, which is usually smoothed when pooling data from several roots [34]. Taking such gradi-ents into account should reveal even more dynamic pat-terns of gene expression rates due to convective and dilutive terms. By the same token, our framework could be used to conduct a more detailed analysis at the level of small cell territories in order to characterize the contri-butions of different cell types along the root growth zone [8], but would require more advanced three dimensional kinematic and a more complex formalism. For simplifica-tion, the growth field of the root apex was considered here as a one dimensional vector field (the main axis) due to the slenderness of the root and the anisotropy of its growth and to the lack of shear growth (this is similar to the rod approximation in the beam theory of solid mechanics [24]). However, two or even three dimensions can be taken into account by using equations developed for appropriate coordinate systems (cylindrical, rectangu-lar, spherical), as given by Silk [18]. More complex struc-tures with a lower level of symmetry (for example, branching roots or apical meristem of shoots) can also be considered, using natural curvilinear coordinate system and proper tensorial formalism [35]. The transcript den-sity would have to be characterized with the necessarily accuracy in the three dimensions. While feasible, it would require a large experimental effort.
Once the rates of change have been properly com-puted, the next significant challenge to reveal regulation processes is the spatial and temporal specifications of these rates. In most studies of growing organs [7,36], the property of interest is described at a given develop-mental stage (time) as a function of the position in the growth zone (Eulerian specification, as in Figure 2A and 2B for transcript density). This can reveal spatial mechanisms such as those related to highly diffusible or transported chemicals (for example, auxin in roots [37]). An even more insightful way to describe this dynamic process is to choose an element and track its properties as it is displaced in space and time and undergoes devel-opmental changes (Lagrangian specification, Figure 5). These three dimensional plots are necessary in order to handle the fact that, in a growing organ, time and space are intimately but non-linearly linked. In the present study, Eulerian and Lagrangian specifications of dynamic processes highlight different aspects of developmental regulation. The Lagrangian time*space specification revealed a long-term steady accumulation of transcripts of the studied genes (EF1b and Actin11), as well as total RNA in the first 2 mm of the root tip (presumably the meristem) followed by highly dynamic regulation as the cells move away and undergo the accelerating and decel-erating phases of expansion growth.
Towards a dynamic analysis of transcriptional regulation during development
A deeper understanding of the mechanisms underlying organ growth and development requires quantitative data on three dimensional morphology and gene expres-sion at a variety of stages and scales [13]. Recent tech-nological advances have made it possible to analyse gene expression in individual cell types, tissues or organs through the use of specific mutants [7,8,38]. Fluorescent proteins can thus be coupled with high-resolution ima-ging in order to display the expression patterns of a gene at whole-organ level. For example, the expression of the vein marker gene ATHB8 can be used to track the earliest stage of vein development in leaves of Arabi-dopsisseedlings [39]. This approach has also been used to study tissue organization and gene expression during phloem development [40]. However, even if the analysis of consecutive snapshots reveals changes in gene expres-sion, their spatiotemporal dynamics need to be clarified in order to avoid misinterpretation of the observed variations.
Understanding how signals through gene expression generate patterns and govern ontogenic timing is a cru-cial challenge in developmental biology. Coupling quan-titative data with mathematical models provides some answers [41]. In the present study, real-time PCR asso-ciated with kinematic analysis of growth at high spatial resolution gave access to the dynamics of gene regula-tion (Figure 5A and 5B). The demonstraregula-tion was con-ducted on two widely-studied genes considered to be housekeepers. We chose the gene coding for ACTIN11 as this protein is one of the main components of cell architecture. Actin microfilaments are involved in many processes such as cell polarity, division and elongation [42]. The use of an inhibitor of actin polymerization (latrunculin B), at a concentration sufficient to remove a considerable amount of actin, reduced the root growth rate by about 50% [43]. Using Arabidopsis mutants, Ringli et al. [44] demonstrated that the Actin2 gene is involved in root hair growth and Bannigan and Baskin [45] pointed out that Actin microfilaments are crucial for the tuning of cell expansion throughout the organ. In line with these findings, the expression of poplar Actin11appears to be tightly controlled along the root growth zone (Figure 5A). Three pulses of up-regulation were observed, corresponding to: (i) the division zone; (ii) the accelerating part of the elongation zone; and (iii) to just before the entry into the maturation zone. The putative Elongation factor 1-b(EF1b) encodes a subunit of the EF-1 complex, an essential enzyme for protein synthesis in eukaryotes [46]. EF1a, another part of the same functional EF-1 complex, is accumulated in regions of high protein synthesis [47]. EF1a is used as a marker for meristematic activity in maize [48]. Poplar
EFIb was found to be up-regulated in the first two mm of the growth zone (Figure 5B). The high regulation of Actin11and EF1b expression and their patterning along root growth zone pointed out that these genes did not display the expression stability required for their use as endogenous controls in real-time PCR.
Conclusions
In contrast with the transcript density profiles widely used in the literature [7,8,36], the material derivative of transcript density provides key information about gene expression patterns, such as the location and the inten-sity of gene induction/repression. This framework appears to be very useful, offering rapid tracking of gene regulation, even in non-model species and species that are not-easily transformable. Moreover, contrary to green fluorescent protein/b-glucuronidase tracking, the framework makes it possible to analyze many genes in the same biological sample (the number is only limited by the available amount of RNA). In addition, this approach can be used: (i) to test hypotheses on when and where a transduction signal is perceived, which is a key step in rebuilding the between-gene interplays underlying growth; (ii) to unravel the temporal and spa-tial aspects of gene regulation between treatments affecting the time-course of cells across the growth zone, even under non-steady state situations; and, ulti-mately, (iii) to assess putative reference genes in the very dynamic context of growing and developing tissues. Although illustrated here for plant roots, the method is fairly generic and can be applied to most developing plant or animal organs or tissues, as long as they can be considered as a continuum [13,14].
Methods
Cultivation condition
Poplar cuttings (Populus deltoïdes × nigra cv‘Soligo’) were grown in hydroponics in a controlled-environment growth cabinet (air temperature: 21°C, relative humidity: 70%, 16 h light regime, photosynthetic photon flux density: 200 μmol s-1
m-2). The Hoagland 1/2 nutrient solution was supplemented with 0.8 mM KH2PO4and pH was adjusted to 5.8. It was aerated by air bubbling and renewed once a week. This production of plant material was done in opa-que plastic pots to avoid root exposure to light.
Root growth
The growth rate of a root depends on its total length or its age (the time in days between its emergence and its sampling). Root growth is slow when emerging, constant for several days and then decreases (due to the competi-tion of the lateral roots). Roots were sampled in the pla-teau phase and were 5-11 days old. Six roots were used to assess the velocity profile. Cuttings were sampled
Merret et al. BMC Biology 2010, 8:18
http://www.biomedcentral.com/1741-7007/8/18
during the dark period and transferred for measuring velocity to a dark room where temperature was kept con-stant. Root growth measurements were conducted in continuous dark in order to avoid possible actinic light artefact. As poplar roots are plagiotropic, growth was assessed in a horizontal 700 mL tray filled with the same aerated nutrient solution. First, the root apex was care-fully marked with graphite powder under‘safe’ green light. The cutting was then fixed vertically, the base plun-ging in the tray so that the marked root was submerged. Time lapse photography was performed using a Canon Powershot S80 camera placed on a Leica MZ6 modular stereomicroscope, which was set vertically above the tray. A ruler was set close to the root for calibration. After a 1 h rest, a series of pictures was taken at 10 min intervals under a‘safe’ green light (switched on for 1 min every 10 min). The MATLAB-based software Kineroot [49] was used to track the displacement of graphite particles over space and time and determine the velocity (the local rate of longitudinal displacement due to growth of cells along the growth zone) at a resolution of 0.25 mm.
Transcript density
The root apices were harvested after velocity measure-ment. The apical centimetre, including the root cap, was cut into 1 mm-long segments under a stereomicroscope in RNA later (Ambion, Texas, USA) following the man-ufacturer’s protocol. Total RNA was extracted using an RNeasy Micro Kit (Qiagen, CA, USA) with an additional DNAse I treatment, following the manufacturer’s proto-col. Total RNA concentration was determined in dupli-cate using a Quant-iT Ribogreen RNA Kit (Molecular Probes, Oregon, USA) and NanoDrop 1000 spectrophot-ometer (Thermo Scientific, Colorado, USA) following the manufacturer’s protocols. RNA quality was assessed using an Experion RNA HighSens Analysis kit (Bio-Rad, CA, USA). Since total RNA content varied up to 14-fold between root segments, reverse transcription was per-formed on a standardized 100 ng RNA using an iScript cDNA Synthesis Kit (Bio-Rad). An Alien QRT-PCR Inhibitor Alert kit (Stratagene, CA, USA) was used to assess reverse transcription efficiency, following the manufacturer’s protocol. Real-time PCR was performed in a 96-well thermocycler (MJ research PTC 2000) with a chromo4 detection system (Bio-Rad) according to the recommended cycling program (5 min 95°C, 40 cycles of 15 s at 95°C, and 1 min at 60°C) followed by the gen-eration of a dissociation curve to check for specificity of amplification. The mix contained MESA GREEN qPCR MasterMix (Eurogentec, Liège, Beligum), 500 nM gene-specific primers and 2.5 μL cDNA (diluted 1/5) in each 15 μL reaction. Actin11 (CA824001 similar to At3g12110) and a putative Elongation Factor 1-b (BI125345 similar to At2g18110) were amplified using
previously published primers [28]. Primer efficiencies were close to 100% and calculated using Opticon Moni-tor v3.1 software (Bio-Rad) on standard curves gener-ated using a fourfold dilution series of all cDNA, over at least five dilution points measured in duplicate. By set-ting the most diluted point of the standard curve to one copy, threshold cycle values were linearly transformed into arbitrary units. Transcript abundances (a.u.) were assessed on two technical replicates. Given that all real-time procedures were conducted on standardized 100 ng RNA, transcript linear density (a.u. mm-1) was calcu-lated as the transcript abundance with respect to total RNA content in each segment. For simplification, the root was considered as a homogeneous cylinder.
Numerical methods
The system of differential equations applied here is reviewed in Silk and Erickson [22] and Silk [18]. The material derivative D (the rate of change of any property r in a tissue element of a growing organ) can be com-puted from the continuity equation:
D t v x v x x,t x,t x,t x,t (1)
Here r is the transcript density (a.u. mm-1) or total RNA density (ng mm-1), v the velocity of the tissue ele-ment (mm min-1), x the distance from a reference point (here the root tip), and t the time (min), δr/δt is the local partial time-derivative at position x,δr/δx is the spatial gradient inr, and δv/δx is the growth velocity gradient, which measures local growth activity and has previously been termed ‘relative elemental growth rate’ [18] or ‘growth induced strain rate’ ( , [24]). D is the material derivative (taking into account the movement and expansion in length of each tissue element) with (v δr/δx) the convective component and (r δv/δx) the dilu-tive component. Contrary to most studies on the dynamics of fluids with low compressibility, this dilutive component cannot be neglected in growing tissues [32].
At any given time (t):
D t v x v x x x x x (2)
As a reasonable first approximation (see Additional File 2: Figure S2),r is assumed to be steady (time invar-iant) and the equation is simplified:
D v x v x (x) (x) (x) (3)
Using equation (3), we computed the material deriva-tive D of (i) the transcript density of Actin11 and EF1b
and (ii) total RNA density. Note that if the investigated property exhibits temporal variations (waves, circa-dian,...), the sampling method should be adequately adapted to accurately assessδr/δt, the local partial time-derivative over time and space [equation (2)].
As the transcript densityr was determined every mm, data were interpolated using cubic spline interpolation and setting the end second derivatives to zero (MATLAB, The MathWorks, MA, USA). The spatial derivatives of velocity (δv/δx) and transcript density (δr/ δx) were calculated using the five-point quadratic differ-entiation formula [50] to filter high frequency noise. Applying this formula with a 0.25 mm resolution restricted the calculation of D to the 1-9 mm range but avoided potential boundary effects.
RNA extraction from very small samples and real-time PCR are subject to experimental hazards, leading to missing values. While growth was measured on six inde-pendent roots, transcript densities r for every position on the root axis were measured in three out of the six roots. In addition to the calculation of mean D profiles (from the mean profiles of r and v), dispersion around mean D values was estimated on 1000 bootstrap repli-cates. The 1000 computed profiles were randomly gen-erated by sampling with replacement of the original dataset, which consisted of three (r, v) pairs for every position on the root axis. Unless specified, graphs were computed using Sigmaplot software.
Under the assumption of steady state of growth (see Additional File 1: Figure S1), the growth trajectory (ele-ment position as function of time) was computed by temporally integrating the (steady) velocity. The succes-sive positions of a particle were iteratively tracked according to x(t+dt)= x(t)+ v(x)dt. The initial position of the particle was set at 1 mm of the root tip in order to avoid discrepancies due to the very low velocity in the first millimetre. Under the assumption that both growth trajectory andr profile were constant, they were com-piled to draw a Lagrangian specification of gene expres-sion and gene regulation. Note that Lagrangian specifications can be drawn for unsteady parameters provided that the temporal variations are taken into account.
Additional file 1: Figure S1. Data supporting the time stability of growth. (A) Velocity profiles determined by time lapse photography and Kineroot [49]. Time corresponds to the time between beginning of the dark and the sampling time. The mean velocity shown in Figure 1A is the mean ± standard error of mean of these six profiles. (B) Biplot between velocity measured during the light phase and velocity measured after 72 h continuous dark (n = 3, mean ± standard deviation). The relation is not statistically different from the identity function - that is, intercept = 0, slope = 1.
Click here for file
[ http://www.biomedcentral.com/content/supplementary/1741-7007-8-18-S1.PPT ]
Additional file 2: Figure S2. Data supporting the time stability of RNA profiles. (A) Profiles of Actin11 transcript density. Blue and red symbols correspond to the data shown in Figure 2A. Data were split into two groups according to their sampling time. The black lines correspond to complementary data - three independent roots collected after more than 72 hours of continuous dark. (B) Additional arguments for the steadiness of expression profile. The assumption of a steady profile for Actin11 is supported by the mining and viewing of diurnal and circadian microarray data from Arabidopsis and poplar http://diurnal.cgrb. oregonstate.edu. Figure S2B shows the diurnal patterns of Actin expression in leaves, which are the most exposed to light and presumably the most light-sensitive organ. The Arabidopsis ortholog (At3g12110) (dashed lines) exhibited a diurnal regulation of its expression with no circadian persistency. On the contrary, poplar Actin11
(continuous lines) showed a very constant expression over the diurnal cycle and no circadian rhythm. The absence of circadian control in poplar leaf supports the hypothesis of constancy of Actin11 expression in roots. Blue and red = 12 h light/12 h dark; black = continuous light; dashed black = continuous dark. Temperature was constant (22°C). Click here for file
[ http://www.biomedcentral.com/content/supplementary/1741-7007-8-18-S2.PPT ]
Additional file 3: Movie1. Rotating spatio-temporal mapping - Actin11. Visualization of the three dimensional Figure 5A rotating from the temporal axis to the spatial axis.
Click here for file
[ http://www.biomedcentral.com/content/supplementary/1741-7007-8-18-S3.MPEG ]
Additional file 4: Movie2. rotating spatio-temporal mapping - EF1b. Visualization of the three dimensional Figure 5B rotating from the temporal axis to the spatial axis.
Click here for file
[ http://www.biomedcentral.com/content/supplementary/1741-7007-8-18-S4.MPEG ]
Additional file 5: Movie3. Rotating spatio-temporal mapping - total RNA. Visualization of the three dimensional Figure 5C rotating from the temporal axis to the spatial axis.
Click here for file
[ http://www.biomedcentral.com/content/supplementary/1741-7007-8-18-S5.MPEG ]
Abbreviations
EF: elongation factor; real-time PCR: real-time polymerase chain reaction. Acknowledgements
RM was financially supported by an INRA and Région Lorraine PhD grant (No. 12000086). This research was supported in part by a Région Lorraine grant (No. 12000158) and by the Agence Nationale de la Recherche under the grant reference ANR-09-BLAN-0245-01 (project Senzo). The authors thank Dr F Halkett and Dr P Montpied for their help with the statistical analyses; UMR1136 (INRA-UHP, Nancy) for hosting the molecular experiments; and Dr N Leblanc-Fournier and four anonymous reviewers for their useful comments on the manuscript.
Author details
1
INRA, Nancy Université, UMR1137 Ecologie et Ecophysiologie Forestières, IFR 110 EFABA, F-54280 Champenoux, France.2INRA, Université Blaise Pascal,
UMR_A547 Physique et Physiologie Intégratives de l’Arbre Fruitier et Forestier, Domaine de Crouelle, F-63039 Clermont Ferrand, France. Authors’ contributions
RM participated in the design of the study, carried out the kinematics and molecular studies and drafted the manuscript. BM had the original idea of applying the continuity equation to the analysis of gene expression dynamics, conceived the study, participated in its design and drafted the manuscript. IH participated in the design and coordination of the study, performed the statistical analysis and drafted the manuscript. DC helped in Merret et al. BMC Biology 2010, 8:18
http://www.biomedcentral.com/1741-7007/8/18
the molecular studies and to draft the manuscript. ED helped to draft the manuscript. MBBT conceived the study, participated in its design and coordination and drafted the manuscript. All authors read and approved the final manuscript.
Received: 10 September 2009 Accepted: 4 March 2010 Published: 4 March 2010
References
1. Sun N, Carroll RJ, Zhao HY: Bayesian error analysis model for
reconstructing transcriptional regulatory networks. Proc Natl Acad Sci USA 2006, 103:7988-7993.
2. Zhou Q, Chipperfield H, Melton DA, Wong WH: A gene regulatory network in mouse embryonic stem cells. Proc Natl Acad Sci USA 2007,
104:16438-16443.
3. von Dassow G, Meir E, Munro EM, Odell GM: The segment polarity network is a robust development module. Nature 2000, 406:188-192. 4. Bolouri H, Davidson EH: Transcriptional regulatory cascades in
development: Initial rates, not steady state, determine network kinetics. Proc Natl Acad Sci USA 2003, 100:9371-9376.
5. Narsai R, Howell KA, Millar AH, O’Toole N, Small I, Whelan J: Genome-wide analysis of mRNA decay rates and their determinants in Arabidopsis thaliana. Plant Cell 2007, 19:3418-3436.
6. Levine M, Davidson EH: Gene regulatory networks for development. Proc Natl Acad Sci USA 2005, 102:4936-4942.
7. Birnbaum K, Shasha DE, Wang JY, Jung JW, Lambert GM, Galbraith DW, Benfey PN: A gene expression map of the Arabidopsis root. Science 2003, 302:1956-1960.
8. Brady SM, Orlando DA, Lee J-Y, Wang JY, Koch J, Dinneny JR, Mace D, Ohler U, Benfey PN: A high-resolution root spatiotemporal map reveals dominant expression patterns. Science 2007, 318:801-806.
9. Alonso JM, Ecker JR: Moving forward in reverse: genetic technologies to enable genome-wide phenomic screens in Arabidopsis. Nat Rev Genet 2006, 7:524-536.
10. Song YJ, He F, Xie GQ, Guo XY, Xu YJ, Chen Y, Liang XH, Stagljar I, Egli D, Ma J, Jiao R: CAF-1 is essential for Drosophila development and involved in the maintenance of epigenetic memory. Dev Biol 2007, 311:213-222. 11. Galbraith DW, Birnbaum K: Global studies of cell type-specific gene
expression in plants. Annu Rev Plant Biol 2006, 57:451-475.
12. Sharpe J, Ahlgren U, Perry P, Hill B, Ross A, Hecksher-Sorensen J, Baldock R, Davidson D: Optical projection tomography as a tool for 3D microscopy and gene expression studies. Science 2002, 296:541-545.
13. Coen E, Rolland-Lagan AG, Matthews M, Bangham JA, Prusinkiewicz P: The genetics of geometry. Proc Natl Acad Sci USA 2004, 101:4728-4735. 14. Green PB: Expression of pattern in plants: combining molecular and
calculus-based biophysical paradigms. Am J Bot 1999, 86:1059-1076. 15. Supatto W, Debarre D, Moulia B, Brouzes E, Martin JL, Farge E,
Beaurepaire E: In vivo modulation of morphogenetic movements in Drosophila embryos with femtosecond laser pulses. Proc Natl Acad Sci USA 2005, 102:1047-1052.
16. Biskup B, Scharr H, Fischbach A, Wiese-Klinkenberg A, Schurr U, Walter A: Diel growth cycle of isolated leaf discs analyzed with a novel, high-throughput three-dimensional imaging method is identical to that of intact leaves. Plant Physiol 2009, 149:1452-1461.
17. Lautrup B: Physics of Continuous Matter: Exotic and Everyday Phenomena in the Macroscopic World. Copenhagen: The Niels Bohr Institute 2004.
18. Silk WK: Quantitative descriptions of development. Ann Rev Plant Physio 1984, 35:479-518.
19. Erickson RO, Sax KB: Rates of cell division and cell elongation in the growth of the primary root of Zea mays. Proc Am Phil Soc 1956, 100:499-514.
20. Goodwin RH, Avers CJ: Studies on roots. III. An analysis of root growth in Phleum pratense using photomicrographic records. Am J Bot 1956, 43:479-487.
21. Hejnowicz Z: Growth and differentiation in the root of Phleum pratense. II. Distribution of cell division in the root. Acta Soc Bot Pol 1956, 25:615-628.
22. Silk WK, Erickson RO: Kinematics of plant growth. J Theor biol 1979, 76:481-501.
23. Erickson RO, Silk WK: The kinematics of plant growth. Sci Am 1980, 242:134-151.
24. Moulia B, Fournier M: The power and control of gravitropic movements in plants: a biomechanical and systems biology view. J Exp Bot 2009, 60:461-486.
25. Silk WK, Walker RC, Labavitch J: Uronide deposition rates in the primary root of Zea mays. Plant Physiol 1984, 74:721-726.
26. Sharp RE, Hsiao TC, Silk WK: Growth of the maize primary root at low water potentials. II. Role of growth and deposition of hexose and potassium in osmotic adjustment. Plant Physiol 1990, 93:1337-1346. 27. Girousse C, Moulia B, Silk W, Bonnemain JL: Aphid infestation causes
different changes in carbon and nitrogen allocation in alfalfa stems as well as different inhibitions of longitudinal and radial expansion. Plant Physiol 2005, 137:1474-1484.
28. Brunner AM, Yakovlev IA, Strauss SH: Validating internal controls for quantitative plant gene expression studies. BMC Plant Biol 2004, 4:14. 29. Walter A, Silk WK, Schurr U: Environmental effects on spatial and
temporal patterns of leaf and root growth. Annu Rev Plant Biol 2009, 60:279-304.
30. West G, Inze D, Beemster GTS: Cell cycle modulation in the response of the primary root of Arabidopsis to salt stress. Plant Physiol 2004, 135:1050-1058.
31. Green PB: Growth and cell pattern formation on an axis - critique of concepts, terminology, and modes of study. Bot Gaz 1976, 137:187-202. 32. Silk WK: Steady form from changing cells. Int J Plant Sci 1992, 153:S49-S58. 33. Maurice I, Gastal F, Durand JL: Generation of form and associated mass
deposition during leaf development in grasses: a kinematic approach for non-steady growth. Ann Bot 1997, 80:673-683.
34. Weele van der CM, Jiang HS, Palaniappan KK, Ivanov VB, Palaniappan K, Baskin TI: A new algorithm for computational image analysis of deformable motion at high spatial and temporal resolution applied to root growth. Roughly uniform elongation in the meristem and also, after an abrupt acceleration, in the elongation zone. Plant Physiol 2003, 132:1138-1148.
35. Hejnowicz Z, Karczewski J: Modeling of meristematic growth of root apices in a natural coordinate system. Am J Bot 1993, 80:309-315. 36. Sharp RE, Silk WK, Hsaio TC: Growth of the maize primary root at low
water potentials. I. Spatial distribution of expansive growth. Plant Physiol 1988, 87:50-57.
37. Petersson SV, Johansson AI, Kowalczyk M, Makoveychuk A, Wang JY, Moritz T, Grebe M, Benfey PN, Sandberg G, Ljung K: An auxin gradient and maximum in the arabidopsis root apex shown by high-resolution cell-specific analysis of IAA distribution and synthesis. Plant Cell 2009, 21:1659-1668.
38. Nawy T, Lee JY, Colinas J, Wang JY, Thongrod SC, Malamy JE, Birnbaum K, Benfey PN: Transcriptional profile of the Arabidopsis root quiescent center. Plant Cell 2005, 17:1908-1925.
39. Lee K, Avondo J, Morrison H, Blot L, Stark M, Sharpe J, Bangham A, Coen E: Visualizing plant development and gene expression in three dimensions using optical projection tomography. Plant Cell 2006, 18:2145-2156. 40. Truernit E, Bauby H, Dubreucq B, Grandjean O, Runions J, Barthelemy J,
Palauqui JC: High-resolution whole-mount imaging of three-dimensional tissue organization and gene expression enables the study of phloem development and structure in Arabidopsis. Plant Cell 2008, 20:1494-1503. 41. Lewis J: From signals to patterns: space, time, and mathematics in
developmental biology. Science 2008, 322:399-403.
42. Staiger CJ: Signaling to the actin cytoskeleton in plants. Annu Rev Plant Phys 2000, 51:257-288.
43. Rahman A, Bannigan A, Sulaman W, Pechter P, Blancaflor EB, Baskin TI: Auxin, actin and growth of the Arabidopsis thaliana primary root. Plant J 2007, 50:514-528.
44. Ringli C, Baumberger N, Diet A, Frey B, Keller B: ACTIN2 is essential for bulge site selection and tip growth during root hair development of Arabidopsis. Plant Physiol 2002, 129:1464-1472.
45. Bannigan A, Baskin TI: Directional cell expansion - turning toward actin. Curr Opin Plant Biol 2005, 8:619-624.
46. Rose AB, Elfersi T, Parra G, Korf I: Promoter-proximal introns in Arabidopsis thaliana are enriched in dispersed signals that elevate gene expression. Plant Cell 2008, 20:543-551.
47. Ursin VM, Irvine JM, Hiatt WR, Shewmaker CK: Developmental analysis of elongation factor-1-alpha expression in transgenic tobacco. Plant Cell 1991, 3:583-591.
48. Hachez C, Moshelion M, Zelazny E, Cavez D, Chaumont F: Localization and quantification of plasma membrane aquaporin expression in maize primary root: a clue to understanding their role as cellular plumbers. Plant Mol Biol 2006, 62:305-323.
49. Basu P, Pal A, Lynch JP, Brown KM: A novel image-analysis technique for kinematic study of growth and curvature. Plant Physiol 2007, 145:305-316. 50. Erickson RO: Modeling of plant growth. Ann Rev Plant Physio 1976,
27:407-434.
doi:10.1186/1741-7007-8-18
Cite this article as: Merret et al.: Monitoring the regulation of gene expression in a growing organ using a fluid mechanics formalism. BMC Biology 2010 8:18.
Submit your next manuscript to BioMed Central and take full advantage of:
• Convenient online submission • Thorough peer review
• No space constraints or color figure charges • Immediate publication on acceptance
• Inclusion in PubMed, CAS, Scopus and Google Scholar • Research which is freely available for redistribution
Submit your manuscript at www.biomedcentral.com/submit
Merret et al. BMC Biology 2010, 8:18
http://www.biomedcentral.com/1741-7007/8/18