Dynamic Nuclear Polarization for NMR: Applications and Hardware Development by
Andrew Casey B.S., Chemistry (2006)
State University of New York at Stony Brook
Submitted to the Department of Chemistry in Partial Fulfillment of the Requirements for the Degree of Master of Science in Chemistry
at the
Massachusetts Institute of Technology June 2008
© 2008 Massachusetts Institute of Technology All rights reserved
MASSACHUSMS INSTIt OFTEGHNOLOGY
JUN
LIBRARIES
2008
LIBRARIES
Signature of Author... .... .... ...Department of Chemistry
ARCHIVES
(r 6
Certified by... ... 0 ... Robert Griffin, Professor of Chemistry, Thesis Supervisor Accepted by... ... ... Robert W. Field, Chairman, Departmental Committee on Graduate StudentsDynamic Nuclear Polarization for NMR: Applications and Hardware Development
by Andrew Casey
Submitted to the Department of Chemistry on May 23, 2008 in Partial Fulfillment of the Requirements for the Degree of Master of Science in Chemistry
Abstract
Solid State NMR (SSNMR) can determine molecular as well as supermolecular structure and dynamics. The low signal intensities make many of these experiments prohibitively long. Dynamic Nuclear Polarization provides a method of enhancing signal intensities and reducing experimental time.
DNP requires transferring polarization from unpaired electrons to nuclei. Driving this transfer requires irradiation with high power microwaves which are generated with gyrotrons oscillators. We describe a series of modifications are made to an existing 140 GHz gyrotron allows for continuous wave operation and higher power and greater stability.
DNP mechanisms are primarily limited to SSNMR. A method of using DNP to enhance liquid state NMR spectra is described. Signal enhancements of over 100 are reported for a solution of glucose.
To obtain maximum DNP enhancements microwave irradiation times of up to 40 s are often required. While this increases your signal intensity for a single scan it decreases the gain from signal averaging for a given time. A method of choosing the optimum irradiation time is presented.
DNP enhancements in continuous wave experiments exhibit an inverse field dependence. There are several pulsed DNP experiments exhibit no field dependence. To further study these techniques a pulsed 9 GHz EPR spectrometer has been assembled.
Thesis supervisor: Robert Griffin Title: Professor of Chemistry
Table of Contents
ACKNOWLEDGMENTS---4
CHAPTER 1: INTRODUCTION---5
CHAPTER 2:140 GHz GYROTRON MODIFICATIONS TOWARDS CW OPERATION---8
CHAPTER 3: 2 DIMENSIONAL TEMPERATURE JUMP DYNAMICAL NUCLEAR POLARIZATION--- 15
CHAPTER 4: OPTIMUM DNP IRRADIATION TIME---23
CHAPTER 5: LOW TEMPERATURE DNP PROBES---27
CHAPTER 6: 9 GHz PULSED EPR SPECTROMETER--- 30
CHAPTER 7: FIELD LOCK/SWEEP SYSTEM--- 32
APPENDIX A: GYROTRON CONTROL SYSTEM--- 35
APPENDIX B: 140 GHZ GYROTRON OPERATION---46
ACKNOWLDEGEMENTS
I would like to thank Professor Robert Griffin for the opportunity to work in his research group and for his guidance and support.
My work in the laboratory would not have been possible without the immense amount of guidance and assistance that I have received. Jeff Bryant has been of essential help with the both the TJ-DNP experiment as well as the 140 GHz gyrotron. The 140 GHz gyrotron was repaired in collaboration with members of the Plasma Science Fusion Center. Jagadishwar Sirigiri and Ivan Mastovsky have taught me everything I know about gyrotrons.
I would like to thank the other members of the Griffin Group for their
conversations scientific and otherwise for making the group such an enjoyable place to work. I want to specifically thank Thorsten Maly. He has assisted me on every project I have worked on and I owe much of my success to his support. He has helped whenever I have asked and has been a sounding board for ideas both scientific and personal.
Most Importantly I would like to thank my wife, Kieran. She has been extraordinarily supportive. She has managed to keep me happy through some very difficult times in the past years. I would not be where I am today without her.
CHAPTER 1 INTRODUCTION
Solid state NMR (SSNMR) continues to grow as a method of determining biological molecular structure. The large repertoire of multi-dimensional correlation experiments make it particularly attractive. However, due to the inherently low sensitivity of NMR, implementation of these techniques may require days or weeks of signal averaging. Higher sensitivity can be achieved mainly through four approaches; higher magnetic field strengths, more sensitive probe designs, low temperatures, and dynamic nuclear polarization. This thesis will address aspects of the latter three techniques.
Dynamic nuclear polarization (DNP) creates enhancements in nuclear spin polarization by transferring of polarization from electrons. The theoretical enhancement is given by the ratios of the gyromagnetic ratios, for the case of protons this is
Ye / Yh & 660 (1).
Continuous wave (CW) DNP experiments involve irradiation of the EPR spectrum at or near the resonant frequency we. The polarization mechanism is determined by the EPR lineshape and in solids can be described as either the solid effect, thermal mixing, or the cross effect.
The solid effect involves excitation of simultaneous spin flips of both the electron and coupled nuclei. These forbidden transitions are weakly allowed due to the second order non-secular dipolar interaction. Polarization is generated by irradiating the electrons at we ± w, generating both positive and negative enhancements respectively,
and the transition probabilites scale as o,- 2 . The solid effect is dominant when s, the homogenous linewidth, and A, the EPR spectral width, are much less than co (2,3).
Thermal mixing and the cross effect are both three spin process. In thermal mixing a polarizing agent with S >a, is used (4). A homogeneously broadened line can be obtained by using high concentrations of a mono-radical such as TEMPO. Irradiation of one section of the EPR line will through elcctron- electron (e--e) dipolar coupling simultaneously flip the coupled electron and nucleus.
The cross effect involves a polarizing agent with A > co,. It relies on two electrons with resonant frequencies cole and o2e with I,2e - Cole =, n . In the cross effect there are two radicals with different orientations with the correct frequency offset. This is achieved by using a biradical with two radicals with a relatively fixed orientation. Irradiation at ole and 02e generates the maximum positive and negative enhancements. Both thermal mixing and the cross effect have a transition dependence that scale as on,-1
The DNP effect requires high microwave power irradiation of the EPR lineshape of the paramagnetic species since for technical reasons the Q of the microwave circuit is low. To achieve this high power, we have developed gyrotrons oscillators and amplifiers for DNP experiments (5,6). While gyrotrons have been developed and are in use they are still each unique and complicated collections of hardware and software.
The mechanisms by which polarization is transferred in DNP are primarily suitable only to SSNMR, and it is of great interest to bring this technique to liquid state spectroscopy. To this end an in-situ temperature jump experiment has been developed and used to record multi-dimensional spectra. This technique can readily be applied to
small molecule NMR such as metabalomics where thermal cycling will not degrade the sample.
NMR probes used for DNP experiments present unique design constraints, as they must be capable of obtaining low temperatures -90 OK and provide a method of microwave (pw) transmission. With careful planning it is possible to incorporate the pw
transmission into the RF circuit.
Currently DNP experiments are preformed as a saturation continuous wave (CW) experiment. There are promising pulsed DNP experiments such as the dressed state solid effect (7,8) and the integrated solid effect (9,10). These pulsed experiments, however, require short high power pulses with phase control. While these sources at high field are under development, such as a 140 GHz gyroamplifier, they are not yet readily available for use. For this reason a 9 GHz pulsed EPR spectrometer is being assembled.
Chapter 2 discusses modifications to an existing 140 GHz gyrotron to achieve greater power and stability, which have reduce experimental times by a factor of two. Chapter 2 also discusses a comprehensive control system that is capable of interfacing with a wide range of hardware configurations towards creating a turn-key like system. The temperature jump DNP experiment which consists of freezing a liquid sample, polarizing the sample, then rapidly melting and acquiring the liquid state enhanced spectra, is discussed in detail in chapter 3. Chapter 4 discusses the selection of optimal parameters for DNP experiments. Chapter 5 discusses the design of a 400 MHz low temperature DNP probe based on an existing dual transmission line DNP probe. Chapter 6 discusses the 9 GHz pulsed EPR spectrometer.
CHAPTER 2
140 GHz Gyrotron Modifications Towards CW Operation
DNP experiments require high power uw sources because the large size of SSNMR magic angle spinning rotors, (2.5-4 mm outer diameter), combined with the RF
coil precludes a resonance structure from being created. This absence of resonance structure results in a Q of -5; as compared to EPR resonators that can achieve Q's of several hundred, and thus the low Q dictates the use of high power sources.
Gyrotrons are "fast wave" devices. The generation of pw's uses a resonance
interaction between the microwave cavity and the electron beam gyrations in a magnetic field. Thus, the gyrotron is an electron cyclotron resonance maser that emits coherent radiation near the relativistic electron cyclotron frequency or its harmonic given by S= s (eBo /y'mc) where s is the harmonic number, e is the electron charge y' is the relativistic mass factor, m is the electron rest mass, andc is the speed of light. Operation of a gyrotron requires the maintenance of a high vacuum -10-9Torr.
V
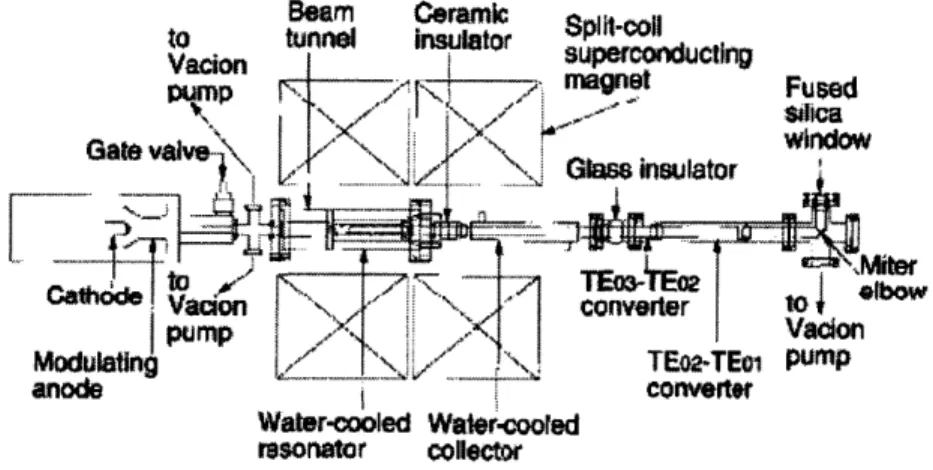
The configuration of the gyrotron is show in figure 2.1, and a comprehensive description of the device and spectrometer have been published (11). The gun anode voltage is adjusted to focus the electron beam along the beam-tunnel axis. The electron beam is compressed by an external six turn water cooled electromagnet. The inner diameter of the beam tunnel is matched to the compression that the electron beam experiences. The beam tunnel collimates the beam as well as absorbing any reflected microwave power.
As the electrons move from the cathode toward the cavity they gyrate and increase in rotational energy as the magnetic field becomes more intense. The beam then passes through the resonator where phase bunching (11,12) occurs resulting in the emission of coherent radiation. A large amount of ohmic heating occurs in the cavity and it must be water cooled. The resonator has a temperature dependent frequency drift of 2.2 MHz/K, and the temperature rise can be observed as a 5 ppm frequency shift during the first 3 seconds of operation because of cavity expansion.
As the magnetic field lines diverge after the resonant structure of the gyrotron the electron beam experiences a force given by F = q Vx B . This should cause the beam to
decompress towards the sides of tube into the collector, a water cooled portion of the gyrotron. The portion of electrons that strike the collector can be calculated.
The electron beam current emitted from the cathode is known. The collector is electrically isolated from the rest of the gyrotron with ceramic breaks. Any electrons striking the collector pass through a 100 O resistor and then to a ground. The voltage across the resistor is used to measure the electron beam current.
Until recently, the 140 GHz gyrotron was operated in pulsed operation with a maximum duty cycle of 50% and for stable operation it was run at a lower duty cycle. The gyrotron had a base pressure of lx10-9 Torr, and during operation the pressure as measured by an ion-gauge placed directly before the ion pump would rise with the pulses to 5x10"9 Torr. This pressure was not indicative of the pressure experienced by the
electron beam. The conductance of gas molecules to the ion pump was slowed by inadequate pathways to the ion pump. Molecules emitted when the electron beam strikes the collector are required to pass out of the inner waveguide through small slits placed only at the connection to the miter bend and at the end of the collector. As the ion pump was placed outside of the waveguide it collected, and sensed, only the fraction of molecules that were emitted from the collector.
This gyrotron was operated in this configuration in pulsed mode for over 10 years. As it was heavily utilized no major improvements were implemented as this would result in significant down time. Recently, however, the gyrotron tube developed a leak that required repair and complete disassembly of the tube allowing for hardware modifications to be made. Thus, larger slits and a -1 cm gap were inserted into the waveguide at the miter bend. This gap allows for improved conductance to the ion pumps effectively reducing the pressure in the waveguide. An over-moded waveguide can maintain efficient transmission over a gap that is less than the diameter of the waveguide, and, thus the gap inserted in the over-moded-waveguide resulted in negligibly small losses of only .5 dB.
The beam current measured at the collector was 3 mA less than the current emitted from the cathode. This uncollected portion of the electron beam was therefore
striking the miter bend depositing -30 W of heat onto the waveguide which is in direct contact with the quart transmission window. As a consequence, the window was reaching temperatures of over 100 'C causing an increase in pressure as the copper waveguide outgases. Of more immediate concern is the fact that the indium seal, which holds the window in place, has a melting point of only 156.6 'C.
A permanent magnet was placed with its field perpendicular to the electron beam path. This extra force diverts the remaining electrons into the collector resulting in reduced heating as well as pressure.
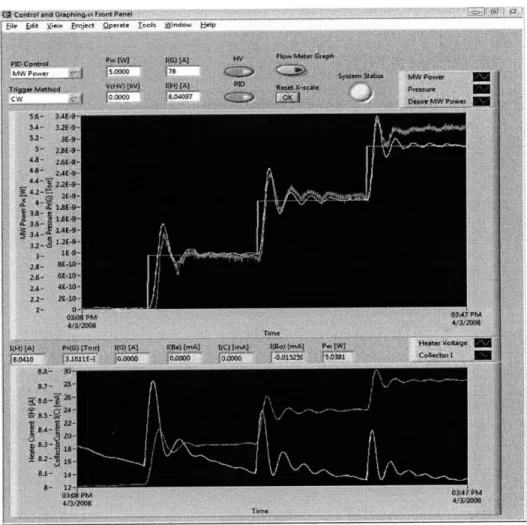
Figure 2.2 Standard user interface. Top panel; Pressure (red), MW Power (white), Desired power (white). Bottom panel; Heater voltage (white). Beam current (red). Note heater voltage decrease is due to the system warming up.
A large section of smooth wall waveguide (64 in) was replaced with corrugated waveguide, which has lower losses allowing for greater power to be delivered to the probe at the same operating conditions of the gyrotron. Since the gyrotron is operating at less challenging regime, it exhibits improved time and frequency stability.
A software control and monitoring system is necessary for stable operation of the gyrotron. A standard user interface that is portable across a wide range of hardware configurations is also desirable, and was developed as illustrated in Figure 2.2. As the DNP enhancement depends on uw power, it is necessary to have a feed back loop control the output to maintain a constant power over long NMR experiments. The uw power is measured with a diode placed as near as possible to the probe. The power output is monitored by a LabView program that is used to operate all aspects of the gyroton. The power is controlled through a proportional-integral-derivative (PID) software controller.
PID control is a method of controlling a process that is determined by a single variable. The error is calculated and is used to generate a correction factor which is then added to the controlling variable. The PID control algorithm is given by
Ke(t)+ K, e(t)ir + K, dt where e(t)is the error at a given time, K, K, K, KD are the
0
proportional, integral, and derivative gain respectively. This algorithm generates a correction factor which is added to the control variable.
The proportional term K, attempts to correct for the current error of the system. Systems controlled by K, alone will either oscillate or reach a steady state offset from the desired value. These steady state offsets can be corrected for by incorporation of the integral term. The time r is chosen to be on the order of the time constant of the system
being controlled. The derivative term is used to drive the system to a steady state faster. The derivative term works well for ideal cases but can be very sensitive to noise. The correct choice of K,, K,, KD and r depends on the system being controlled.
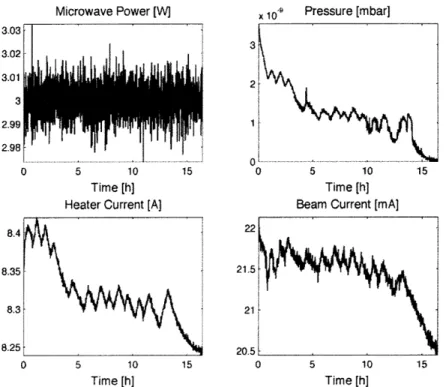
With PID control and hardware modifications the 140 GHz gyrotron is now operated in a CW fashion. Figure 2.3 illustrates the enhanced performance characteristics of the gyrotron. Over a 15 hour period the power fluctuation was less than 1%. Also indicated is that over continuous use the power and heater voltage continue to fall. The gyrotron can be run with pressure levels remaining below the detectable limits of the ion pumps. Microwave Power [W] 3.03 30.2 . I 0 ... . .... .... ... ...
....
... o 5 10 15 Time [h] Heater Current [A]x 10o Pressure [mbar]
5 10
Time [h] Beam Current [mA]
0 5 10 15 0 5 10 15
Time [h] Time [h]
Figure 2.3 Representative 15 hour operation of 140 GHz gyrotron, note that pressure falls below detectable limits and high
power stability
The control system also creates a standard user interface. The control software has currently been implemented on both the 140 GHz and 250 GHz gyrotron. This is despite
3
2 2
the fact that both systems have disparate hardware configurations. This is accomplished by the control system using a hardware independent format for all software functions. To
use the software on a given set of hardware all that must be modified is the protocol for changing the software format to the hardware specific format. This can be done in a straight forward manner.
CHAPTER 3
Temperature Jump Dynamic Nuclear Polarization
This Chapter begins with a draft of a paper prepared for submission for publication. As such it is written in a different style and has its own references listed at the end of the paper.
Abstract
Nuclear magnetic resonance (NMR) plays an increasing role in the elucidation of molecular structure and function, and the sensitivity of NMR experiments continues to be an issue of paramount importance. We report large sensitivity enhancements of more than a factor of 100 in solution-state NMR spectra of glucose. We transferred polarization from an unpaired electrons of a biradical to the nuclear spins of a frozen solution via microwave irradiation near the electron paramagnetic resonance (EPR) frequency. The sample was then rapidly melted with infrared radiation, followed by the observation of the solution-state NMR signal. We demonstrated that the experiment can be recycled, in
situ, to perform enhanced sensitivity solution-state two-dimensional NMR '3C-'3C
correlation experiments. This method of sensitivity enhancement should open new avenues of research in solution-state NMR.
Over the last decade there has been a resurgence of interest in the application of dynamic nuclear polarization (DNP) techniques directed at increasing the sensitivity in nuclear magnetic resonance (NMR) experiments (1-3). The interest is driven by the possibility of enhancing signal intensities in NMR spectra by factors of 102 - 103 which historical precedent suggests will open many new avenues of research. The experiments were initially directed at signal enhancement in magic angle spinning (MAS) spectra of
solids (4), and, since they were performed at magnetic fields = 5T, they required development of gyrotron microwave sources operating in the range =140 GHz for irradiation of the EPR spectrum of the exogenous paramagnetic polarizing agent (5,6). There is also considerable interest in applying these techniques to high field solution-state NMR experiments and there have been three recent efforts aimed at achieving this goal. The first relied on the scalar relaxation, a mechanism that is operative at high fields, but is, unfortunately, only applicable in special cases (7). The second is the "dissolution experiment" where the solid sample is polarized at low field, dissolved with excess superheated solvent, and then transferred to a second spectrometer for observation of the NMR spectrum (8). Dissolution DNP was recently integrated with the single scan multi-dimensional NMR technique (9) to obtain two-multi-dimensional (2D) '5N-'H correlation spectra (10). In the third approach, we have demonstrated the possibility of performing the polarization and melting in the same spectrometer, the latter being performed with CO2 laser irradiation (11). Our approach has the advantage of circumventing the
polarization loss associated with shuttling the sample to another spectrometer. Thus, we refer to this experiment as in situ temperature jump DNP (TJ-DNP). Further, and in contrast to the dissolution experiment, the TJ-DNP experiment can be recycled and is suitable for the acquisition of multiple scans of comparable intensity. Here we demonstrate that it is possible to incorporate the extensive repertoire of multidimensional solution-state NMR experiments into this scheme.
Figure 1 shows the 13C NMR spectrum of an 800 mM 2H7, 3C6 glucose solution
obtained with and without TJ-DNP. The enhancement was - 170 for C1, -140 for C2-5,
site-specific relaxation losses during the melting process. We are exploring approaches to make the intensities more quantitative, for example, by improving the rate of melting.
with DNP Ft(C2-5)= 140 Et(c l)= 170 St(C6)= 100 without DNP x 20 I I I I I 100 90 80 70 60 13C Chemical shift (ppm)
Figure 1 13C NMR spectra of 800 mM 2H7, "C6 glucose solution prepared with 2H6-DMSO/2H20/H20 = 5/4/1 and 5
mM TOTAPOL, with (top) and without (bottom) TJ-DNP. For TJ-DNP, 140 GHz microwave irradiation was applied for 30 s at 100 K. A 0.8 s CO2 laser pulse was used to melt the sample. The room temperature spectrum without
DNP (bottom) was scaled up by 20 for ease of comparison. The enhancement was - 170 for C1 (both a and 03
form), -140 for C2-5, and -100 for C6. TJDNP spectrum was measure with a single scan, and the room temperature
spectrum without DNP is the result of 2048 scans.
Integration of the TJ-DNP experiment with multidimensional spectroscopy is illustrated in Figure 2, and is accomplished by inserting an evolution and mixing period into the sequence following the melting step. A solution state 2D 13C-13C correlation
DNP CP TJ TOCSY Detection ... ... ... ... ... .. ... ... ... ... ... .. _ 13c 2H Laser
!--7
ni
1+
i
Figure 2 Experimental scheme for 2D TJ-DNP experiment. The sample was irradiated with 140 GHz microwaves at 100 K, followed by 'H-'3C cross polarization. The magnetization on 13C was stored along the z-axis to minimize polarization loss by relaxation during melting. Immediately following melting, a 2D NMR pulse sequence was initiated. For TOCSY, a 1800 2H pulse was applied in the middle of t1 evolution for decoupling. DIPSI-2 spin locking was on for 4.5 ms followed by 1 ms trim pulse to reduce anti-phase line shape components. The 13C signal was detected with WALTZ 2H decoupling.
experiment is recorded in the usual manner (12), and the resulting 2D spectrum is shown in Figure 3. Note that the presence of the paramagnetic polarizing agent does not lead to
appreciable broadening of the NMR signals. This is best seen in the expansion of the 13C 1
region that clearly shows the resolution present in the at and P forms of glucose.
60 70 80 ro -. 90 -100 100 90 80 70 60 o 3C Chemical shift (ppm)
Figure 3 "C-"C TOCSY NMR spectrum of 2H7, 13C6 glucose solution, with DNP (10 s) - TJ (0.8 s) and 40 s recycle delay.
I transient of 1024 data points was accumulated for 96 tl increments. 4.5 ms of DIPSI-2 mixing with co1/2n = 29 kHz was used for TOCSY.
The direct detection of 13C in solution offers a valuable alternative to indirect
detection via 1H, provided that the sensitivity of 13C can be enhanced, as demonstrated here. 13C detected experiments dramatically shorten the duration of the pulse sequence
when compared to their corresponding 1H detected counterparts, thereby reducing losses due to transverse relaxation. 1H solvent suppression is also unnecessary. 13C detected experiments are particularly beneficial for the study of paramagnetic samples because the paramagnetic contributions to relaxation are reduced by a factor of -10 compared to 'H.
13C detected experiments also facilitate the investigation of spectral regions where 'H
detection may be difficult such as those undergoing chemical or conformational exchange. Finally, as illustrated here, 13C detected experiments also enable measurements in completely deuterated samples. In total, these advantages of direct 13C detection should enable new experiments for studies of larger bio-molecular systems. These features have been appreciated by other groups in recent years and as a consequence there has been
considerable effort devoted to developing experiments that utilize direct 13C detection
(13, 14).
Features of the experiment that could be improved are as follows. First, the temperature at which the polarization is performed could be lowered from 100 K to 10 K. This would yield another factor of -9 in signal intensity as the Boltzmann factor and the polarization enhancements from DNP would both be larger. Second, we are currently using quartz rotors and most of the heat from the laser pulse is expended in bringing the rotor from 100 K to 300 K. Alternative rotor materials may allow faster and more uniform melting, reducing losses due to relaxation, and improving the line shape. Finally, it would be beneficial to move the experiments to a higher operating frequency where contemporary solution NMR experiments are currently performed.
References and Notes
1. R. A. Wind, M. J. Duijvestijn, C. van der Lugt, A. Manenschijn, J. Vriend, Prog.
Nucl. Magn. Reson. Spectrosc. 17, 33 - 67 (1985).
2. S. B. Duckett, C. J. Sleigh, Prog. Nucl. Magn. Reson. Spectrosc. 34, 71-92 (1999).
3. G. Navon, et al., Science 271 1848-51 (1996). 4. D. A. Hall, et al., Science 276 930-932 (1997).
5. L.R. Becerra, et al., J. Magn. Reson. A 117, 28-40 (1995). 6. V.S. Bajaj, et al., J. Magn. Reson. 160, 85-90 (2003).
7. N. M. Loening, M. Rosay, V. Weis, R. G. Griffin, J. Am. Chem. Soc. 124, 8808-8809 (2002).
8. J. H. Ardenkjaer-Larsen, et al., Proc. Natl. Acad. Sci. U. S. A. 100, 10158-10163 (2003).
9. L. Frydman, T. Scherf. A. Lupulescu, Proc. Natl. Acad. Sci. U. S. A. 99, 15858-15862 (2002).
10. L. Frydman, D. Blazina, Nature Physics 3, 415-419 (2007).
11. C.-G. Joo, K.-N. Hu, J. A. Bryant, R. G. Griffin, J. Am. Chem. Soc. 128, 9428-9432 (2006).
12. A. Eletsky, O. Moreira, H. Kovacs, K. Pervushin, J. Biomol. NMR 26, 167-179 (2003).
13. D. Lee, B. Vogeli, K. Pervushin, J. Biomol. NMR 31, 273-278 (2005).
14. W. Bermel, I. Bertini, I. C. Felli, M. Piccioli, R. Pierattelli, Prog. Nucl. Magn.
Reson. Spectrosc. 48, 25-45 (2006).
15. We thank J. Sirigiri and R.J.Temkin for their assistance with the 140 GHz gyrotron source used in these experiments and Jeff Bryant for his superb technical assistance. This research was supported by grants from the National Institutes of Health EB002804 and EB002026.
Supporting Online Material www.sciencemag.org Materials and Methods
Supporting Information / Materials and Methods
800 mM 2H7, 13C6 glucose solution was prepared with 2H6-DMSO / 2H20 / H20 = 5 / 4 /
1-(2,2,6,6,-Tetramethyl- 1 -oxyl-4-piperidinyl)oxy-3-(2,2,6,6-tetramethyl- 1 -oxy-4-oioeridinyl)amino-propan-2-ol. The concentration of TOTAPOL was 5 mM. All experiments were conducted on a 5 T (211 MHz for 'H, 53.31 MHz for 13C, and 32 MHz for 2H) magnet with a home built multi-channel DNP NMR probe. An 8 - 10 [tL sample was placed in a
2.5 mm outer diameter quartz rotor. The sample was rotated at -380 Hz to insure
uniformity of microwave and IR irradiation at a temperature of 100 ± 2 K which was maintained by circulating cold N2 gas. The temperature jump was achieved by irradiation
at 10.6 ýtm from a 10 W CO2 laser through a silver coated silica hollow waveguide. The
2D data matrix was acquired with 2 * 96 * 1024 data points, with a single transient per data file and a recycle time of 40 s required by the refreezing. 2H decoupling was applied in both dimensions. Although the microwave irradiation was reduced to 10 s for the 2D data acqusition, to improve the stability of the gyrotron, more than 60 % of the enhanced signal was observed compared to 30 s of irradiation.
Future Directions
Polarization losses due to relaxation significantly diminish the enhancement observed in the TJDNP experiment. These losses are mainly from the carbon jT. In the ideal melting scenario the full Boltzman enhancement should be obtained (Tobs/TPorize) which for the current version of TJDNP should be factor of 3. Factors of -1 are currently observed. These loses due to relaxation can be minimized by melting at a faster rate. As the sample is heated it will pass through a T, minimum. Melting faster will minimize the time to be spent at the T, minimum and therefore the polarization loss. To this end alternate rotor materials are being tested. Quartz is optically black at 10.6 microns and
therefore the IR radiation is heating the rotor. Thus, in the current regime the sample is melted indirectly by the quartz which then melts the sample. The optical transmission of germanium is ~45 %. This may allow for more direct and therefore faster heating of the
sample.
Reported enhancement values may also be artificially low. They are reported assuming that the entire sample volume has melted. If this is not the case the off signal reference will be inflated due to a higher sample volume appearing to give lower
CHAPTER 4
DNP Polarization timing
In NMR experiments signal averaging is often required to increase signal to noise ratios, and is often the most time consuming step in the experiment. The result is an increase in the signal to noise ratios by ~-N- where N is the number of signals being averaged. In DNP experiments the pw irradiation time determines N as it is on the order of seconds while the NMR experiment is on the order of milliseconds. Thus, there is a trade off between shorter pw irradiation times which allow for more signals to be acquired and longer pw irradiation time which allow for larger signal to noise ratios per scan. This optimization is similar to that of Ernst-Angle repetition (13)
The polarization enhancement for DNP is given by
6ema, lle TB)
where ~is the maximum achievable enhancement, T w is the microwave irradiation
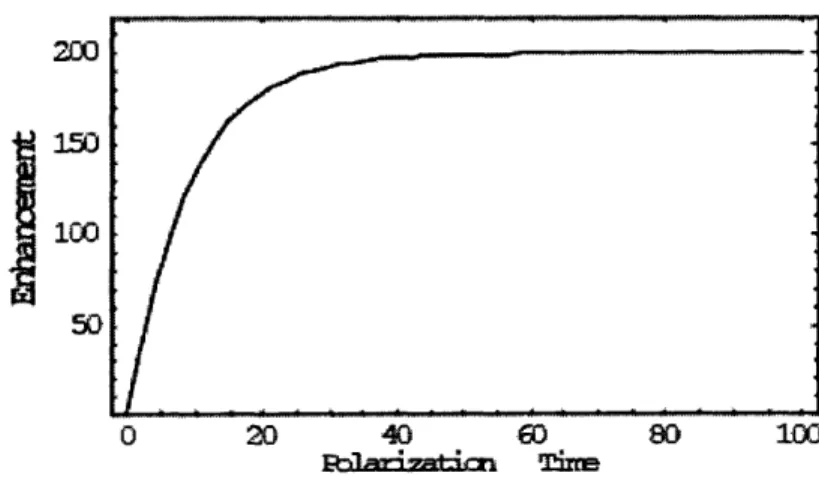
time and Tis the polarization growth time constant (14). Figure 4.1 shows the enhancement as a function of microwave irradiation time.
2oo
1W
50
aFigure 4.1 Ideal DNP polarization buildza up, Build time, TB is 9 s.
Under typical experimental conditions, 90 'K 5 mM TOTAPOL, the time constant is -9 s (15). In order to achieve maximum polarization a microwave irradiation times of 40 s are necessary.
The signal to noise increase of signal averaging of a DNP experiment is given by
TM
where T is the total experiment time and - is rounded to the lower integer. This gives
TT
a total enhancement of 6 = sm 1 - e x T
The optimum microwave irradiation time is found by optimizing the equation with respect to T W .
-TMrT
7-e T X 6m~x
T
x T,-eT xTB+2xT,dTmw 2x Tw xTB
Setting this equal to 0 gives
TMW
0=-TB+e TB (TB +2xT,)
Which has the solutions of
2=
- T1,-F
Where W(x,z) is the X-th root of the lambert W function of Z. This gives an optimal
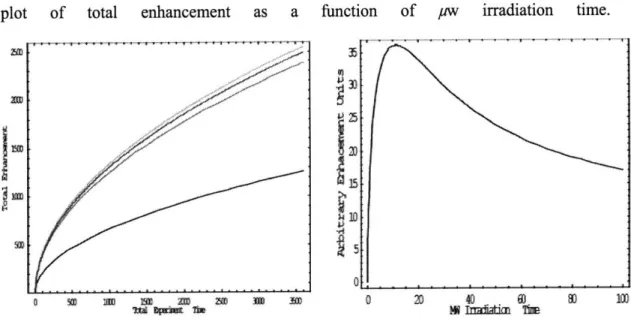
T, = 1.256 x TB.For a time constant of 9 s this is -11.3 s. Figure 4.2 shows the total signal to noise ratio due to DNP signal averaging at various pw irradiation times, and a
plot of total enhancement as a function of pw irradiation time.
a M M M M M 0 0 40 6) 83
U110 0* I= mw TmaL-6n Thie
Figure 4.2 A) Shows the total signal to noise enhancement due to DNP and signal averaging
for 1,6,11.3,and 16 seconds. B) The total signal to noise intensity to signal averaging and DNP as a function of mw irradiation time. Both graphs have a time constant of 9 s.
In TJ-DNP experiments the refreezing time is equivalent or longer than the pw irradiation time. The refreezing time is experimental dead time where no data can be recorded and no polarization can be created. This refreezing time reduces the loss in time efficiency at higher microwave irradiation times. For the case of TJDNP the enhancement is given by
ri
T
6
=6max 1- e x T +TFT
Where TF is the freezing time. This gives
d
e T X max T X
2
2xTF +TB -e T xTB +2
xTmw
dT,, 2xTx T
Setting to this equation to zero yields
103 ~am Irm
i"
%~
5a0
TMW
2T, + T, - e " T•, + 2Tm =0 Which gives an optimum irradiation time of
T = -2 x T, - T, -2xTxW -e 2
2
2
Figure 4.3 shows the optimum microwave irradiation time as a function ofT,. For a freezing time of 30 s use of the irradiation time that has been optimized for no freezing results in a -20% loss in time efficiency.
"
-15
15I
5
0 10 20 30 40
Figure 4.3 The optimum polarization time for TJDNP experiments as a function of the refreezing time.
CHAPTER 5
Low Temperature DNP Probes
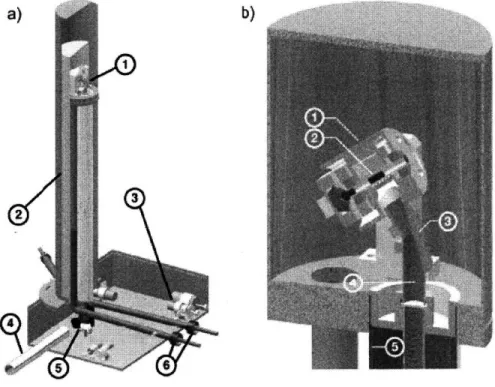
Performing DNP experiments requires a probe design that can incorporate both the requirements of SSNMR and the additional requirements for DNP. SSNMR experiments require rotating the sample at several kilohertz and applying strong RF pulses at the nuclear frequencies of interest. The additional requirements for performing DNP experiments are the ability to maintain stable spinning down to 80 OK as well as providing a means of pw irradiation and for TJ-DNP 10.6 pm irradiation. Figure 5.1 is a representative low temperature DNP probe.
a)
Figure 5.1. Taken from reference 16. Drawings of a SSNMR DNP probe a) probe showing 1) probe-head 2) cut-out of vacuum dewar 3) tuning elements of the RF circuit are in the box 4) corrugated waveguide from gyrotron 5)concave and flat mirrors to direct microwaves into the vertical waveguide 6) vacuum jacketed transferlines for the bearing and drive cryogens.
b) probe-head for 4 mm rotors. 1) stator housing 2) sample rotor within RF coil (at the 'magic angle') 3) metal mirror miter 4)
the inner conductor of the coaxial RF transmission line is corrugated on the inside; serving also as an overmoded waveguide.
5) outer conductor of the RF coaxial line is stainless steel for thermal isolation but is coated with silver and gold for good electrical performance.
Temperature control for DNP probes is accomplished by controlling the temperature of the bearing and drive gases used for spinning the sample rotor. Dry nitrogen gas is used as the spinning gas to reach cryogenic temperatures. The gas is first regulated at room temperature by a Bruker MAS controller. The gas is then passed through a heat exchanger to reach the desired temperature (17). The temperature that is achieved is a function of both the flow rate of gas through the heat exchanger as well as the amount of liquid nitrogen used to cool the gas. The flow rate of gas is also used to determine the spinning speed of the rotor. To separate control of these parameters the cold gas is passed through a vacuum jacketed transfer line equipped with a heater. The heater is controlled through an external PID controller. This additional heating control allows for quasi-independent control of the temperature and spinning.
To achieve higher temperature stability and to reduce the demand on the cooling system only a small area around the sample is cooled. The sample area is isolated within a bronze Dewar. To further minimize thermal contacts the RF transmission lines are made in two parts. Half of the transmission line is made of stainless steel to act as a thermal break and reduce heat transfer.
Due to the thermal cycling experienced during DNP experiments transmission line probes are used. The long RF transmission lines allow for thermal separation of the tuning and matching circuits from the sample region (18). The RF transmission line can also be used as a waveguide for the aw's. The RF transmission line can act as a corrugated wave guide by corrugating with ¼ X groves. Unlike previous pw delivery
methods (19) uw's are delivered perpendicular to the sample. The waveguide is terminated with a mirrored miter bend terminated with a horn which disperses the ,w's in
a near Gaussian pattern. This allows for greater penetration of the sample and more uniform polarization.
Using a Gaussian beam pattern launched from a corrugated waveguide is an improvement over previous designs which use fundamental waveguides as corrugated have lower transmission losses (20). Fundamental waveguides have lower transmission efficiencies as well as higher insertion losses. The beam pattern emitted is also less desirable. Fundamental waveguide is very sensitive to positioning. Changes of -lmm can result in significant performance changes. As the probe is thermally cycled movement of the waveguide is inevitable and therefore a delivery method not as sensitive to placement is preferred.
CHAPTER 6
Pulsed 9 GHz EPR Spectrometer
Pulsed DNP experiments do not have the same adverse magnetic field dependence as CW DNP. The field dependence of the cross effect (CE) CW DNP mechanism is 1/Bo. As modem biological NMR moves towards higher and higher magnetic fields i.e. 700-900 MHz CW DNP becomes continuously less attractive. Pulsed DNP can overcome this limitation as well as being more efficient.
For pulsed DNP experiments large B1 fields (on the order of MHz) are required as
well as nano-second pulses and phase control. Currently sources capable of meeting such demands are low field up to 95 GHz. As these experiments exhibit no field dependence results obtained at 9 GHz are applicable at higher frequencies.
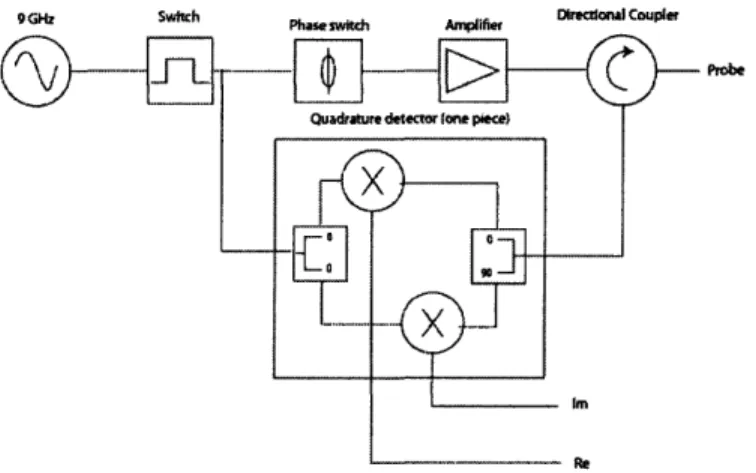
Figure 6.1 Schematic of the 9 Ghz pulsed EPR spectrometer showing major components, the quadrature detector
has been expanded for clarity.
To study these mechanisms at 9 GHz a pulsed EPR spectrometer is being assembled. Figure 6.1 shows a schematic of the spectrometer. The spectrometer has 4 selectable phases. Arbitrary pulses sequences are easily generated using SpecMan software (21). The TWT amplifier generates -50 dB gain. This spectrometer is capable of
producing short (10's of ns) pulses. Figure 6.2 shows the 20 ns pulse shape at two frequencies. Figure 6.3 illustrates the lack of distortion of the original trigger pulse.
-9.3
u 2 10 20 30 40 50 60 70 80 SD
Figure 6.2 Representative 20 ns pulse shapes at 9.25 and 9.3 GHz
Lawv Powr MW
High Power MW.~
0 70 0 11:I0 190 210 230 20
Figure 6.3 Pulse shape as it movers from TTL trigger through the amplifier. 130 150 170
_~~____~_I__~~_____~______I_·~__X____X__U____*_XI·I__II__JI_·.-(-.--1-·1111411-1
~s~
~"""I ~~'"'"~~"~1'~"~'~Y~x~ II~YY~
_~X~·XIII~~·IXX~X~-·X^-~IIIIXrX~II~^IX~~
.. .... .. .. .. .. ... .. ... .. ... .. .. .. .. .. .
CHAPTER 7
Field lock/sweep system
Characterizing the DNP enhancement of various paramagnetic species requires an enhancement profile as a function of the magnetic field strength. As different paramagnetic species provide maximum enhancement at different field strengths it frequently required to adjust the magnetic field. To facilitate as well as partially automate this process a computer controlled field mapping unit (FMU) is utilized to track as well as control the magnetic field strength.
This system is a modification of a previous design (22). The current system has been designed to function on a 212 MHz NMR magnet using a different software environment. The system consists of the superconducting NMR magnet, a superconducting sweep coil, a bipolar power supply, a FMU, a custom designed broadband NMR probe, and a PC.
The FMU is a commercial device. The unit operates by recording a pseudo-CW NMR spectra. The spectra is obtained by applying an RF pulse and measuring the intensity of the free induction decay at a single point at a fixed acquisition delay. The RF frequency is swept generating the NMR spectra. The unit also includes a 16 bit digital to analog converter which is used to control the superconducting sweep coil.
A static water sample in a 2.2 mm capillary is used as the sample for a field lock signal. The sample is located beneath a cryostat that houses the standard NMR probe but is still in the homogeneous region of the field, figure 7.1
Figure 7.1 Adapted from reference 22. Schematic illustrates the placement of the field lock probe, the cryostat(not
shown) sits directly above the field lock probe.
In order to record the signal over +/- .5 T it is desirable to use a broadband probe. Previous designs required continual tuning over the range of the sweep (23). The circuit as well as a tuning profile and representative spectra are reported in figure 7.2
A -4 ..16 .20 170 200 230, 200 Frequency [MHzJ B C C-2 4 0 1 2
Figure 7.2: Adapted from reference 22. (A) Reflected power of the tuned probe over a range of 110 MHz. (B) Circuit design of the lock probe consisting of a rf-coil L (7 turns, copper, AWG 16), resistor Ri (1.8 kX) in parallel with the rf-coil, resistor R2 (50
X) and two variable capacitors Ci and C2 (each 2-8 pF). (C) Proton signal of the water sample.
The sweep coil power supply is connected to the digital to analog converter of the FMU. The sweep coil current is controlled by a voltage from +/- 10 V.
The field is set using a custom program running in an environment provided by the FMU. The user firsts locates the current field position using an automated program that locates the lock signal. The user then enters the desired field strength or proton frequency. The software uses the FMU to move the field in 50 KHz steps after each step the FMU records a spectra to ensure the field has moved to the correct position. Once the field is within 50 KHz a proportional control algorithm is used. The program terminates when the field is within 500 Hz of the desired position.
APPENDIX A
Gyrotron Control System
This collection of LabView programs is designed to control any of the gyrotron systems without any serious modification. Only one VI needs to be modified when moving the software between the different systems. To achieve this portability I have tried to include any and all features that are used in the varying systems. As a result there may be unused indicators or variables on a given system.
The control system is composed of 10 main VI's. 1) Control and Graphing
2) Calibration and Conversion 3) DAQ Control 4) Data Logging 5) Heater Control 6) PID 7) Signal Filtering 8) Start 9) System Status 10) Pulse Generation
Which contain the sub VI's 1) Average Integration 2) MC AI Conversion
3) MC AO Conversion 4) MC DAQ AI
5) MC DAQ AO 6) Step Value 7) TerraNova
There is one Global Variable VI called global.vi which allows for viewing and controlling all parameters during operation but should not be used under normal operation.
To transfer the control software to a new system the only VI that should need to be altered in any way is the DAQ Control VI. The only other vi that MAY be changed is the Control and Graphing VI. The only alterations that can be made are what parameters are graphed and the layout of the screen. ANY functional change to this VI must be made in the master copy of the software and then distributed to the other users.
Main VI's
Control and Graphing.VI
This is the only VI whose front panel is necessary during normal operation. This is where you control all variables which are normally adjusted during operation. This is also where data is graphed and displayed. From this VI you can control
1) HV on/off 2) Heater 3) PID
4) Gun coil
5) HV setting 6) Trigger method
The main indicators for this VI are 1) Heater 2) Pressure 3) MW Power 4) Beam Current 5) Body Current 6) System Status 7) Gun Coil Current
This VI is mostly just the interface. This VI reads and writes from the Global variable file. This VI does participate in the safety controls as will be discussed later.
Calibration and Conversion
Most of the measured signals need to be converted to arrive at their actual value. All incoming voltage signals are converted from raw voltages to there values in this VI. In some cases it is a simple scaling factor in others it requires an equation of some sort. These conversions have been set to have the greatest flexibility when moving between systems. This flexibility may require setting some conversion constants or factors to 1 or 0 which may seem unnecessary but is required to allow for the same software to be used on all systems.
For example if on one system the temperature conversion is T=factor*Voltage+constant but on another it is just T=factor*Voltage the value of the constant must still be entered as 0.
With the exception of the TerraNova(and the future Spellman power supply) pump controllers all conversions from raw data to final data should be done in this VI and not in the DAQ control VI. In the case of the terra nova the data is read as a string, the string is converted to numbers in the TerraNova VI these converted numbers are then converted in the Calibration and Conversion Vi.
DAQ Control
This VI sends and receives signals from the hardware. These signals are either voltages or other communications such as RS-232.
For outgoing signals this VI reads the output value from a global variable and sends it to the corresponding AO/DO or communication device.
For incoming signals it reads the values and sends them to the calibration and conversion VI. The only other necessary function of this VI may be to extract the correct value out of an array. This is necessary if MAX is used record voltages. All measured voltages are output in one array and it is necessary to dissemble this array to read each individually.
All control signals are sent from this VI with the exception of pulses on the 140 GHz system when set to "Pulsed" triggering method.
When using RNMR as the triggering method this VI reads a Boolean value from RNMR and sets the HV Inhibit on/off in response to this.
Data Logging
This VI creates and writes a log file for the gyrotron. The name and location is determined by the "Data Logging, Base File Name" variable + the date and time when the first data point is written. For example if the "Data Logging, Base File Name" is given as
C:\Users\140ghz\Desktop\Gyrotron Contols\LabView Data\l40GyrotronLog then the file name would be
C:\Users\l40ghz\Desktop\Gyrotron Contols\LabView Data\140GyrotronLog_08-04-10 1405
with the first data point being written at 2:05 pm April 10, 2008. The complete file name of the current log file is displayed in the "Data Logging, File Name" variable.
This VI writes one data point to the log file on each execution. The VI is run in a loop. Therefore the spacing between data points is determined by how fast the loop is run. This is determined by the global variable "Data Logging, Seconds in between data points". This number is converted into milliseconds and sent to the wait timer.
To change the data that is recorded in the log file; simply add or remove nodes from the "merge signals" icon on the block diagram. The uppermost node is the 2nd
column in the log file the 1st is the time, the bottom most node is the last column in the
log file.
Heater Control
This VI controls the heater. It generates the ramp for raising and lowering the heater. This program takes the desired heater value, scales by "Heater Scale Factor" checks to see if it is within predefined limits specified by the "Heater Upper Limit" and
"Heater Lower Limit" global variables. If it is it sends the desired value to the Step Value VI, this VI either raises or lowers the value by a step size every time it is called. The new value is then sent to the heater.
The heater step size may have different values when the PID Controller is enabled or disabled. These are specified in the "Heater Step Size" and "PID Heater Step Size" global variables.
The resulting value after the step value VI is coerced to be in range of the global variables "DAQ card upper limit" and "DAQ card lower limit" if a value outside of these were to be sent to the daq card LabView stops with an error.
PID
This VI calculates the difference between the desired value and the actual value of the selected variable. It calculates the difference between two spaced by your choosing which gives the derivative. It also calculates the integral of the error using the sub VI Average_Integration. The difference, derivative, and Integral are then multiplied by the constants PID P, PID D, PID I respectively, these new values are added together to create the PID Correction Factor. When the PID Controller is enabled this correction factor is added to the current heater setting. When the PID Controller is disabled it continues to calculate the correction factor it is just not used.
Signal Filtering
This VI takes the "MW Power" variable uses the LabView Filter express VI. and outputs the "MW Power, Filtered" variable. It also has a Filter On/Off variable controlled
through the global variable file. When the filter is set to off the "MW Power" variable is fed directly to the "MW Power, Filtered" variable.
This VI currently only filters the MW power however filtering any other signal can be accomplished by creating a "X, Filtered" global file and copying the Filter VI and wiring it the same as the MW Power.
Start
This VI starts all the necessary VI's. It is also the master timer for all of the sub VI's. When this VI is started several VI's are started. The Data Logging, Calibration and Conversion, DAQ control and Pulse Generation VI's are all initiated. These VI's are all controlled by there own loops. There loop rate is controlled by the "DAQ rep Time" Global variable. These VI's are outside of the main loop.
At this time the system is recording, converting, and saving data the log file. That is all. No other functions can be stated until the "Enable Controls" button is pressed. This button changes the case structure to the "true" state and calls the other VI's. The remaining VI's. PID, Heater control, System Status, Signal Filtering, Control and Graphs, Gun coil, do not have there own loops. These VI's are executed once each time the Start VI loops. The controls will remain enabled until one of three events occurs. The "Turn on Time" is set to a time in the future, the "shutdown gyrotron" button is pressed or the "stop control system" button is pressed. These will be explained in another section.
System Status
This VI monitors certain variables and checks that they are in an acceptable range. These Boolean T/F are then combined with an AND function. If any ONE of the variable
is out of range the system status is FALSE. This triggers the software interlock. This either sets the HV to 0(on the 250) or disable the HV (on the 140).
Because the different systems have different HW I haven't yet found an intuitive way to reflect this in this VI. Currently there is a Boolean switch in this VI which must be switched to allow for the inclusion of HW devices that are not present on all the systems.
Pulse Generation
This VI generates a pulse train that is used to switch the HV inhibit on/off. This VI takes the inputs of Pulse length and duty cycle and generates a pulse train. This VI controls the daq channel for the HV supply when active, usually this channel is controlled by the DAQ Control VI. This VI is specific to the 140 GHz system and would have to be modified to support pulsing on another HW system.
Sub VI's
Average_Integration
This VI creates an array whose size is determined by the "seconds of integration/average" as well as the loop time input. The VI calculates how many loops are in the given number of seconds and generates an array with that size by adding one new element on each iteration of the loop until it is reached. Once the sized is reached the newest value is added to the end while first element is deleted. This creates a rolling array. When the Boolean is set to Integration the VI adds all elements in the array and outputs that value. When Average is selected it adds the elements and then divides by the number of elements. When Derivative is selected it Subtracts the oldest element from the newest element.
Step Value
This VI increments the output value towards the desired value by the step size each time it is called. The speed at which it reaches the desired value is determined by the step size as well as speed of the loop that it is inside of.
TerraNova
This VI communicates with a TerraNova controller through RS-232 a connection. This VI outputs the pump voltage, current, and reported pressure. This VI converts the strings sent by the terranova into numbers. This was used instead of Instrument I/O assistant because of strange behavior encountered using the assistant.
Safety features
The control system includes several software safety systems. These are mainly based off of the "system status" global variable but where the action taken occurs may vary.
If at any point if the global variable "system status" becomes false several things happen. The HV gets turned off in two ways. The "HV ON" value is set to false and the "HV, HV Setting KV" gets set to 0. Both locations must be turned off as the 140 GHz only uses the "HV ON" button and the 250 GHz only uses the "HV,HV Setting KV variable". These setting will NOT reset automatically when the "system status" becomes true again.
Any variable that is monitored by the System status VI. may trip the safety system. The set points for the monitored variables are located in the global variables file.
The safety system will also be tripped if the "Turn on Time" variable is set to a future time.
PID Controls
To fully operate the PID controller 7 variables must be input. 1) Time between points for derivative
2) Time of integration 3) P constant 4) I constant 5) D constant 6) Control Variable 7) Desired value
The time between points for the derivative is set by default to 1 and can only be changed in the PID VI. This should not be changed. The time of integration is set in seconds and can be set from the global variable file as the P, I, and D constants. The control variable is the process which you would like to control currently the MW power or beam current. The desired value is the value you want to maintain.
There is a Plot PID VI which will plot the values of the actual output, the desired output, the difference between the two, the derivative and the integral this may be useful for determining the correct values for the PID constants.
The PID controls can not be activated unless the "HV On" button is pressed. When this is depressed the PID controls are stopped and the heater is
Shutdown Gyrotron / Stop control system
The "Shutdown gyrotron" button will set the values for the heater and gun coil to 0. When both values are 0 the program will begin recording data and not allow user control until the "enable controls" button is pressed again.
The Stop control system button does the same as above except when the values are 0 it exits and stops the VI.
APPENDIX B
140 GHz Gyrotron Operation
140 GHz Gyrotron 1) Start the program and Heater
1) Start LabView vi "Start.vi", this starts all necessary vi's in the background and opens the main control panel.
2) In the "Set Heater" input type the desired heater voltage 3) Wait for heater to reach desired value and wait .5-3 hours 2) Set up the HW
1) Turn on both the cavity and gun coil chillers. 2) Turn on the Gun Coil power Supply
3) Set the gun coil using the control program. Current value is ~80. This should also be displayed on the voltmeter.
4) Turn the Spellman control power on 5) Set Spellman voltage dial to 0
6) Check that the "HV On" button in the LabView program is not pressed. 6) Turn Spellman high voltage on
3) Turn on the beam
1) Select CW or Pulsed or RNMR
2) If using Pulsed mode set duty cycle and pulse length (default is 100, 1) 3) Set the Spellman High Voltage to 194-197 (12.2 KV) on the dial
4) Press "HV On" in the LabView program (If using RNMR no response will occur unless triggered by RNMR on gate AUX 6)
5) If "Current Control" is lit on the Spellman reduce the heater slowly until "Voltage Control" is lit
6) Monitor body current and pressure. If pressure continues to rise or there is body current adjust the gun coil slightly. Continue to adjust the gun coil until there is minimal body current and the pressure is stable or falling.
4) Control the beam (not applicable to Pulsed or RNMR modes, yet)
1) Once the beam is on select "MW Power" from PID Control Selection 2) Set the desired MW Power
3) Press the PID button to initiate control
APPENDIX C
400 MHz DNP Probe
This probe is based on a previous probe designed for 380 MHz. This probe has several unique features and new design elements. Several new design elements are illustrated in figure 1. The drive and bearing transfer lines are built from G-10, previous designs have used vacuum jacked steel or copper transfer lines. The use of G-10 should reduce RF interference which is specifically a problem for the carbon channel as the FM radio band occurs at the same frequencies of interest. The RF transmission line is also constructed from two materials. The lower half of the transmission line is constructed from stainless steel. This is used as a thermal break to isolate the cryogenic sample region from room temperature reducing the necessary cooling power. Also the thermal break helps maintain the RF circuitry in the probe box at room temperature. The tuning and matching capacitors used have a thermal dependence and stable temperatures are required for prolonged use. To improve the conductivity of the stainless steel it is coated with 0.0005 and 0.00005 inches of silver and gold respectively.
Due to constraints of the waveguide from the gyrotron to the probe the microwaves are delivered through the bottom of the probe. Design of the mating the waveguide with the probe is discussed below.
Figure 1: 1) Vacuum jacketed drive and bearing gas inlets 2) Nitrogen matching and tuning capacitors 3) Gas exhaust outlet 4) G-10 drive and bearing gas transfer lines 5) Magic angle adjustment rod 6)
Waveguide miter for microwave delivery 7) Stator 8) Outer RF transmission line; top half copper bottom half stainless steel coated with gold and silver to improve conductivity.
The top of the probe is illustrated in figure 2. One unique design feature of this probe is the sample eject system. This system was developed by Alexander Barnes. This system uses pressurized gas to eject the rotor through the housing shown and to the top of the magnet. This allows for the changing of samples without requiring repeated warming and cooling of the probe.
The RF transmission line is offset from the center of the sample. As the inner conductor of the RF transmission line is also the waveguide this offset requires only one miter bend to allow for the microwaves to be launched perpendicular to the sample. This probe will be used in conjunction with another probe which has the microwave waveguide centered under the sample. This requires that there be two lengths of
Figure 2: 1) Magic angle adjustment rod 2) Solenoid RF coil 3) Sample eject housing 4) Mirrored miter bend for microwave delivery 5) Copper inner conductor of RF transmission line, corrugated for use as the microwave transmission line, offset by .518 in from the sample center 6) Copper outer conductor of RF transmission line
Figure 3: 1) Proton channel matching and tuning capacitors 2) Waveguide taper to inner conductor of the RF transmission line 3) Coaxial transmission lines 4) Carbon channel matching and tuning capacitors 5) RF frequency filter 6) Nitrogen channel matching and tuning capacitors 7) Exhaust gas outlet 8) Vacuum jacketed drive and bearing gas inlets 9) Magic angle adjustment knob
Figure 4 illustrates the mating of the waveguide from the gyrotron to the inner conductor of the RF transmission line. The waveguide must be tapered from 8 mm (.315 in) to .215 in. Longer tapers have higher transmission efficiencies. However, corrugations can only be applies to 3 in segments at a time. This consideration necessitates the use of a short joining piece of wave guide labeled 4 in figure 3. Empirically it has been observed that minor gaps in the waveguide may improve microwave transmission. This is believed to be because the gap may destroy higher order modes that contaminate the desired transmission mode. This junction allows for minor adjustments of the spacing between pieces of waveguide.
Figure 4: 1) Inner conductor of RF transmission line, also corrugated for use as the microwave
transmission line. 2) Outer conductor of RF transmission line 3) Mating jacket to allow for minor vertical adjustments of the waveguide 4) Small waveguide section to mate the inner conductor to the waveguide taper 5) Waveguide taper from .315 to .215 in 6) Drive and bearing gas transfer line 7) Nitrogen channel capacitors 8) Flexible shaft for magic angle adjustment 9) Gas exhaust