Dynamics of Endovascular Stent Expansion
by James C. Squire
B.S., United States Military Academy (1989)
M.S., Massachusetts Institute of Technology (1996)
Submitted to the
Department of Electrical Engineering and Computer Science in partial fulfillment of the requirements for the degree of
DOCTOR OF PHILOSOPHY
at the
MASSACHUSETTS INSTITUTE OF TECHNOLOGY July 2000
C2000
Massachusetts Institute of Technology All rights reserved/2
Author
Department of Electrical Engineering and Computer Science July 19, 2000
Certified
by-Elazer R. Edelman T s D. and Viginia W. Cabot Professor
-Tbesis Supervisor
Accepted by
Arthur C. Smith Chairman, Committee on Graduate Students Department of Electrical Engineering and Computer Science
MASSACHUSETTS INSTITUTE OF TECHNOLOGY
OCT 2 3 2000
1ARKER
Dynamics of Endovascular Stent
Expansion
by James C. Squire
Submitted to the Department of Electrical Engineering and Computer Science on July 19, 2000, in partial fulfillment of the requirements for the degree of Doctor of Philosophy in Electrical Engineering and Computer Science.
Abstract
Advances in prosthetic science and engineering have spurred the rapid development of many new permanent implants such as arterial reinforcement grafts, venous filters, hepatic pressure shunts, vascular embolization coils, myocardial perforation-sealing "clamshells", and stents that strengthen and scaffold the biliary duct, urethra, veins, and arteries. Typically, these devices are attached to a delivery catheter and threaded to the site of interest where they are expanded. The very nature of the remote delivery systems make the mechanical details of implantation difficult to ascertain, yet this is important to quantify since there may be a link between how the devices are emplaced and the body's acute and chronic response. This thesis examines the hypothesis that the responses to implants are influenced by the manner in which the implants are placed within the body. Endovascular stents provide an ideal medium to examine this hypothesis as they 1) provoke a well-documented but incompletely-understood acute and chronic response (thrombosis and neointimal hyperplasia, respectively) 2) take issues of strain to extremes, which has been linked with hyperplasia, and 3) employ a regular geometry amenable to modeling.
Thesis supervisor: Elazer R. Edelman
Thomas D. and Virginia W. Cabot Professor of Health Sciences and Technology
Acknowledgments
It's only appropriate that acknowledgements traditionally are placed at the physical beginning of the work, yet written at the temporal end. The most important support, advice, and encouragement is that given at the beginning when the future is uncertain and can only be appreciated in hindsight. Mom, Dad: thanks for giving me your unconditional love and support no matter what fool idea I follow, whether it leads to a career as an Army officer, high school teacher, or engineering professor: I'd have given up long ago if I thought the difference really mattered.
Acknowledgments by their very nature tend to engender some suspicion...were the people really that good? I've worked with many people over several careers, and can assure the reader, yes, these men and women are exceptional, even by MIT's standards.
To Elazer: thank you for demonstrating the same qualities of integrity, faith, fascination, and perseverance that frequently blur the line between your roles as advisor, scientist, and teacher. You have a more positive influence on people than you realize. Steve Bums: You are an ideal teacher of teachers; you have taught me that a blend of faith in the student, genuine interest in the material, and compassion are far more important than board technique. Campbell: your 6lan and grace under fire is inspiring. If my diet doesn't improve I'm keeping your business card in my wallet. Martha: you have guided my graduate career from start to finish. Thanks for your advice and encouragement over the years, and for knowing when to dispense each. And Prof. Senturia I am indebted to your farsighted advice, both concerning this research and my career.
I would like to thank my fellow students and post-docs in Elazer's lab for the fellowship that comes not just with the Friday after work happy hours but also with the
late-night-and-the-computer's-bluescreened-and-the-staining-didn't-take-again unhappy hours as well. Dave Ettenson and Dave Wu, two of the nicest guys I know, have helped me to no end. Yoram, who isn't at all hurt by not being named the nicest guy I know, is the lab's only hope for someone whom can regularly beat Elazer at squash-I tried.. I firmly believe one day I'll see the comedy and music of Cooper as host of the Tonight Show, and expect he will probably still be poking fun at the Canadians. My running partners Henry and Adam, and squash partner Yi have worked hard with me to the grad-student gut at bay, while equally-regular buffets
with Gowri, Tim, Elizabeth, and Vishal threatened to put it back on. My old office was next to Tim's, and had I not moved I'd probably still be solving his paradox puzzles.
Frank: Buddy, our frequent talks and short-notice but much-needed vacations kept me mostly sane throughout. If nothing else works out, Virginia could use a few Starbucks franchises. To my "other" Mom and Dad: thanks for your valiant efforts to keep me appropriately dressed throughout my graduate student days. The fashion police tickets I've accumulated only reflect the need for the folks who make Dockers and Geranimals to talk.
Most of all my thanks and love to Laura, who intimately knows both the joys and sacrifices that have accompanied this path. We pushed/pulled each other through this, and this thesis is a product of both our dreams. I thank the Lord we both know this is a journey, because were it an end I would have no way to repay all those who invested in me their time, money, and selves.
This thesis is dedicated to the memory of my father, James Lewis Squire, Jr.
Patents
Work on this thesis has yielded two prototypes of improved stent-delivery balloon catheters, and their descriptions were filed in two preliminary patents with the U.S. Patent Office on May 12, 1998. These patents have been reviewed and have been assigned provisional patent numbers 60,985,098 and 60,085,097. These are available for licensure through the M.I.T. Technology Licensing Office, Room
NE25-230, Cambridge MA 02139. Two additional disclosures have
been submitted describing improved methods for stent/balloon placement prior to crimping, and a stent geometry that minimizes acute arterial injury imparted during expansion.
Table of Contents
Acknowledgments ... 4 Patents ... 6 Table of Contents... 7 Table of Figures ... 10 CHAPTER 1 Introduction ... 13 1.1 Aims of research ... 131.2 W hat are endovascular stents? ... .. .. . .. .. .. .. . .. .. .. . . . 14
1.3 Complications: why 30% of interventions fail... 15
1.4 Mechanical basis of arterial injury ... 19
1.4.1 Why investigate the mechanical basis for arterial injury? ... 19
1.4.2 Mechanical arterial injury: during stent insertion ... 20
1.4.3 Mechanical arterial injury: during stent expansion ... 20
1.4.4 Mechanical arterial injury: chronic ... 21
1.5 Arterial injury caused during device emplacement... 22
1.6 Thesis objective and organization... 22
CHAPTER 2 Measuring Arterial Strain ... 25
2.1 Introduction... 25
2.2 Methods... 26
2.2.1 Experimental...26
2.2.2 Analytical... 29
2.3 Results... 30
2.3.1 In vitro artery segment ... 30
2.3.2 Latex phantom...33
2.3.3 In vivo artery ... 34
2.4 Discussion ... 36
2.4.1 Approaches to measuring strain in biologic materials ... 36
2.4.2 Error analysis ... 37
2.5 Conclusions... 39
CHAPTER 3 Transient Macroscopic Expansion:
Characterization and Control... 41
3.1 Introduction... 41
3.1.1 Chapter organization... 43
3.2 Stent expansion characteristics - Materials and methods ... 44
3.2.1 Overview of experiments ... 44
3.2.2 Strain determination... 44
3.2.3 Chronic response... 45
3.3 Stent expansion characteristics - Results... 46
3.4 Stent expansion characteristics - Discussion ... 50
3.4.1 Sequence of events during stent expansion...50
3.4.2 Causes of axial contraction in the stent and artery ... 51
3.4.3 Other observations: symmetry, torsion, placement injury...51
3.4.4 Designing a less injurious stent... 52
3.5 Control of stent expansion - Materials and methods... 53
3.5.1 Overview... 53
3.5.2 Quantifying endothelial denudation... 55
3.6 Control of stent expansion - Results... 56
3.7 Control of stent expansion -Discussion... 60
3.7.1 Transient endflare can be controlled ... 60
3.7.2 Maximum endflare is correlated with acute vascular injury ... 60
3.7.3 Device optimization ... 61
3.8 Conclusions... 62
CHAPTER 4 Intrastrut Expansion Characteristics ... 63
4.1 Introduction... 63
4.1.1 Chapter organization... 65
4.2 In-plane strain - Materials and methods ... 66
4.2.1 Analytic... 66
4.2.2 Experimental...66
4.3 In-plane strain - Results... 67
4.4 In-plane strain - Discussion... 72
4.4.1 Simplified strain model results...72
4.4.2 Three dimensional model... 72
4.4.3 Experimental confirmation... 73
4.4.4 Validity of model assumptions...74
4.5 Balloon-device interaction - Materials and methods ... 75
4.5.1 Analytical... 75
4.5.2 Experimental...75
4.6 Balloon-device interaction - Results... 77
4.7 Balloon-device interaction - Discussion... 85
4.7.1 Hypothesis... 85
4.7.2 Validity of model assumptions...85
4.7.3 Comparison of simulations and experiments ... 86
4.7.4 Alternative hypothesis... 88
4.8 Conclusions... 89
CHAPTER 5 Conclusions... 91
5.1 Specific findings and summary ... 91
5.2 General findings and recommendations ... 93
5.3 Future work... 93
5.4 Final thoughts... 94
APPENDix A Macroscopic strain analysis code ... 95
A. 1 Analysis procedures summary... 95
A.2 Display procedures summary ... 95
A.3 Code ... 96
APPENDEx B Evan's blue staining protocol ... 123
APPENDEX C Intrastrut strain analysis code ... 125
C.
1
Analysis procedures summary...125C.2 Intrastrut strain code... 127
References...147
Table of Figures
CHAPTER 1: Introduction
1.1 Diseased human coronary with atheroma... 14
1.2 A stainless steel endovascular stent... 15
1.3 Porcine coronary artery wit neointimal hyperplasia... 17
1.4 Schematic cross section of a healthy and diseased artery... 17
1.5 Angiograms showing progress of restenosis ... 18
1.6 Stented human saphenous vein graft ... 19
1.7 Surface strain tensor in cylindrical coordinates... 21
CHAPTER 2: Measuring Arterial Strains 2.1 Diagram of strain measuring system... 25
2.2 Schematic diagram of speckler electronics ... 26
2.3 In vivo feasibility system ... 27
2.4 Arterial surface strain tensor at two atmospheres... 30
2.5 Arterial surface strain tensor at four atmospheres... 30
2.6 Arterial surface strain tensor at six atmospheres... 31
2.7 Arterial surface strain tensor at eight atmospheres... 31
2.8 Strain measuring system accuracy ... 32
2.9 Ink jet marking results in vivo ... 34
2.10 Strain measuring system works in vivo ... 34
CHAPTER 3: Macroscopic Expansion Characteristics 3.1 Arterial injury post-stenting: AgNO3 histology... 42
3.2 In vivo arterial strain at 2 atm... 45
3.3 In vivo arterial strain at 4 atm... 45
3.4 In vivo arterial strain at 6 atm... 46
3.5 In vivo arterial strain at 8 atm... 46
3.6 Endflare vs. axial contraction... 47
3.7 Maximum strain vs. neointimal hyperplasia... 48
3.8 Sequence of stent expansion... 48
3.9 Comparison of maximum endflare and strain ... 54
3.10 Sequence of stent expansion: variable geometry stent ... 55
3.11 Evan's blue histology ... 56
3.12 Comparison of endflare across 4 stent/balloon systems... 56
3.13 Relationship between maximum endflare and denudation... 57
CHAPTER 4: Intrastrut Expansion Characteristics 4.1 Intrastrut geometries and corresponding acute injuries ... 62
4.2 Vascular in-plane strain: 2D model...65
4.3 The three dimensional intrastrut cell...66
4.4 Vascular in-plane strain: 3D model, principle strains ... 67
4.5 Vascular in-plane strain: 3D model, vonMises strain... 68
4.6 vonMises 3D in-plane in the overexpanded stent...68
4.7 Vascular in-plane strains: experimental photomicrograph... 69
4.8 Vascular in-plane strains: experimental analysis... 69
4.9 Slotted tube stent: balloon/artery interaction... 76
4.10 Corrugated ring stent: balloon/artery interaction... 77
4.11 Delta wing stent: balloon/artery interaction ... 78
4.12 Relationship between strut thickness and expected ... 79
4.13 Conforming slotted tube model... 80
4.14 Comparison of conforming and regular slotted tube stent... 81
4.15 Balloon protrusion... 82
4.16 Vessel wall compression ... 84
CHAPTER
1
Introduction
1.1
Aims of research
Advances in prosthetic science and engineering have spurred the rapid development of many new permanent implants such as arterial reinforcement grafts, venous filters, hepatic pressure shunts, vascular embolization coils, myocardial septal defect closure devices, and hollow cylindrical stents that strengthen and scaffold the biliary duct, urethra, veins, and arteries against collapse and closure. Typically, these stents are attached to a delivery catheter and threaded to the site of interest where they are expanded. The very nature of the remote delivery systems make the mechanical details of implantation difficult to ascertain, yet this is important to quantify since there may be a link between how the devices are placed and the body's acute and chronic response.
This thesis examines the hypothesis that the acute and chronic responses to implants are influenced by the manner in which the implants are placed within the body. Endovascular stents provide an ideal medium to examine this hypothesis as they 1) provoke a well-documented but incompletely-understood acute and chronic response (thrombosis and neointimal hyperplasia, respectively) 2) impart extreme deformations to the arterial wall, which has been linked with hyperplasia [1,2,3,4,5], and
3) employ a regular geometry amenable to modeling.
This work has three specific aims:
1. Characterize the manner in which endovascular implants expand in arteries by quantifying the strain tensor they impose on the arterial surface as a function of both location and time
2. Determine whether different types of expansion cause different types of vascular injury
3
3. Determine whether one can modify stents and their expansion characteristics to reduce vascular injuriesChapter 1: Introduction 13
1.2
What are endovascular stents?
Ischemic heart disease, the end result of reduced flow through narrowed atherosclerotic coronary arteries (Figure 1.1), is the leading cause of mortality in the world; it affects more than 58 million Americans and is responsible for 41.5% of all deaths in the United States [6]. Currently, the two most common procedures for patients that do not respond adequately to purely pharmacologic therapy are percutaneous transluminal coronary balloon angioplasty (PCTA) and coronary artery bypass grafting (CABG). The frequent lack of long-term efficacy of these techniques and the physical toll associated with major coronary surgery have prompted the search for new technologies, including laser angioplasty, atherectomy, and implanted endovascular scaffolding devices called stents. Of these, stents are rapidly gaining the lion's share of the vascular intervention market because of their high initial success rate, minimally invasive nature, and improved long term effectiveness. In 1995 approximately 100,000 patients in the United States received stents [7]; by the end of 2000 the annual number of stenting procedures is expected to exceed the number of angioplasty procedures (currently 900,000 worldwide) [8].
- adventitia
intimal boundary thrombus
lipid pool! fibrous tissue & cholesterol clefts Smooth musclecel S
media necrotic tissue
Figure 1.
1:
A diseased human coronary artery with an advanced complicated atheroma. The lightly stained collar of concentric elastic lamella that forms the media is clearly visible at this100x
magnification. In a healthy artery these cells regulate local vessel tone and blood flow by contracting or relaxing leading to constriction or dilation of the artery, however now they have undergone phenotypic transformation from a contractile state to a synthetic or proliferative state. In place of tone regulation they now grow and stimulate further growth. Before the onset of atherosclerosis, the media was lined with a thin intima that bounded the lumen. In this artery the intima is occupied by a hyperplastic mass of smooth muscle cells, necrotic debris, a lipid pool, cholesterol clefts, and organized thrombus that has reduced the luminal area by 85%.Chapter 1: Introduction 14
Endovascular stents are expandable tubes 6 mm to 60 mm in length and 2 mm to 10 mm in diameter most commonly made from stainless steel and the nickel-titanium alloy nitinol, although tantalum [9], platinum [9], plastic [10], and biodegradable materials [11, 12] have also been used. In a compressed state the stent is mounted on a catheter and threaded through the vascular tree to a site of narrowing. The stent is next enlarged in diameter approximately 50%, either by a spring-like recoil into their naturally expanded shape (nitinol) or by plastic deformation under the influence of a cylindrical balloon inflated within the stent to 8-20 atmospheres (atm) of pressure. Once the catheter is withdrawn the stent is left as a permanent implant within the artery (Figure 1.2). *
1.3 Complications: why 30% of interventions fail
Despite many recent advances in stent designs and delivery systems,failure to achieve adequate vessel perfusion at three months is still not achieved in approximately one-third of patients [13]. There are four
Chapter 1: Introduction 15
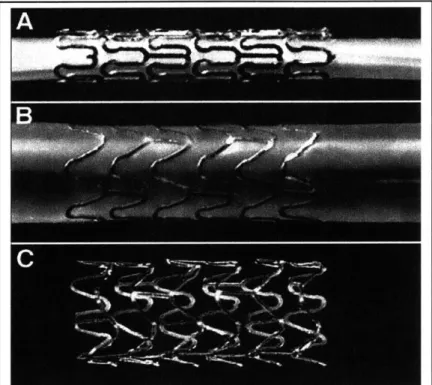
Figure 1.2: A stainless steel stent mounted upon a balloon catheter (A) before and (B) after balloon inflation, and (C) after balloon withdrawal.
15 Chapter 1: Introduction
distinct periods during which failure may occur, each with its own characteristic pathology: procedural, acute (0-several hours), subacute (1-14 days), and chronic (3+ weeks).
Procedural complications arise from the failure to place the stent correctly. The endovascular stent is delivered through more than one meter of tortuous vasculature using a series of coaxial guidewires, catheters, and guide catheters, and often must be emplaced with
1
mm accuracy. Early stenting procedures were hampered by problems such as slippage of the stent during delivery and imprecise positioning, however improvements in delivery systems have made these failures rare.Acute failures occur immediately postoperatively, and are caused by either disorganized thrombus or more commonly delamination of the plaque lining the vascular wall next to the stent [14]. Blood is driven between the plaque and the wall, causing further dissection, and possible obstruction of the lumen. Such dissections may be tacked up against the vessel wall with a second stent while the patient is still in the catheterization laboratory.
Subacute failures are caused by an accumulation of organized thrombus in the vicinity of the stent from
1 to 14 days postoperatively, and in the
early 1990's were a leading cause of stent failure occurring in 5-12% of cases. Although the clotting cascade in response to vascular injury has been extensively studied, it is not clear what the precise nature of the stent-imposed injury is. Endothelial denudation [15], tearing of the elastic lamina [4], tensile strain [16], and changes in the blood shear force caused by turbulence [17,18] have all been observed to occur post-stenting; their roles in initiating thrombosis is the target of current research efforts [for an overview, 19]. Despite these uncertainties, improvements in both pharmacologic treatment and clinical techniques have reduced subacute thrombosis rates six-fold to less than 1% [20,21], making this also a minor contribution to overall stent failure.The primary failure mode of stenting occurs several weeks after implantation. The permanent addition of a stent to the arterial wall frequently induces a persistent and aggressive vascular response causing nearly 1/3 of stented patients to require further intervention within six months [13] to restore patency after thrombosis, fibrosis, and rapidly proliferating smooth muscle cells progressively occlude the lumen (neointimal hyperplasia) (Figure 1.3). Unlike acute complications, this reaction has not been greatly reduced by refinements to the implantation procedure. The biological underpinnings of vascular response to injury are complex and include platelet aggregation, monocyte infiltration, and change in smooth muscle cell phenotype [5] (Figure 1.4). Despite continued investigation into the biological causes and remedies, restenosis from the combined effects of neointimal hyperplasia, medial degeneration, and vascular remodeling remains an unsolved problem in modem interventional cardiology.
16 Chapter 1: Introduction
Figure 1.3: Pig coronary artery 3 days (A) and (B) 28 days after stenting. Smooth muscle cells have begun to migrate and proliferate in response to stent placement. The decrease in luminal area from intimal hyperplasia is highlighted. This hyperplasia often progresses, restenosing the stented vessel.
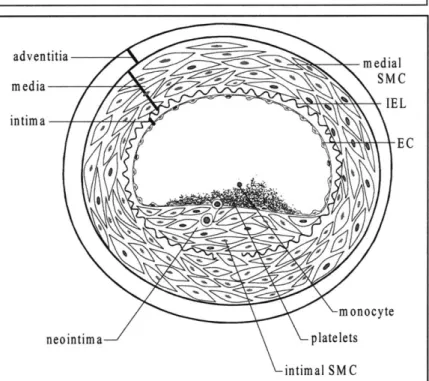
adventitia d IE L intima E C m onocyte neointima platelets intimal SM C
Figure 1.4: The upper portion of this figure shows a cross-section of a healthy artery. The endothelial cell (EC) monolayer rests upon basement membrane covering the internal elastic lamina
(TEL). The media is composed of smooth muscle cells (SMC). After EC injury (bottom), platelets are adhering to the exposed thrombogenic surface of the vessel wall and are attracting monocytes, and SMC have begun to proliferate and migrate through the IEL to form a neointima.
Chapter
1:Introduction
17
A
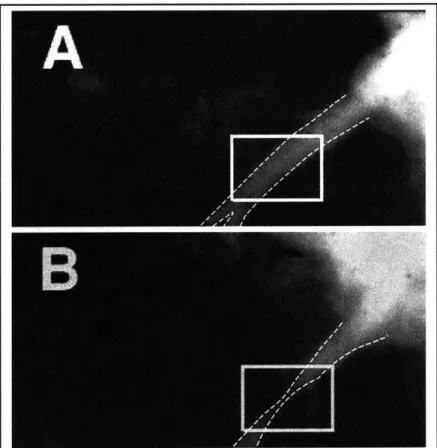
In summary, a typical advanced human coronary artery lesion, such as shown in Figure 1.1, is comprised of a heterogeneous mass of calcified plaque, fatty atheroma, lipid pools, and necrotic debris that has developed over the course of many decades. An endovascular stent implanted into such a lesion may provide excellent acute postoperative results as shown in the angiography of a left anterior descending coronary artery (Panel A, Figure 1.5). However the vascular response to the stent reduces the initial gain in luminal area, as shown in Panel B taken three months later. In both angiograms the stented region is boxed. The stainless steel stent itself cannot be seen as it is not sufficiently radio-opaque. A postmortem cross section of a stented human coronary with extensive hyperplasia is shown in Figure 1.6.
18
Chapter 1: Introduction
Figure 1.5: Angiograms showing the progression of restenosis in a porcine left anterior descending (LAD) coronary artery immediately after stenting (A) and 3 months post-operatively (B). Radio-opaque contrast dye has been injected into the coronary and appears as white or light gray. The artery is outlined in white and its narrowing is visible in the boxed area of B.
Chapter 1: Introduction 18
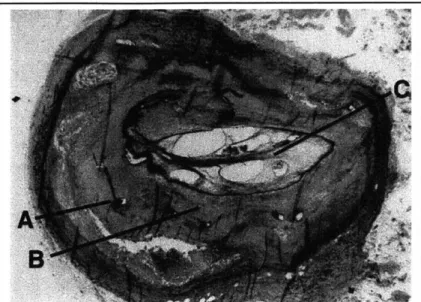
Figure 1.6: Human saphenous vein graft after stenting with strut legs (A), neointima (B), and lumen (C) partially occluded with postmortem thrombus. The prestenting lumen of this diseased
vessel is marked by the light grey collar surrounded by the struts. The struts are deeply embedded in a matrix of intimal smooth muscle cells formed after the stent deployment.
1.4
Mechanical basis of arterial injury
1.4.1 Why investigate the mechanical basis for arterial injury?
The desire to understand and limit the most common mode of stenting failure-chronic restenosis-must include an understanding of the mechanical basis of arterial injury. A purely biological approach is inadequate because the cellular signal transduction mechanisms that regulate the response to injury are not fully understood, and it is difficult to find an adequate animal model of human restenosis in which to perform experiments. Although many mammalian vessels do respond to injury with neointimal proliferation, only primates develop calcified atherosclerotic plaque, and require years to approach the complex heterogeneity characteristic of advanced human coronary lesions. To underscore this difference, all pharmacologic treatments have failed when tested in clinical trials even when they proved highly effective in animals trials [22].
Chapter 1: Introduction
19
19The cellular signaling mechanisms that result in platelet deposition, thrombus formation, and smooth muscle cell proliferation begin in response to specific external stimuli. Gross mechanical deformation seems the most likely candidate for this stimulation; studies have documented that the extracellular matrix [23], smooth muscle cells [23, 24,25], and endothelial cells [26] all release smooth muscle cell mitogens when exposed to mechanical strain. Preliminary data has shown that the magnitude of restenosis is dependent on the stent geometry [16], lending added support for this hypothesis.
1.4.2 Mechanical arterial injury: during stent insertion
Mechanically-based arterial injury may occur during any of three stages of stent implantation: during insertion, during expansion, and chronic.
Prior to stent expansion, the stent/catheter system must be inserted into the stenosed arterial lumen. The lumen is usually first predilated with a balloon catheter placed over a guidewire to create sufficient room for the unexpanded stent. If the artery is severely occluded, the guidewire may leave the lumen and create a false lumen. If the false lumen is formed within the atherosclerotic lesion, strips of plaque may delaminate and occlude blood flow. As previously discussed, this may be treated with the placement of a second stent and is unlikely to directly injure the vessel. If however the false lumen is created deeper in the vessel wall, there will be tearing of the media and possible arterial puncturing. This type of injury is rarely reported clinically, and is unlikely to be the cause of the post-stenting neointima observed in animal models that develop only a soft atheroma.
1.4.3 Mechanical arterial injury: during stent expansion
Several different modes of vascular damage may occur during the short time period of stent expansion. The stent may not expand in an even manner, but instead transiently adopt shapes asymmetric with respect to either its longitudinal axis (e.g. a funnel), its circumferential angle (e.g. an ovoid cylinder) or both. These asymmetries may in turn either directly injure the artery by causing the stent struts to scrape or lacerate, may allow the delivery device to abrade the vessel wall, or may initiate a normal or shear strain-sensitive cellular signaling mechanism. The endothelium provides a natural marker for this type of injury; it is an exquisitely delicate structure that can completely be removed by even the gentle rubbing of a nylon monofilament loop. Recent data from this laboratory reveal that characteristic patterns of post-stenting endothelial denudation are likely caused during stent expansion (vs. chronic injury) since they can be first observed minutes after stent emplacement [15].
20 Chapter 1: Introduction
Arterial deformation may be completely characterized by a nine component strain tensor. Gross device expansion characteristics as described above can be quantified by characterizing only the external surface of the stent, which requires a four component strain tensor, of which three components are independent. As defined in cylindrical coordinates (Figure 1.7) these are: circumferential e which will tend to make the stent increase in diameter, torsional Eft which will tend to make the stent twist around its axis, and longitudinal Ezz which will tend to make the device lengthen or shorten. In general, this tensor varies as a function of location along the stent, and changes with time as the stent is expanded.
ZZ
&00 0
Figure 1.7: The two-dimensional strain field of a tubular surface
shown in cylindrical coordinates. The components E0, Ezz, and Eoz
are referred to in this thesis as circumferential, longitudinal, and torsional strains, respectively.
1.4.4 Mechanical arterial injury: chronic
The permanent nature of stents introduces chronic changes that may also influence the vascular response. The stent itself may elicit a material response from the artery, even when constructed from materials usually considered to be biocompatible [27, 28]. As earlier discussed, large strains such as those imposed by implants on the endothelium and media have been directly linked to production of smooth muscle cell growth factors [23-26]. Another possible initiator of the vascular repose to stenting arises from remodeling of the vascular wall to relieve chronic stress.. Fung has shown that rat pulmonary arteries subjected to hypoxic hypertension (which induces less than 20% of the strain induced by stenting) begin to change their zero-stress state in as little as 72 hours [29]. This permanent remodeling changes both the geometry of the
Chapter 1: Introduction
21
21arteries and the material properties of the tissue [30]. Vascular implants also alter the blood flow hemodynamics by introducing regions of turbulence, stagnation, flow separation, and altered wall shear [31]. This may explain why remodeling has been shown to depend at least in part on stent geometry [32]. Recent studies show that the endothelial lining is sensitive to spatial changes in shear force, and also that step dislocations of the wall shear such as imposed by stent struts cause endothelial cells' morphology to change over short distances on the order of 1 mm [17,33].
1.5 Arterial injury caused during device emplacement
Of the preceding modes of implant-caused vascular injury, I have chosen to examine the hypothesis that the acute and chronic tissue responses are influenced by the manner in which the implants are placed within the body. I have chosen this because:
1. It has been shown that deep injury to the media occurs during stent expansion, and this damage is linearly related to chronic levels of restenosis [4], and further
2. superficial injury to the endothelium also occurs during stent expansion [34],
3. yet there has been comparatively little research to understand the precise nature of the transitory mechanical phenomena that initiate these biological sequelae.
1.6 Thesis objective and organization
Thesis objective: Model and understand the interaction between the dynamic manner of implant expansion and the tissue response as a
function of the device geometry, the tissue characteristics, and the qualities of the exerted forces.
Specifically Chapter 2 will describe experimental quantification of stent expansion through measurement of the temporally and spatially-varying surface strain tensor developed on the arterial surface.
Chapter 3 uses this method to compare expansion characteristics of different stent geometries in different arteries using different expansion systems. Differences between the expansion characteristics of the stent systems are examined and the relationships between the manner of expansion and the superficial and deep injuries produced are analyzed. Minor modifications to existing stent designs are proposed that reduce these injuries, and the results of these modifications will be experimentally compared to unmodified designs.
As Chapter 3 examines stent expansion from a macroscopic viewpoint, Chapter 4 investigates the manner in which injury within each repetitive strut element may arise. One set of simulations were designed to both quantify the distribution of intrastrut in-plane strain that develops across each stent strut. A second set of simulations determine the relative positions of the balloon and luminal arterial surface to establish whether any normal forces are exerted by the balloon into the artery during stent expansion. The results of these simulations will be compared with histological evidence taken from animals stented with several stent geometries, and general rules for minimizing this mode of injury will be examined.
CHAPTER2
Measuring Arterial Strain
2.1
Introduction
Stent implantation imparts extreme vascular strains and focal mechanical injury to the vessel wall, ranging from denudation of the endothelial cell monolayer that covers the interior of the lumen, to progressive laceration of deeper vascular structures [4,35]. The amount of injury inflicted by the stent is not only a function of the final vessel enlargement ratio but also of the stent geometry [36] which dictates whether the stent axially contracts or twists as it circumferentially expands. This suggests that a more complete characterization of the form and extent of strain imparted by stents may deepen understanding of the vascular response to strain, and may also lead to improved endovascular implant designs that minimize injury.
To fully characterize the deformation of the arterial surface by the expanding stent, the circumferential, axial, and torsional components of the strain tensor must be determined. In general, these components vary as a function of location along the stent, and change with time as the stent is expanded. The ability to measure these in vivo is constrained by two factors not addressed by techniques presently in use. First, although it is necessary to track the three-dimensional locations of arterial markers over the curved arterial surface, the surgical incision required to expose the artery for imaging without altering its orientation and environment is deep and narrow, making a multiple-camera approach impractical. Second, as the strain field tensor varies along the length of the stent, it must be determined locally as a function of position along the artery. This chapter describes a method using a single camera to measure the dynamic, local strain tensor developed along the surface of a cylindrical wall as it deforms in an axisymmetric manner. Testing was performed in vitro on excised bovine arteries deformed by stenting to determine the method's suitability to measure stent-induced arterial strain. Accuracy was determined using a large-scale inflatable latex phantom. The feasibility of using this system to measure arterial strain in vivo was assessed on a rabbit undergoing stenting in both femoral arteries.
2.2
Methods
2.2.1 Experimental
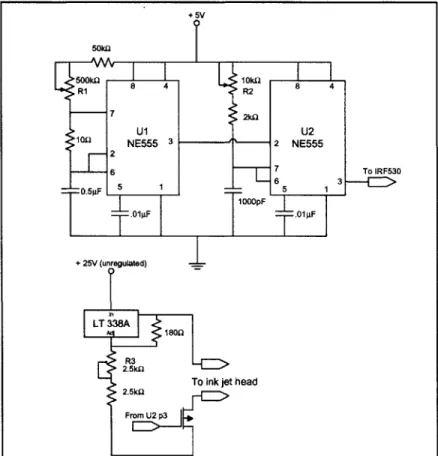
A system was developed to imprint the surface of the artery with a fine grid of high-contrast ink marks by mounting an ink-jet printer cartridge (Cannon CJ-3A) in a handheld stylus and driving it with a low-impedance squarewave (Figure 2.1). Benchtop testing showed the cartridge formed regular 50 gm to 250 pm marks when driven by a 24 V pulse train using a pulse-on duration from I to 20 gs. A 10 Hz train of 5 gs pulses was used to produce 150 pm arterial markings.
+ 5V 50k I R1 8 4 R2 8 4 7 2k U1 U2 1011 NE555 3 2 NE555 6 To IRF530 5 1 6 3 0.5iF --- 5 1
1
D0pFa .01pF .01p
F + 25V (unregulated) LT 338A 180Ql R3To ink jet head
2.5klA
Figure 2.1: Schematic diagram of driver for ink jet printer cartridge head. By altering pulse width and height by R2 and R3 respectively, the operator can control the quality of the marks (over and underdriving produces overspray) and the size of the marks from 50 pm to 250 gm. The operator controls the rate of mark production with Rl. Not shown are the 5V, 100 mA and 25V,
1A
switching power supplies, a momentary on/off switch mounted on the marking stylus, and a rotary selector switch to choose one of the nine ink jet ports available on the Cannon CJ-3A cartridge.
Chapter 2: Measuring strain
Experimental data were recorded using an imaging system (Figure 2.2) consisting of a deep-field zoom lens (Computar 18-108 mm, f2.5) with attached polarizing lens mounted on a CCD camera with 640x480 pixel resolution (Hitachi VC-C370). The camera's NTSC signal was recorded on an S-VHS system, channeled to a frame grabber (Raster-Ops 24XLTV) via S-video cable, and digitized to 640x400 pixel resolution. The strain measuring system was first tested using excised bovine coronary arteries deformed by a stainless steel endovascular stent (Advanced Cardiovascular Systems/Guidant) mounted on a 3 mm
polyethylene balloon catheter (Advanced Cardiovascular
Systems/Guidant). The arterial surface was marked using the ink-jet system and imaged as the catheter was inflated to a maximum pressure of 8 atm in 2 atm steps. To determine the accuracy of the strain measurements, a large-scale latex phantom artery was imaged as it underwent deformation using the same setup shown in Figure 2.2. We hand-marked a grid upon the phantom, and recorded data as the tube was inflated in step increments from an average diameter of 46 cm to 175 cm. After each step the tube was allowed to stabilize for
1 minute to
reduce creep or other viscoelastic effects that might confound manual measurements. The distances between 60 pairs of markers were hand-measured, yielding the circumferential, axial, and torsional strain components at 20 locations on the phantom's surface. The image was concomitantly digitized with a comparable field-of-view to the bovine coronary experiment, and the digitized data were processed with the strain measuring system for comparison.VCR computer-based Image acquisition CCD digitizing board arteryballoon catheter reference marks
Figure 2.2: Diagram of the strain measuring system. An image acquisition subsystem records and analyses a sequence of digitized video images of an artery marked with ink reference points as a stent is expanded inside the marked region. For the phantom experiments, a large marked latex tube was inflated by a compressed air source as it was imaged by the same system.
Chapter 2: Measuring strain
27
27In vivo feasibility was demonstrated by measuring the arterial strain in a rabbit undergoing stent implantation in both femoral arteries. A 3.4 kg New Zealand rabbit was anaesthetized with ketamine (35 mg/kg IM) and sodium pentobarbital (Nembutal, 4 mg/kg IM), and a length of each femoral artery was exposed and cleaned of fascia in preparation for the arteriotomy (Figure 2.3). The length of artery isolated was approximately 5 cm longer than required for the arteriotomy, and after the incision was performed a hemicylindrical black plastic cradle was placed behind the excess length to improve contrast of the arterial envelope. The artery was marked in a gridded fashion using the inkjet stylus and a corrugated-ring stainless steel stent (Advanced Cardiovascular Systems/Guidant multilink 3 mm x 12 mm) mounted on a 3mm compliant balloon angioplasty catheter was advanced to the marked section. The balloon catheter was slowly pressurized to 8 atm, expanding the stent while the artery was imaged with the same apparatus used for the in vitro experiments.
stent in femoral a.
arterial cradle
arteriotomy
-
balloon catheter
Figure 2.3: In vivo feasibility study. The femoral arteries of a rabbit were exposed, gently cleaned of loose facia, and ligated. A 3 mm diameter endovascular stent mounted on a compliant 3 mm balloon catheter was inserted into an arteriotomy. The stented region was marked in a gridded fashion and imaged while the stent was slowly expanded to 8 atm.
28
Chapter 2: Measuring strain
Chapter 2: Measuring strain2.2.2 Analytical
Strain data were extracted from the digitized images through several intermediate processing steps (code in Appendix A). To determine three-dimensional locations of the markers from each two-dimensional frame, the artery was assumed to be axisymmetric; i.e. in {r,
6,
z}cylindrical co-ordinates of equation r =fz). The outer envelope of the vessel was digitized and a general two-dimensional quadratic equation fit to the envelope. The general quadratic equation, of the form A r2 + B
r z + C z2 + D r + E z = 1 was chosen to model the vessel's envelope
because of its flexibility; with few coefficients it can model two line segments that are parallel, converging (a section cut from an ellipse), or diverging (a hyperbola of two sheets). The coefficients were determined using the Nelder-Meade non-linear least-squares algorithm [37] implemented in the Matlab programming language. Once the two-dimensional equations describing the stent envelope were determined, their paths were swept around their longitudinal axis to create a three-dimensional axially-symmetric quadratic surface model. The locations of the reference marks from each two-dimensional frame were back-projected onto this three-dimensional model and the three-dimensional locations stored for strain analysis.
The surface strain components {See, Ezz,
ez}
can be determined within a uniformly-strained triangular region if the change in distance between the vertex points are known [38]. Triads of reference points were automatically grouped by computer under the assumption that the strain, although highly non-uniform over the 12mm length of the stent, varied in space sufficiently gradually between neighboring markers so that a good local approximation could be found using adjacent markers located 0.5-1.0 mm apart. The algorithm that grouped the reference points assigned a weighted score to each potential triad. A positive weight was associated with triads including points separated by an empirically-determined optimal distance. Points separated too widely average-out the locally varying tensor field, reducing the spatial resolution of the system. Points grouped too closely together suffer from a high error-to-measurement ratio caused by additive uncertainties in position. A negative score was associated with triads constraining points progressively closer to the edge of the artery model as they generate exaggerated position measurement error because of the sensitivity of the back-projection. In a typical artery, approximately 40 reference marks were formed, providing nearly 60,000 possible triads. Of these, 50 possibly overlapping triads were chosen as optimal based upon this weighted score. Once chosen, the strain tensor within each reference-point triad was determined and associated with the corresponding area on the arterial surface. Areas of the arterial surface that lacked suitable reference point triads were associated with the strain tensor from the nearest reference point triad. If the earlier assumption of axial symmetry was valid each axial slice should have the same strain tensor, independent of 0. The strain tensor for all segments within each axial slice was therefore replaced with the average tensor for the entire slice, and an alert was generated if any of the values varied from the average by more than 10%.Chapter 2: Measuring strain
29
2.3 Results
2.3.1 In vitro artery segment
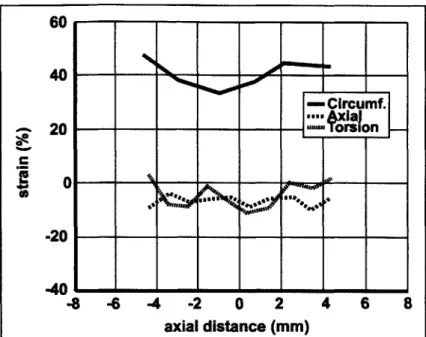
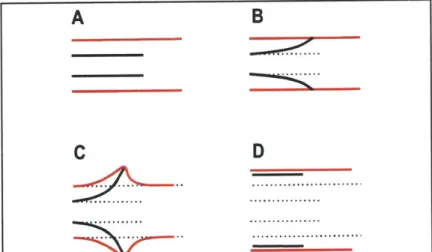
The system was able to accurately measure large strains in a 2mm diameter excised bovine coronary artery expanded by a 3mm balloon-expandable stent. At 2 atm of pressure (Figure 2.4) the stent had not yet expanded sufficiently to contact the arterial wall. There was so little circumferential expansion at this point that both proximal and distal ends appear slightly bowed inwards, although this is likely measurement error since the system's measurements have a standard deviation of approximately 10%. As the balloon catheter pressure was increased to 4 atm the proximal (left in Figure 2.5) end of the stent began to inflate first, with relatively small gain in luminal area compared to the initial diameter. At 6 atm both proximal (left in Figure 2.6) and distal sides enlarged, leaving the center of the stent less expanded. Torsional strain components remained near zero, while the axial strain became clearly negative, reflecting arterial shortening during circumferential expansion. As the pressure increased to 8 atm the balloon/stent unit expanded to fully contact the arterial wall along its length and the arterial surface regained a cylindrical appearance (Figure 2.7). The proximal end relaxed inwards, becoming slightly less open than the distal region. The small torsional component of strain indicates that twisting around the longitudinal axis remained nearly zero throughout the expansion, although the negative axial component indicates the artery contracted 10% to 20% in length.
6C
4C
2C
I-4.. 0xa-6
-4
-2
0
2
axial distance (mm)
4 6 8Figure 2.4: Arterial surface strain tensor components after in vitro stent expansion to 2 atm. The horizontal axis represents distance along the length of the artery.
60
40
Oft -0 200
-20 -40-8 -6
Figure 2.5: Arterial stent expansion to 4 end first. -4 -2 U 2 4 0 0axial distance (mm)
surface strain tensor components after in vitro atm. The stent has begun to expand proximal
Chapter 2: Measuring strain
31- Circumf. --- --- x-) 0 -- -- __ -
----0
-Circumf. --- .A,,alal- --
- -io
--
--- oo--2 31 Chapter 2: Measuring strainNO
%ft4
6
8
axial -4 d2 0 2axial distance (mm)
Figure 2.6: Arterial surface strain tensor components after in vitro stent expansion to 6 atm. Both stent ends have deployed
leaving the center of the artery unsupported.
4C
--
2C
0 -2( -40 1 -8-8
I8
6
Figure 2.7: Arterial surface strain tensor components after in vitro stent expansion to 8 atm. The stent's middle region has expanded and circumferential strain is now evenly distributed along the length of the stent. Notice the degree of axial contraction that has occurred as the center expanded.
32
Chapter 2: Measuring strain-6 -4 -2 0 2 4 axial distance (mm)
0
)
-- - - - -_____ ______ ... * 0 - - -- --- -- --- -Circumf. - - -n--- ___ _ __ ' _ 6 2 -2 -A6C
6 82.3.2 Latex phantom
To examine the errors inherent in the strain measuring system, a large scale cylindrical latex phantom was inflated, and strain was measured both by the imaging system and directly using calipers. Measuring inter-mark distances by hand eliminated errors from the limited resolution of the imaging system and the modeling assumptions inherent in backprojection. Six sets of measurements were taken at incremental stages of increasing balloon radius. The system error was defined as the difference between the computed strain tensor and the true strain tensor as determined by direct hand-measurement. The error is zero mean (p<0.03) and is plotted in Figure 2.8.
Circumferential ...
.I.F..
i *Axial . .. . . . .
Torsional * * * 0 ft e .
-8 -4 0 4 8 12
Strain error (%)
Figure 2.8: The accuracy of the strain measuring system was demonstrated by comparing the magnitude of the strain tensor it calculated on the oversize latex phantom with a hand-measured reference. The difference between these values are plotted above for each component of the strain tensor. The mean and upper and lower quartiles are also shown. The root-mean-square measurement error of the system is 4.1%.
The assumption that the artery is axisymmetric and has a quadratic surface of revolution was also examined. Table 2.1 shows the standard deviation Ye of the measured arterial/phantom radii r, around the least-squares fit quadratic surface r(x;) as a percentage of the average radius. The standard deviation was calculated as
1/2
cre = 11(r, - r(x, ))2
Chapter 2: Measuring strain 33
for N = 10 equispaced points along the sample's length. The standard deviation of the error is a small fraction of the average radius, indicating that the arterial/phantom surfaces are nearly quadratic.
Table 2.1: Determining the validity of the assumption that the artery and phantom are axisymmetric and have a quadratic surface. The standard deviation of the error is shown as a percentage of the mean radius. Values tending toward zero indicate close agreement of the quadratic envelope to the measured envelope.
Phantom Bovine coronary Rabbit femoral
Step number Pressure (atm)
&
Pressure (atmr r r 0 0.023 0 0.016 0 0.032 1 0.12 2 0.018 2 0.042 2 0.10 4 0.090 4 0.091 3 0.044 6 0.048 6 0.081 4 0.032 8 0.061 8 0.052 2.3.3 In vivo artery
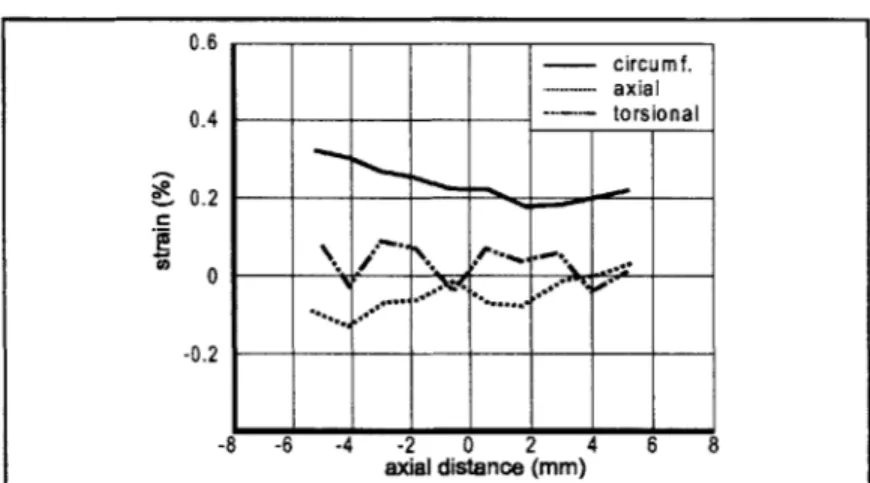
The feasibility of using this system in vivo was demonstrated by deployment of an endovascular stent within both femoral arteries of a rabbit. The results of arterial marking are shown in Figure 2.9. The moisture on the arterial surface did not impede marking, and there was negligible mark spread due to diffusion. There was a notable circumferential mark spread post-expansion proportional caused by circumferential strain. An example of the calculated arterial strain tensor is shown in Figure 2.10 for a balloon expansion pressure of 6 atm. This pressure corresponded to the maximum end-first expansion timepoint for both arteries, and both can be seen opening proximal (left) side first, in a similar manner to the in vitro experiments. The limited field of view imposed by the surgical environment did not impair the ability of the system to measure the strain tensor, although glare caused by the surgical lamps did require installation of a polarizing lens on the camera.
34 Chapter 2: Measuring strain
£0 0.8 0.6 0.4 0.2
0
left righto *
Circumf. 0 3 N Axial 0 0 A A Torsion0
0 000
0
* 0 e 05f
-I
-0.41--- I . 4 -4 -2 0 2 4 6mm
Figure 2.10: The system can measure strains in an in vivo environment. Here strains are shown generated in two rabbit femoral arteries by 3 mm stents mounted on balloon catheters pressurized to 4 atm. The end-first opening characteristic can be clearly seen, accompanied by slight axial shortening and relatively minor torsion, similar to that seen in vitro at similar pressures.
Chapter 2: Measuring strain
35A
A
P-
I
A
ZA
A
Figure 2.9: The ink-jet marking method was tested in an in vivo environment. An exposed rabbit femoral artery is shown here proximal to the site of arteriotomy before and after marking with
150gm
dots. The artery is translucent in a live animal showing the underlying corrugated ring stent..5 A Ir *_ - -
-t
35 Chapter 2: Measuring strain
2.4 Discussion
We sought to measure the strain imparted to arteries by endovascular stents, as this may be an important determinant of the biological response to these implants. We chose to use the Green tensor formulation [39]as have several other investigators of biologic strains [40,41,42,43].
Of the nine components of triaxial, or solid strain that exist, four can be measured using surface marks alone, and of these biaxial or surface strains, three components are independent. As defined in cylindrical co-ordinates {r, 0, z} these are: circumferential ce which will tend to make the cylinder increase in diameter, torsional c2 which will tend to make the artery twist around its axis, and longitudinal
ez
which will tend to make the artery lengthen.2.4.1 Approaches to measuring strain in biologic materials
The determination of surface strains in low-modulus biological materials such as arteries is not a new problem, and recent advances in imaging and computation systems have made several new measurement methods possible. The large deformations experienced by compliant tissues favor the use of non-contact systems that image tissue-bound markers using a variety of media, including: light ([38,41,42], and others), ultrasound [44], x-rays [43,45], and phase-contrast magnetic-resonance [46]. The most common method used to measure strain in compliant tissues involves marking the specimen before optically imaging the displacement. Ink has been applied to specimens both directly [47] and by sprinkling using the bristles of a toothbrush [48]. Others have used inert particles such as vanilla-bean pieces pressed into the specimen surface [49] or fluorescently-labeled microspheres [50] to achieve the high-contrast needed to identify the markers amidst the visual noise of ambient glare and the irregular surface of moist tissue. Displacement over curved surfaces has been measured using multiple cameras [51,43] to gain three-dimensional displacement information.
Our characterization of the locally-varying strain field imparted by an expanding stent to an intact artery has two unique requirements not addressed by the above techniques. First, although it is necessary to track the three-dimensional locations of arterial markers over the curved arterial surface in vivo, the surgical incision required to expose the artery for imaging is deep and narrow, making a multiple-camera approach impractical. Second, the strain field tensor varies along the length of the stent, and so it must be determined locally as a function of position along the artery.
As shown in Figures 2.4 -2.7 the strain measuring system described in this article satisfies these criteria, and was used to quantify patterns of stent-induced arterial deformation in both in vitro and in vivo environments. Consistent with behavior in clinical settings, the test stent
36 Chapter 2: Measuring strain
opened from its extreme distal and proximal ends inwards which created a slightly dogbone shaped surface as the balloon catheter was inflated to 6 atm. The center region deployed once the balloon pressure increased to 8 atm, which created a more uniform cylindrical envelope. The expansion of the center region from 6-8 atm was accompanied by the first significant levels of observed axial shortening. The nonuniform strain along the length of the stented artery and the presence of negative axial strains separate stent expansion from the expected uniform behavior of balloon-alone expansion.
The system's ability to measure arterial strains in a surgical environment was demonstrated by the in vivo experiments, which showed more extreme examples of end-first opening than occurred in vitro. The primary factor complicating measurements was glare from the surgical lamps that interfered with the camera. The addition of a polarizing filter reduced but did not eliminate glare. Slight translations and rotations of the artery caused by cardiac and respiratory cycles did not affect measurement accuracy, since the strain tensor is calculated by noting the change in the distance between mark positions, not the change of the mark positions themselves [50].
2.4.2 Error analysis
The three primary contributors of error in the computed strain tensor, henceforth called calculated strain, are lack of arterial axial symmetry, poor fit of the longitudinal envelope to a quadratic model, and measurement inaccuracies from limited resolution of the digitized image. The magnitudes of these errors are difficult to measure directly on the 2 mm diameter artery, and the highly non-linear method of marker association into triads does not lend itself to theoretical methods of error analysis. For these reasons we constructed a large-scale latex phantom which allowed us to hand-measure the distance between markers.
The assumptions that the artery is axisymmetric and fits the quadratic envelope of a cylinder, elliptic section, or hyperboloid is surprisingly small for the in vitro, in vivo, and phantom samples we investigated (Table 2.1) and contributes less than 10% of the total error. This would not be the case for tortuous arteries such as the human coronary that display little symmetry; backprojection of marker locations in this type of vessel would require a more generalized model of arterial shape. The primary source of error in our investigations arises from the limited resolution of the camera and has two components: spatial quantization that is a function of the finite number of CCD elements within the camera, and the limited line resolution of the S-video standard used to encode the analog video signal. These sources are hardware-dependent and difficult to reduce. Although increasing the magnification to make the stented region completely fill the field of view of the camera would decrease this error, it would be hard to do so in vivo because of motion
Chapter 2: Measuring strain 3737
between the camera and stent from natural cardiac and respiratory cycles, and movements of the catheter during inflation.
The standard deviation of the strain tensor error components is calculated as
r ((N
,-and is shown in Figure 2.8. These data show that the system measures all three components of the strain tensor accurately to a standard deviation of approximately 4%. Since the error is primarily derived from camera quantization error which is not a function of strain, we expect similar measurement errors in an in vivo environment.
The strain tensor computed as a function of three specific markers represents the average strain experienced within that marker triad. The system's spatial resolution, or ability to localize changes in strain, is therefore limited to the average distance between these markers. We chose to examine marker triads separated by 0.75 -1 mm which struck a reasonable balance between spatial resolution and the effect of digitization error on strain measurement accuracy. This spatial resolution allows us to examine macroscopically how vascular implants expand and move, although it does make the system insensitive to large changes in strain over a short distance such as might occur in the immediate vicinity of a 0.25 mm strut. Spatial resolution may be improved through the use of higher magnification at the expense of limiting the field of view.
38 Chapter 2: Measuring strain
2.5 Conclusions
As use of medical implants grow more common it has become increasingly important to understand how these devices mechanically interact with tissue in their native in vivo environment. Endovascular stents, for example, engender a tissue response that is likely a function of the extreme levels of strain they impose, yet these have not been rigorously measured in vivo.
The technique described in this chapter is an important step towards this goal. This method can determine the complete surface strain tensor developed along any straight and observable axisymmetric surface undergoing large-scale deformations, and can describe how the tensor changes in space and time. It can do so in an in vivo environment using a single camera. Further, the development of a system that can create marks as small as 50 gm permits this method to be used with fine
structures such as vessels of several millimeters diameter.
Chapter 2: Measuring strain 39