HAL Id: hal-00317376
https://hal.archives-ouvertes.fr/hal-00317376
Submitted on 8 Apr 2004
HAL is a multi-disciplinary open access
archive for the deposit and dissemination of
sci-entific research documents, whether they are
pub-lished or not. The documents may come from
teaching and research institutions in France or
abroad, or from public or private research centers.
L’archive ouverte pluridisciplinaire HAL, est
destinée au dépôt et à la diffusion de documents
scientifiques de niveau recherche, publiés ou non,
émanant des établissements d’enseignement et de
recherche français ou étrangers, des laboratoires
publics ou privés.
The effects of high-frequency ULF wave activity on the
spectral characteristics of coherent HF radar returns: a
case study
D. M. Wright, T. K. Yeoman, E. E. Woodfield
To cite this version:
D. M. Wright, T. K. Yeoman, E. E. Woodfield. The effects of high-frequency ULF wave activity on the
spectral characteristics of coherent HF radar returns: a case study. Annales Geophysicae, European
Geosciences Union, 2004, 22 (5), pp.1843-1849. �hal-00317376�
Annales Geophysicae (2004) 22: 1843–1849 SRef-ID: 1432-0576/ag/2004-22-1843 © European Geosciences Union 2004
Annales
Geophysicae
The effects of high-frequency ULF wave activity on the spectral
characteristics of coherent HF radar returns: a case study
D. M. Wright1, T. K. Yeoman1, and E. E. Woodfield2
1Department of Physics and Astronomy, University of Leicester, University Road, Leicester, LE1 7RH, UK
2National Center for Atmospheric Research/High Altitude Observatory, P.O. Box 3000, Boulder, Colorado, 80307-3000, USA
Received: 4 December 2003 – Revised: 15 January 2004 – Accepted: 19 January 2004 – Published: 8 April 2004
Abstract. It is now a common practice to employ ground-based radars in an attempt to distinguish between those re-gions of the Earth’s upper atmosphere which are magnet-ically conjugate to open and closed magnetic field lines. Radar returns from ionospheric irregularities inside the polar cap and cusp regions generally exhibit large spectral widths in contrast to those which exist on closed field lines at lower latitudes. It has been suggested that the so-called Spectral Width Boundary (SWB) might act as a proxy for the open-closed field line boundary (OCFLB), which would then be an invaluable tool for investigating reconnection rates in the magnetosphere. The exact cause of the increased spectral widths observed at very high latitudes is still subject to con-siderable debate. Several mechanisms have been proposed. This paper compares a dusk-sector interval of coherent HF radar data with measurements made by an induction coil magnetometer located at Tromsø, Norway (66◦N geomag-netic). On this occasion, a number of equatorward excur-sions of the SWB in the radar backscatter are accompanied by increases in spectral power of ULF waves in the Pc1-2 fre-quency band as the SWB passes overhead. Thus, these obser-vations support the possibility that high-frequency magneto-spheric wave activity at least contribute to the observed spec-tral characteristics and that such wave activity might play a significant role in the nightside ionosphere.
Key words. Ionosphere (auroral ionosphere) – Magneto-spheric physics (MHD waves and instabilities) – Radio sci-ence (ionospheric physics)
1 Introduction
The use of ground-based radars for making observations of the terrestrial ionosphere and the subsequent diagnosis of dynamic magnetospheric regions and processes is well founded. The Super Dual Auroral Radar Network (Super-Correspondence to: D. M. Wright
DARN; Greenwald et al., 1995) of HF coherent radars is pri-marily designed to monitor the global ionospheric convec-tion pattern, which traces the moconvec-tion of magnetospheric field lines under the influence of solar-terrestrial coupling. An-other important application of these radars involves sounding the very high latitude ionosphere in the polar cap and cusp, in order to diagnose the dynamic phenomena which are on-going in these regions. The spectral width associated with backscatter from ionospheric irregularities is variable and of-ten exhibits sharp boundaries, which relate to changes in the overlying geophysical regimes. In fact, it has been proposed that the boundary between high and low spectral widths, the latter usually occurring at lower latitudes, might be a good way of identifying the open-closed field line bound-ary (OCFLB). There seems to be a very good agreement be-tween the OCFLB and the Spectral Width Boundary (SWB) on the dayside. However, recent studies involving space-craft measurements of high energy particles in the magneto-sphere and auroral imager observations in conjunction with ground-based measurements have indicated that these two demarcators are not always coincident. These observations are the subject of a forthcoming paper. Presented in this pa-per are data from the Hankasalmi, Finland radar, one of the CUTLASS (Co-operative UK Twin Located Auroral Sound-ing System; Milan et al., 1997) bistatic pair and a subset of SuperDARN. The observed radar spectral widths associated with a series of dusk-sector equatorward-propagating tran-sient features are compared with dynamic spectral measure-ments of the Pc1-2 wave band from a newly deployed induc-tion coil magnetometer located in Tromsø, Norway.
The SuperDARN radars transmit a multipulse code and the received signals for each range gate are converted into an autocorrelation function (ACF). Parameters, such as the backscatter power (relating to irregularity intensity), line-of-sight velocity of the scattering irregularities and the spec-tral width can be extracted from the ACF after it is pro-cessed using the fitacf fitting routine (e.g. Villain et al., 1987). It is well known that the spectral width of coher-ent HF radar returns is sensitive to the various regions of
1844 D. M. Wright et al.: The effects of high-frequency ULF wave activity on coherent HF radar returns the ionosphere and the dynamic processes in the coupled
magnetosphere-ionosphere system (e.g. Baker et al., 1995; Lester et al., 2001; Woodfield et al., 2002). A number of mechanisms have been suggested to explain the increased spectral widths associated with radar backscatter from the cusp. These include (Andr´e et al., 2000b) micro-scale tur-bulence affecting the ionospheric irregularities, the existence of time-varying electric fields caused by ULF wave activity, strong flow shears in the large-scale convection pattern and inhomogeneities localised within the radar range cell, such as small-scale field-aligned currents and vortices.
Baker et al. (1995) and Moen et al. (2001) showed that HF radar echoes from the cusp commonly exhibit multiple-peaked spectra with large widths. Andr´e et al. (1999, 2000a, b) suggested that these widths might be the result of ULF wave activity in the Pc1-2 band, which are often ob-served at cusp latitudes (e.g. Maynard et al., 1991; Menk et al., 1992; Erlandson and Anderson, 1996; Dyrud et al., 1997). Andr´e et al. (1999, 2000a, b) modelled the effects of broad-band ESIC waves and narrow-band EMIC waves on HF radar observations. However, an error in their modelling code failed to properly account for time-dependent veloc-ity variations associated with the wave electric field (Pono-marenko and Waters, 2003) and as a result, overestimated the effects of ion-cyclotron waves on HF radar observations. As a consequence, Ponomarenko and Waters (2003) favour small-scale spatio-temporal structures due to particle precip-itation inside a radar range cell for causing the observed large spectral widths in the cusp regions. Thus, the significance of high-frequency waves to large radar spectral widths is still a matter of great debate. However, away from the cusp re-gion, Wright et al. (2004) presented CUTLASS radar spec-tral widths associated with irregularities artificially generated by the EISCAT (European Incoherent Scatter) high power heating facility at Tromsø (Rietveld et al., 1993). They re-ported increases in spectral width which occurred during pe-riods of Pc1–2 wave activity, as detected by an induction coil magnetometer at Kilpisj¨arvi, Finland. The increased spec-tral widths were observed to be correlated, both spatially and temporally, with localised regions of Pc4 waves believed to be driven by wave-particle interactions between field-line eigenmodes and unstable drifting energetic ion-populations constituting part of the ring current. Wright et al. (2004) interpreted the spectral width features as the result of high-frequency ion-cyclotron wave activity, driven by the same energetic ions, causing a broadening of the received radar spectra. They also suggested that this effect might provide a proxy for investigation of high-frequency wave activity in-side the cusp.
At high latitudes, waves with frequencies in the Pc1–2 range (0.1–5 Hz) include both electrostatic ion cyclotron (ESIC) and electromagnetic ion cyclotron (EMIC) waves. In contrast to ground magnetometers, which measure magnetic signatures, radars detect changes in electric fields. Thus, a ground magnetometer will only detect EMIC waves and those ESIC waves that are associated with current systems (and therefore have a magnetic signature). Technically then,
Pc1–2 waves are those detected on the ground by magne-tometers. ULF waves in this frequency band in the nightside magnetosphere are generally classified as Pi1 waves, where the “i” refers to their irregular, non-continuous wave period. PiB waves are a subset of Pi1s (e.g. Heacock, 1967), which are generally associated with the occurrence of substorms and pseudo-breakups (e.g. Akasofu, 1964; Troitskaya, 1961) and have been used to identify their onset. PiBs are charac-terised by broad-band wave activity appearing in a burst-like fashion.
This paper discusses an interval of HF radar data where features exhibiting large spectral widths are observed si-multaneously with broad-band high-frequency wave activ-ity and which appear to be related to substorm and pseudo-breakup occurrence. In their standard mode of operation auto-correlation functions (ACFs) are formed every 100 ms and thus this could sample the electric fields associated with waves in the Pc1–2 band without a loss of temporal resolu-tion. However, in an attempt to reduce cross-range noise the radar data are subsequently integrated to provide one mea-surement every 3 or 7 s, and this reduction in temporal res-olution will lead to a loss of spectral information associated with individual waves which will then act to broaden individ-ual spectra.
2 Instrumentation
The ionospheric convection velocities presented in this pa-per were measured by the Hankasalmi radar which forms one-half of the CUTLASS bistatic HF radar (Milan et al., 1997). They have overlapping fields of view, which, in their standard operational mode, encompass the ionosphere over Northern Scandinavia and the northern polar cap region at higher latitudes. Signals returned to the radars have under-gone a Bragg-like backscattering process from field-aligned electron density irregularities in the ionosphere. The CUT-LASS data reproduced here have a range resolution of 45 km (with the first range starting at 180 km from the radar) and a temporal resolution of 1 min on each beam.
The Wave Excitation Experimental Diagnostic (WEED) is an induction coil magnetometer designed to observe high-frequency waves in the Pc1-2 band. It was recently deployed at the Tromsø Geophysical Observatory (69.7◦N, 19.4◦E ge-ographic) and consists of two orthogonally aligned sensors monitoring magnetic field variations in northwards and east-wards directions (−dH/dt and −dD/dt, respectively). It sam-ples data at 0.1 s resolution. It is most responsive to wave fre-quencies of about 1 Hz. These measurements are also com-plemented by data from a fluxgate magnetometer located at Tromsø (TRO), which has a time resolution of 10 s and is part of the IMAGE Scandinavian magnetometer chain.
3 Observations and discussion
The data presented in this section were recorded on the 9 November 2002 in the interval 21:00–00:00 UT. Spectral
D. M. Wright et al.: The effects of high-frequency ULF wave activity on coherent HF radar returns 1845 -100 0 100 X (nT) 0 40 80 Y (nT) 21:00 21:30 22:00 22:30 23:00 23:30 00:00 UT 15 30 45 60 75 Range gate 15 30 45 60 75 Range gate 0 100 200 300 400 Width (m s -1 ) Ionospheric scat only Beam 5 0.5 1.0 1.5 2.0 f (Hz) 0.5 1.0 1.5 2.0 f (Hz)
Norm: Max disp power, Peak pow: 1.61906e-05; Thrsh: 0.50
Win/Slip: 120/60 s 0.50 0.60 0.70 0.80 0.90 Fraction of Peak Power
SUPERDARN PARAMETER PLOT
Finland (width_l), WEED (-dH/dt) and TRO (X,Y)
9 Nov 2002
(313)fast normal (ccw) scan mode (151)
-dH/dt
Figure 1
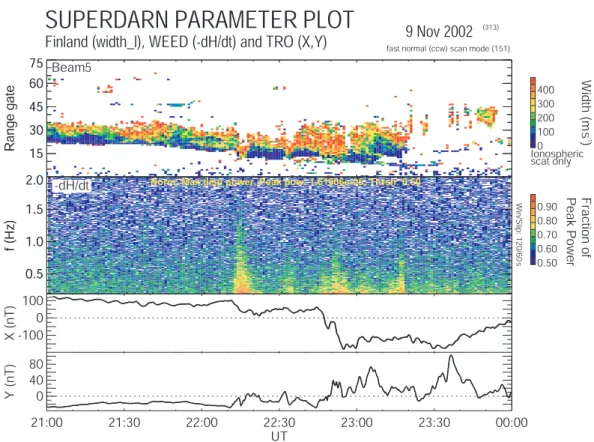
Fig. 1. Top: Spectral width (width l) data from beam 5 of the CUTLASS, Finland radar from 21:00–00:00 UT on 9 November 2002. The
range resolution of the data is 15 km and the lag to first range (range 0) is 180 km. Middle: The spectral power of −dH/dt measured by the Wave Excitation Experimental Diagnostic (WEED) over the same interval. The sample rate of the raw data was 0.1 s, and a window and slip of 120 s and 60 s, respectively, were employed in the dynamic spectral analysis. Bottom: Simultaneous X- and Y- component data from the Tromsø (TRO) IMAGE magnetometer.
width data from beam 5 of the CUTLASS Hankasalmi (Fin-land) radar are shown in the top panel of Fig. 1. Beam 5 overlays Tromsø and data from the magnetometers at this lo-cation are illustrated in the lower two panels of Fig. 1. The middle panel shows the time evolution of the dynamic spec-tral power of the WEED observations in the frequency range 0.1–2 Hz (representing most of the Pc1–2 band). There are no significant features observed above 2 Hz. The data from the TRO magnetometer are also plotted in the lower panel of this figure. In the examination of the data prior to (not shown) and including the interval shown in Fig. 1, it is clear that the radar scatter moves gradually equatorwards (towards the radar). This is likely to be related to a combination of an expanding polar cap due to a substorm growth phase and to the relative position of the auroral oval with respect to the radar location as the Earth rotates. The backscatter exhibits a sharp spectral width boundary (SWB) where the poleward scatter have widths considerably >200 m s−1in contrast to
those at lower latitudes which are typically <100 m s−1. If the data from 22:00–23:00 UT are examined more closely, a number of equatorward excursions of the SWB are apparent, most notably as “bursts” in the spectral width commencing at about 22:10, 22:30 and 22:40 UT. In each case a distinct and sudden enhancement of the spectral power measured by
WEED is apparent. The spectral width features move rapidly equatorwards and pass over Tromsø, which is conjugate to range gate 17 of beam 5 in the CUTLASS data. Measure-ments made over the whole IMAGE magnetometer chain, of which only TRO are shown here (lower panel of Fig. 1), sug-gest that these events are related to substorm activity. The spectral width features at 22:10 and 22:30 UT coincide with what appears to be pseudo-breakups, and these precede a substorm onset just after 22:40 UT which seems to be respon-sible for the radar features at that time.
This paper aims to address what is causing the associated changes in the spectral width parameter. During the substorm process, distended field lines dipolarise, releasing their mag-netic tension as they travel towards the Earth. This also leads to the motion of plasma trapped on the field line in question, resulting in plasma precipitation into the ionosphere. In ad-dition, some of the energy released during the magnetic field dipolarisation and subsequent ringing of the field lines will occur in the form of Alfv´en waves travelling along the field lines towards the Earth. Sometimes the wave activity occurs over a broad frequency range covering the Pc1-5 bands. As discussed earlier, bursty and broad-band wave energy of this type manifests itself on the ground as a PiB signature.
1846 D. M. Wright et al.: The effects of high-frequency ULF wave activity on coherent HF radar returns 200 400 600 Velocity (ms -1 )
vel (beam 5, range 17)
200 400 600 800 Width (ms -1 )
width_l (beam 5, range 17)
4 6 8 WEED Pc1-2 Power 21:30 22:00 22:30 23:00 23:30 UT 10 20 30 40 WEED Pc1-5 Power
SUPERDARN PARAMETER PLOT
Finland (vel and width_l) and WEED Spectral Power 9 Nov 2002
2 Power x10 -4 Power x10 -4 0 (a) (b) (c) (d) A B CD E F G Figure 2
Fig. 2. Stacked time series of the line-of-sight velocity (a) and spectral width (b) from range 17 on beam 5 of the CUTLASS, Finland
radar along with WEED summed spectral power in the (c) 0.1–5 Hz and (d) 0.002–5 Hz frequency bands (solid line: −dD/dt; dashed line:
−dH/dt).
The modulations of WEED spectral power (middle panel, Fig. 1) indicate that there is a clear correlation between the magnetic signatures on the ground and the radar spec-tra as the features pass over Tromsø. Plotted in Fig. 2c is the summed −dH/dt and −dD/dt spectral power detected by the WEED magnetometer in the frequency range 0.1– 5 Hz (equivalent to the combined Pc1-2 bands). Also shown (Fig. 2d) is the total spectral power across the whole equiva-lent Pc1-5 band (0.002–5 Hz). Although a perfect one-to-one relationship between the radar measurements and the broad-band wave power on the ground does not exist (see Figs. 2b– d), it can be seen that a number of common features can be identified. In general, the spectral power in the whole ULF wave band most closely correlates with the variation on the spectral width. However, the Pc1-2 power variations appear strongly related to the width changes. Common increases in
radar spectral width and WEED Pc1-2 power are observed at around 22:10, 22:30 and 22:40 UT (marked by the vertical dashed lines labelled A–C). Comparison of the WEED spec-tral power variations (Figs. 2c and 2d) with time series of the line-of-sight velocity and spectral width at range 17 (Figs. 2a and 2b, respectively), clearly show that when there is an in-crease in high-frequency wave power (Fig. 2c), there is al-ways a corresponding increase in the radar spectral width. This is indicated by the dashed lines marked A–G on Fig. 2. However, it should be noted that there appears to be no cor-relation between the magnitudes of these respective changes. The effect also appears to be distinct from the effects of the broad-band wave power, as illustrated in Fig. 2d. Through-out this interval the beam 5 line-of sight velocity detected by the radar indicates that flow was generally towards the radar, with an average flow speed of 300–400 m s−1. The radar at
D. M. Wright et al.: The effects of high-frequency ULF wave activity on coherent HF radar returns 1847
SUPERDARN PARAMETER PLOT
Hankasalmi Beam 5: width_l
9 Nov 2002
width_l
(m s-1)
# peaks
Figure 3
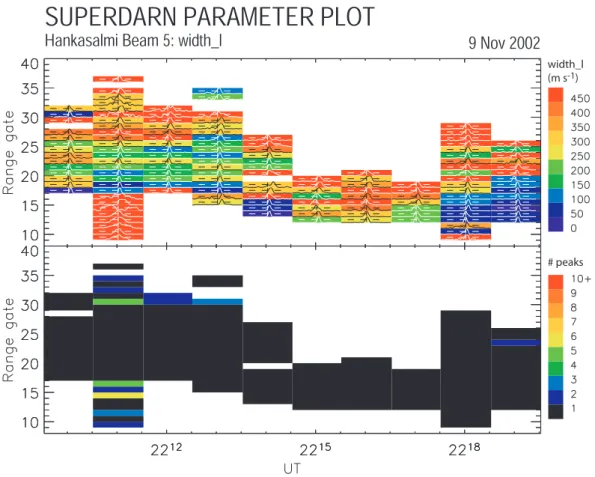
Fig. 3. Top: Spectral width (width l) data from the CUTLASS Finland radar in the same format as Fig. 1 but for the interval 22:09:30–
22:19:30 UT. Overlaid on each cell are velocity power spectra derived from the FFT of the radar ACF directly. Vertical lines indicate zero Doppler velocity. Bottom: The number of spectral peaks identified, within 3 dB of the peak spectral power.
this time is located very close to local midnight, and these flows are consistent with antisunward irregularity flow over the pole, forming part of the global convection pattern. How-ever, most of the increases in high-frequency wave power la-belled A–G, including those associated with the bursty spec-tral width features (A–C), are coincident with, or shortly fol-lowed by, sudden and short-lived reductions (and sometimes reversals) of the line-of-sight flow of up to 400 m s−1. It seems likely that this effect is related to the substorm-type processes which are ongoing in the magnetotail. However, these observations will be the subject of a future study.
The observations presented here support the view that, for this event, high-frequency wave activity could be the cause of the increases in the radar spectral width. On this day, the radar integrated its data over 3 s and this would then smooth out any effects due to the rapidly varying wave electric fields (see Sect. 1). The only way to properly resolve these mod-ulations would be to examine the radar data at the pulse-sequence repetition rate of 100 ms. Such experiments are currently being undertaken.
There has been much discussion regarding the expected form of the received radar spectra. It has been suggested (Baker et al., 1995; Moen et al., 2001; Andr´e et al., 2000b) that many of the mechanisms which might lead to
modifi-cation of the radar ACF would generate multi-peaked spec-tra. These would, in general, be the result of short-scale spatio-temporal changes occurring within a radar range cell. For example, a strong velocity shear or a vortical structure perhaps caused by a small-scale field-aligned current sys-tem would present more than one velocity component to the radar, and these would appear as multiple components in the radar spectra. In contrast to this, single component broadened spectra would be expected from electric fields ex-hibiting fast temporal variation due to the combination of the low spectral resolution of the radar measurements and the data integration subsequently performed by the radar in order to remove cross-range noise. ULF wave activity in the Pc1-2 band would then be expected to cause broad but single-component spectra. Highly complex spatio-temporal structures could also lead to similar broadening, if the ACF failed to resolve the multiple velocity components separately. Figure 3 addresses this issue for the data presented here. The top panel of Fig. 3 shows a section of the radar spec-tral width data displayed in Fig. 1. The data for the in-terval 22:09:30–22:19:30 UT have been selected since they cover the first equatorward excursion of the spectral width features (see Fig. 1). Overlaid on each colour-coded range cell is the appropriate power spectrum derived from the fast
1848 D. M. Wright et al.: The effects of high-frequency ULF wave activity on coherent HF radar returns Fourier transform of the radar ACF. The lower panel of Fig. 3
is colour-coded to show the number of discernible spectral peaks from the spectra in the top panel. Only those spectral peaks which are greater than a threshold of 50% of the peak power in each spectrum are included (this level is marked by the horizontal dashed line in the spectra of the top panel). Figure 3 then clearly shows that the radar spectra during this interval do not possess multiple peaks and, in fact, exhibit only one broad spectral peak. This suggests that if high-frequency waves are dominating the received radar spectra, then the broad-band electric field modulations detected by the radar are being smoothed out by a combination of the spectral resolution of the ACF and the subsequent fitting pro-cess routinely applied to the data. In addition, the spectral widths of the features in the radar data peak at values of around 400 m s−1, which implies that the Pc1-2 waves must
be modulating the velocity by up to 200 m s−1 (equivalent
to electric fields of ∼10 mV m−1). This is consistent with
spacecraft observations of the electric fields associated with conjugate ground measurements of Pc1 waves in the auroral zone (e.g. Erlandson et al., 1990; Mursula et al., 2001).
4 Summary
The purpose of this paper was to discuss a potential mech-anism causing large spectral widths in coherent HF radar measurements. During an interval when the spectral width boundary exhibited a series of sudden equatorward moving bursts, broad-band ULF wave activity was detected on the ground at Tromsø using a new induction coil magnetometer called WEED. These features appear to be related to pseudo-breakups and substorm onsets observed over the Scandina-vian sector near local midnight. A detailed discussion of the magnetospheric processes responsible for these bursty spec-tral changes is the subject of a future study. However, the clear correlation between the broadening of the radar spec-tra and the occurrence of high-frequency wave activity pro-vides evidence to support the suggestion that such short time-scale processes may lead to increased spectral widths. This certainly appears to be the case for this interval at least. It is likely that spectral broadening is the direct result of the smoothing of the electric field modulations associated with the ULF waves as a result of integrating the backscattered signal received by the radar. The investigation of such cesses offers the opportunity to gain insight into similar pro-cesses which are observed at higher latitudes. The mech-anisms causing the characteristically high spectral widths recorded in the cusp is still a matter of considerable debate.
Acknowledgements. The authors would like to thank Steve Milan
and Mark Lester for helpful discussions relating to this paper. We are also grateful to Lisa Baddeley and Mick Parsons for their par-ticipation in the deployment of the WEED magnetometer.
The editor in Chief thanks a referee for his help in evaluating this paper.
References
Akasofu, S.-I.: The development of auroral substorm, Planet. Space Sci., 12, 273, 1964.
Andr´e, R., Pinnock, M., and Rodger, A. S.: On the SuperDARN autocorrelation function observed in the ionospheric cusp, Geo-phys. Res. Lett., 26, 3353, 1999.
Andr´e, R., Pinnock, M., and Rodger, A. S.: Identification of the low-altitude cusp by Super Dual Auroral Radar Network radars: A physical explanation for the empirically derived signature, J. Geophys. Res., 105, 27 081, 2000a.
Andr´e, R., Pinnock, M., Villain, J.-P., and Hanuise, C.: On the factors conditioning the Doppler spectral width determined from SuperDARN HF radars, Int. J. Geomag. Aeron., 2, 77, 2000b. Baker, K. B., Dudeney, J. R., Greenwald, R. A., Pinnock, M.,
Newell, P. T., Rodger, A. S., Mattin, N., and Meng, C.-I.: HF radar signatures of the cusp and low-latitude boundary layer, J. Geophys. Res., 100, 7671, 1995.
Dyrud, L. P., Engebretson, M. J., Posch, J. L., Hughes, W. J., Fukun-ishi, H., Arnoldy, R. L., Newell, P. T., and Horne, R. B.: Ground observations and possible source regions of two types of Pc1-2 micropulsations at very high latitudes, J. Geophys. Res., 10Pc1-2, 27 011, 1997.
Erlandson, R. E. and Anderson, B. J.: Pc1 waves in the ionosphere: a statistical study, J. Geophys. Res., 101, 7843, 1996.
Erlandson, R. E., Zanetti, L. J., Potemra, T. A., Block, L. P., and Holmgren, G.: Viking magnetic and electric field observations of Pc1 waves at high latitudes, J. Geophys. Res., 95, 5941, 1990. Greenwald, R. A. , Baker, K. B., Dudeney, J. R., Pinnock, M., Jones, T. B., Thomas, E. C., Villain, J.-P., Cerisier, J.-C., Se-nior, C., Hanuise, C., Hunsucker, R. D., Sofko, G., Koehler, J., Nielsen, E., Pellinen, R., Walker, A. D. M., Sato, N., and Yam-agishi, H.: DARN/SuperDARN: a global view of the dynamics of high-latitude convection, Space Sci. Rev., 71, 761, 1995. Heacock, R. R.: Two subtypes of Pi micropulsations, J. Geophys.
Res., 72, 3905, 1967.
Lester, M., Milan, S. E., Besser, V., and Smith, R.: A case study of HF radar spectra and 630.0 nm auroral emission in the pre midnight sector, Ann. Geophys., 19, 327, 2001.
Maynard, N. C., Aggson, T. L., Basinska, E. M., Burke, W. J., Craven, P., Peterson, W. J., Sugiura, M., and Weimer, D. R.: Magnetospheric boundary dynamics: DE1 and DE2 observations near the magnetopause and cusp, J. Geophys. Res., 96, 3505, 1991.
Menk, F. W., Fraser, B. J., Hansen, H. I., Newell, P. T., Meng, C.-I., and Morris, R. J.: Identification of the magnetospheric cusp and cleft using Pc1-2 ULF pulsations, J. Atmos. Terr. Phys., 54, 1021, 1992.
Milan, S. E., Yeoman, T. K., Lester, M., Thomas, E. C., and Jones, T. B.: Initial backscatter occurrence statistics from the CUT-LASS HF radars, Ann. Geophys., 15, 703, 1997.
Moen, J., Carlson, H. C., Milan, S. E., Shumilov, N., Lybekk, B., Sandholt, P. E., and Lester, M.: On the collocation between day-side auroral activity and coherent HF radar backscatter, Ann. Geophys., 9, 1531, 2001.
Mursula, K., Br¨aysy, T., Niskala, K., and Russell, C. T.: Pc1 pearls revisited: structured electromagnetic ion cyclotron waves on Po-lar satellite and on ground, J. Geophys. Res., 106, 29 543, 2001. Ponomarenko, P. V. and Waters, C. L.: The role of Pc1-2 waves in spectral broadening of SuperDARN echoes from high latitudes, J. Geophys. Res., 30, 1122, 2003.
D. M. Wright et al.: The effects of high-frequency ULF wave activity on coherent HF radar returns 1849 Rietveld, M. T., Kohl, H., Kopka, H., and Stubbe, P.: Introduction
to ionospheric heating at Tromsø – I. Experimental overview, J. Atmos. Terr. Phys., 55, 577, 1993.
Troitskaya, V. A.: Pulsations of the Earth’s electromagnetic field with periods of 1 to 15 seconds and their connection with phe-nomena in the high atmosphere, J. Geophys. Res., 66, 5, 1961. Villain J.-P., Greenwald, R. A., Baker, K. B., Ruohoniemi, J. M.:
HF radar observations of E region plasma irregularities produced by oblique electron streaming, J. Geophys. Res., 92, 12 327, 1987.
Woodfield, E. E., Davies, J. A., Eglitis, P., and Lester, M.: High and variable spectral width in the pre-dawn sector: A case study involving CUTLASS, EISCAT, ESR and optical data, Ann. Geo-phys., 20, 501, 2002.
Wright, D. M., Yeoman, T. K., Baddeley, L. J., Davies, J. A., Dhillon, R. S., Lester, M., Milan, S. E., and Woodfield, E. E.: High resolution observations of spectral width features associ-ated with ULF wave signatures in artificial HF radar backscatter, Ann. Geophys., 22, 169, 2004.